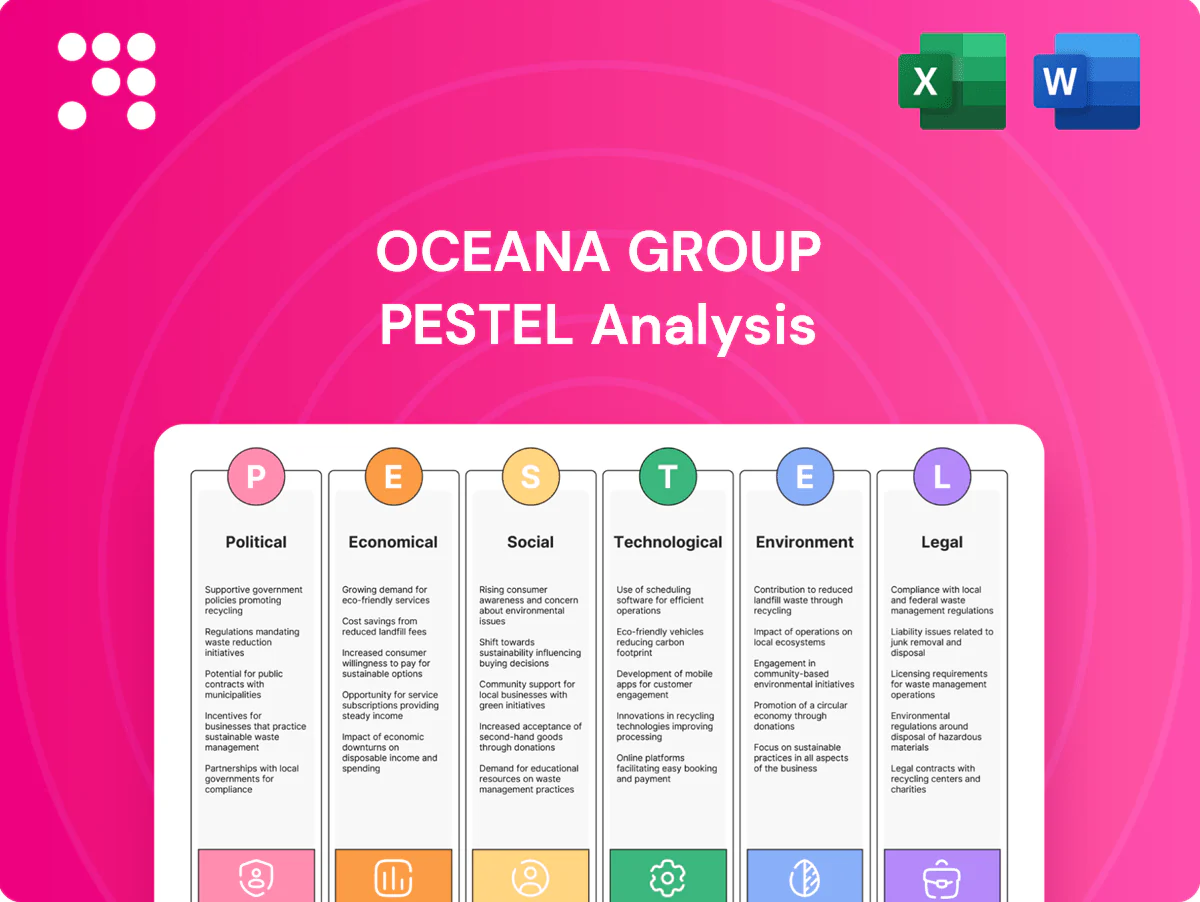
Oceana Group PESTLE Analysis

Your Competitive Advantage Starts with This Report
Unlock how political shifts, economic cycles, and environmental pressures are reshaping Oceana Group’s strategy and margins—insights that matter to investors and executives alike. This concise PESTLE snapshot highlights risk areas and growth levers you can act on today. Purchase the full analysis for the detailed, ready-to-use briefing and downloadable templates.
Political factors

Quota and TAC volatility
Annual TAC changes directly alter supply, utilization and fleet deployment; with 34% of global fish stocks reported as overfished by FAO (2022), sudden cuts to pilchard, hake or horse mackerel quotas can compress margins and idle processing plants. Proactive, science-based lobbying has helped stabilise allocations in recent seasons, and Oceana’s geographic spread across South Africa and Namibia offsets single-jurisdiction quota risk.
Fisheries governance stability
Policy consistency in key jurisdictions where Oceana operates — notably South Africa, Namibia and the U.S. — underpins long-term investment in vessels and plants. Shifts in ministerial leadership or policy priorities can delay permits for months, slowing capex schedules. Multi-year (typically 3–5 year) management plans improve predictability for capital expenditure planning. Regular stakeholder forums have reduced industrial versus small-scale conflict and eased access negotiations.

Trade and tariff regimes
Export markets for canned fish and frozen products are highly sensitive to tariffs, rules of origin and sanitary protocols such as EU Regulation 853/2004; preferential access under arrangements like the SADC EPA can widen margins via reduced duties. Geopolitical tensions risk shipping disruptions and non-tariff barriers. Diversifying into multiple regions reduces single-market exposure.

Subsidies and fuel policies
Fuel taxes, rebates and subsidies materially shift Oceana Group's fishing operating costs and margins; volatile fuel policy raises short-term cost risk while rebates/cold‑chain grants improve processing competitiveness. International moves to remove harmful fisheries subsidies (estimated around 22 billion USD annually by FAO/OECD reports) could reconfigure global fleet dynamics. Hedging and vessel efficiency programs are used to mitigate policy swings.
- fuel policy impact: direct cost volatility
- processing/cold‑chain incentives: capex competitiveness
- removal of harmful subsidies (~22bn USD): alters global competition
- mitigants: fuel hedging, efficiency upgrades
Community and employment politics
Political pressure to safeguard coastal jobs shapes licence conditions and B-BBEE transformation expectations (30% ownership target common), while South Africa's 2024 unemployment (~33%) heightens stakes for Oceana's communities; misalignment can spark protests and operational disruptions. Social compacts and inclusive procurement/training secure legitimacy and reduce risk.
- Licence & transformation pressure — B-BBEE 30% target
- 2024 SA unemployment ~33% increases local sensitivity
- Social compacts reduce protest risk
- Inclusive procurement & training build political goodwill
Falling TACs, subsidy reform and B-BBEE squeeze SA fishing margins and market access
Annual TAC cuts (34% of stocks overfished, FAO 2022) and fuel policy volatility compress margins and risk plant downtime; multi-year plans and lobbying have eased allocation uncertainty. Export tariffs and sanitary rules affect market access while removal of harmful subsidies (~22 billion USD) could reshape fleet competition. B-BBEE 30% targets and SA unemployment ~33% (2024) raise local employment and licence pressures.
| Factor | Metric | Impact |
|---|---|---|
| TAC/fisheries | 34% overfished | Quota risk |
| Harmful subsidies | ~22bn USD | Fleet dynamics |
| SA socio | Unemployment 33% (2024) | Licence/social pressure |
| B-BBEE | 30% target | Ownership/permits |
What is included in the product
 Detailed Word Document
Explores how external macro-environmental factors uniquely affect the Oceana Group across Political, Economic, Social, Technological, Environmental and Legal dimensions, tailored to its fisheries and seafood processing footprint. Every section is data-backed, forward-looking and formatted for executive reports and strategic planning.

 Customizable Excel Spreadsheet
Visually segmented by PESTLE categories for quick interpretation at a glance, the Oceana Group PESTLE summary is a clean, presentation-ready brief that can be dropped into slides or strategy sessions and allows users to add context-specific notes for regional or business-line relevance.
Economic factors

Global seafood demand cycles
Global per-capita fish consumption is about 20 kg (FAO 2022), underpinning steady protein demand and making canned fish relatively price-inelastic, which supports Oceana Group revenue stability even as prices fluctuate.
Economic downturns historically shift demand toward value formats like canned pilchards, while premium lobster and squid remain linked to discretionary spend and hospitality recovery; the global seafood market is ~USD170bn (2023 est.).
Optimizing channel mix between retail, foodservice and exports cushions cyclical swings by reallocating volumes to resilient retail canned lines when hospitality lags.
Input cost inflation
Input-cost inflation in 2024–25—driven by higher marine gasoil, rising tinplate prices and elevated cold-chain energy consumption—materially pressured Oceana Group margins, with energy and packaging cited as primary drivers in the 2024 annual report; currency weakness amplifies imported-input prices while improving rand-denominated export realizations. Long-term supplier contracts and operational efficiency improvements were highlighted as key mitigants. Cost pass-through was constrained and depended on brand strength and market structure.

Exchange rate volatility
Oceana's multi-currency exposure stems from USD‑denominated exports and imported capex; USD/ZAR averaged about 19.6 mid‑2025, so a 10% rand depreciation raises rand export revenues by roughly 10% while similarly inflating USD input costs. Group hedging policies smooth earnings but introduce basis risk; U.S. operations provide a partial natural hedge.

Capital intensity and ROIC
Oceana’s fishing vessels (often US$10–40m each), canneries, fishmeal plants and cold stores require sizable, lumpy capex, with processing and cold-chain projects commonly costing tens of millions of dollars and multi-year paybacks.
Asset utilization is driven by catch rates and strong seasonality; high fixed costs amplify operating leverage, widening ROIC swings in up and down cycles; disciplined capital allocation and preventive maintenance sustain ROIC.
- Capex: vessels US$10–40m; processing/cold-chain projects: tens of millions
- Drivers: catch rates, seasonality → utilization volatility
- Impact: high fixed costs magnify operating leverage and ROIC variability
- Mitigation: disciplined allocation and maintenance preserve ROIC
Logistics and supply chain costs
Logistics and supply chain costs materially affect Oceana Group: reefer availability and port efficiency drive delivery reliability and landed costs, with Drewry WCI spot rates averaging about 2,000 USD per 40ft in 2024 and contributing to higher freight cost volatility.
Disruptions have forced higher inventories and raised working capital needs; near-market processing and flexible routing improved resilience in 2024–25, while strategic inventory buffers preserved service levels.
- Reefer capacity: constrained seasonally, raising premium transport costs
- Port efficiency: turnaround variability increases landed-cost risk
- Container rates: WCI ~2,000 USD (2024 average) impacts margins
- Mitigation: near-market processing, routing flexibility, strategic buffers
Falling TACs, subsidy reform and B-BBEE squeeze SA fishing margins and market access
Global per‑capita fish consumption ~20 kg (FAO 2022) and a ~USD170bn seafood market (2023) support stable canned demand; premium lines track discretionary spend. Input-cost inflation (energy, tinplate) and shipping WCI ~USD2,000 (2024) squeezed margins; USD/ZAR ~19.6 mid‑2025 amplifies currency effects. High capex (vessels US$10–40m) and seasonality heighten operating leverage.
| Metric | Value |
|---|---|
| Per‑capita fish (kg) | 20 (FAO 2022) |
| Seafood market | ~USD170bn (2023) |
| WCI | ~USD2,000 (2024) |
| USD/ZAR | ~19.6 (mid‑2025) |
| Vessel capex | US$10–40m |
Preview Before You Purchase
Oceana Group PESTLE Analysis
The Oceana Group PESTLE Analysis preview shown here is the exact document you’ll receive after purchase—fully formatted and ready to use. This is a real, professionally structured file with no placeholders or teasers. The layout, content, and structure visible here are exactly what you’ll download immediately after payment.

Original: $10.00
-65%$10.00
$3.50Product Information
Product Information
Shipping & Returns
Shipping & Returns
Description
Your Competitive Advantage Starts with This Report
Unlock how political shifts, economic cycles, and environmental pressures are reshaping Oceana Group’s strategy and margins—insights that matter to investors and executives alike. This concise PESTLE snapshot highlights risk areas and growth levers you can act on today. Purchase the full analysis for the detailed, ready-to-use briefing and downloadable templates.
Political factors
Quota and TAC volatility
Annual TAC changes directly alter supply, utilization and fleet deployment; with 34% of global fish stocks reported as overfished by FAO (2022), sudden cuts to pilchard, hake or horse mackerel quotas can compress margins and idle processing plants. Proactive, science-based lobbying has helped stabilise allocations in recent seasons, and Oceana’s geographic spread across South Africa and Namibia offsets single-jurisdiction quota risk.
Fisheries governance stability
Policy consistency in key jurisdictions where Oceana operates — notably South Africa, Namibia and the U.S. — underpins long-term investment in vessels and plants. Shifts in ministerial leadership or policy priorities can delay permits for months, slowing capex schedules. Multi-year (typically 3–5 year) management plans improve predictability for capital expenditure planning. Regular stakeholder forums have reduced industrial versus small-scale conflict and eased access negotiations.
Trade and tariff regimes
Export markets for canned fish and frozen products are highly sensitive to tariffs, rules of origin and sanitary protocols such as EU Regulation 853/2004; preferential access under arrangements like the SADC EPA can widen margins via reduced duties. Geopolitical tensions risk shipping disruptions and non-tariff barriers. Diversifying into multiple regions reduces single-market exposure.
Subsidies and fuel policies
Fuel taxes, rebates and subsidies materially shift Oceana Group's fishing operating costs and margins; volatile fuel policy raises short-term cost risk while rebates/cold‑chain grants improve processing competitiveness. International moves to remove harmful fisheries subsidies (estimated around 22 billion USD annually by FAO/OECD reports) could reconfigure global fleet dynamics. Hedging and vessel efficiency programs are used to mitigate policy swings.
- fuel policy impact: direct cost volatility
- processing/cold‑chain incentives: capex competitiveness
- removal of harmful subsidies (~22bn USD): alters global competition
- mitigants: fuel hedging, efficiency upgrades
Community and employment politics
Political pressure to safeguard coastal jobs shapes licence conditions and B-BBEE transformation expectations (30% ownership target common), while South Africa's 2024 unemployment (~33%) heightens stakes for Oceana's communities; misalignment can spark protests and operational disruptions. Social compacts and inclusive procurement/training secure legitimacy and reduce risk.
- Licence & transformation pressure — B-BBEE 30% target
- 2024 SA unemployment ~33% increases local sensitivity
- Social compacts reduce protest risk
- Inclusive procurement & training build political goodwill
Falling TACs, subsidy reform and B-BBEE squeeze SA fishing margins and market access
Annual TAC cuts (34% of stocks overfished, FAO 2022) and fuel policy volatility compress margins and risk plant downtime; multi-year plans and lobbying have eased allocation uncertainty. Export tariffs and sanitary rules affect market access while removal of harmful subsidies (~22 billion USD) could reshape fleet competition. B-BBEE 30% targets and SA unemployment ~33% (2024) raise local employment and licence pressures.
| Factor | Metric | Impact |
|---|---|---|
| TAC/fisheries | 34% overfished | Quota risk |
| Harmful subsidies | ~22bn USD | Fleet dynamics |
| SA socio | Unemployment 33% (2024) | Licence/social pressure |
| B-BBEE | 30% target | Ownership/permits |
What is included in the product
Detailed Word Document
Explores how external macro-environmental factors uniquely affect the Oceana Group across Political, Economic, Social, Technological, Environmental and Legal dimensions, tailored to its fisheries and seafood processing footprint. Every section is data-backed, forward-looking and formatted for executive reports and strategic planning.
Customizable Excel Spreadsheet
Visually segmented by PESTLE categories for quick interpretation at a glance, the Oceana Group PESTLE summary is a clean, presentation-ready brief that can be dropped into slides or strategy sessions and allows users to add context-specific notes for regional or business-line relevance.
Economic factors
Global seafood demand cycles
Global per-capita fish consumption is about 20 kg (FAO 2022), underpinning steady protein demand and making canned fish relatively price-inelastic, which supports Oceana Group revenue stability even as prices fluctuate.
Economic downturns historically shift demand toward value formats like canned pilchards, while premium lobster and squid remain linked to discretionary spend and hospitality recovery; the global seafood market is ~USD170bn (2023 est.).
Optimizing channel mix between retail, foodservice and exports cushions cyclical swings by reallocating volumes to resilient retail canned lines when hospitality lags.
Input cost inflation
Input-cost inflation in 2024–25—driven by higher marine gasoil, rising tinplate prices and elevated cold-chain energy consumption—materially pressured Oceana Group margins, with energy and packaging cited as primary drivers in the 2024 annual report; currency weakness amplifies imported-input prices while improving rand-denominated export realizations. Long-term supplier contracts and operational efficiency improvements were highlighted as key mitigants. Cost pass-through was constrained and depended on brand strength and market structure.
Exchange rate volatility
Oceana's multi-currency exposure stems from USD‑denominated exports and imported capex; USD/ZAR averaged about 19.6 mid‑2025, so a 10% rand depreciation raises rand export revenues by roughly 10% while similarly inflating USD input costs. Group hedging policies smooth earnings but introduce basis risk; U.S. operations provide a partial natural hedge.
Capital intensity and ROIC
Oceana’s fishing vessels (often US$10–40m each), canneries, fishmeal plants and cold stores require sizable, lumpy capex, with processing and cold-chain projects commonly costing tens of millions of dollars and multi-year paybacks.
Asset utilization is driven by catch rates and strong seasonality; high fixed costs amplify operating leverage, widening ROIC swings in up and down cycles; disciplined capital allocation and preventive maintenance sustain ROIC.
- Capex: vessels US$10–40m; processing/cold-chain projects: tens of millions
- Drivers: catch rates, seasonality → utilization volatility
- Impact: high fixed costs magnify operating leverage and ROIC variability
- Mitigation: disciplined allocation and maintenance preserve ROIC
Logistics and supply chain costs
Logistics and supply chain costs materially affect Oceana Group: reefer availability and port efficiency drive delivery reliability and landed costs, with Drewry WCI spot rates averaging about 2,000 USD per 40ft in 2024 and contributing to higher freight cost volatility.
Disruptions have forced higher inventories and raised working capital needs; near-market processing and flexible routing improved resilience in 2024–25, while strategic inventory buffers preserved service levels.
- Reefer capacity: constrained seasonally, raising premium transport costs
- Port efficiency: turnaround variability increases landed-cost risk
- Container rates: WCI ~2,000 USD (2024 average) impacts margins
- Mitigation: near-market processing, routing flexibility, strategic buffers
Falling TACs, subsidy reform and B-BBEE squeeze SA fishing margins and market access
Global per‑capita fish consumption ~20 kg (FAO 2022) and a ~USD170bn seafood market (2023) support stable canned demand; premium lines track discretionary spend. Input-cost inflation (energy, tinplate) and shipping WCI ~USD2,000 (2024) squeezed margins; USD/ZAR ~19.6 mid‑2025 amplifies currency effects. High capex (vessels US$10–40m) and seasonality heighten operating leverage.
| Metric | Value |
|---|---|
| Per‑capita fish (kg) | 20 (FAO 2022) |
| Seafood market | ~USD170bn (2023) |
| WCI | ~USD2,000 (2024) |
| USD/ZAR | ~19.6 (mid‑2025) |
| Vessel capex | US$10–40m |
Preview Before You Purchase
Oceana Group PESTLE Analysis
The Oceana Group PESTLE Analysis preview shown here is the exact document you’ll receive after purchase—fully formatted and ready to use. This is a real, professionally structured file with no placeholders or teasers. The layout, content, and structure visible here are exactly what you’ll download immediately after payment.











