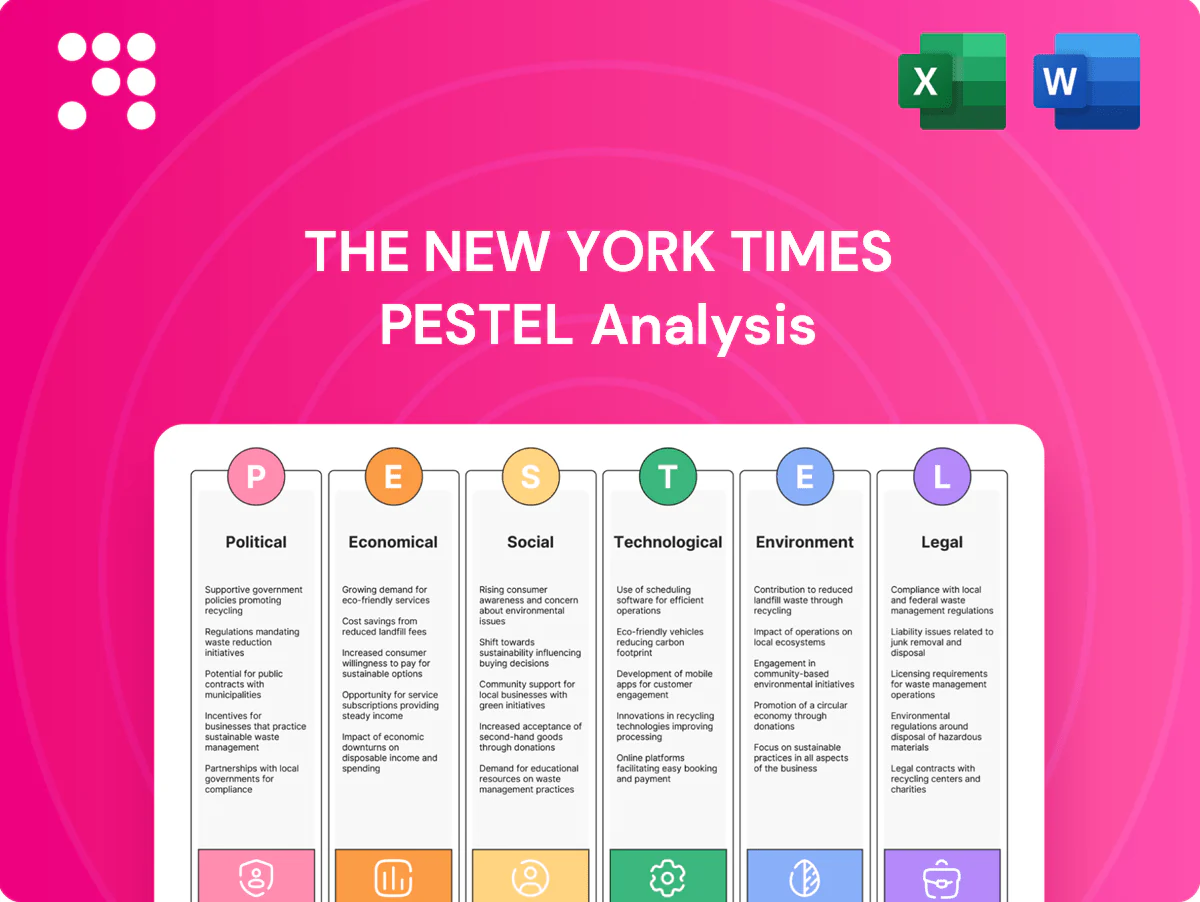
The New York Times PESTLE Analysis

Your Shortcut to Market Insight Starts Here
Gain a competitive edge with our PESTLE analysis of The New York Times. It maps political, economic, social, technological, legal and environmental forces shaping strategy and revenue streams. Buy the full report for detailed, editable insights and actionable recommendations ready for boardrooms and investment pitches.
Political factors

Press freedom and regulation
Shifts in press freedom and media regulation directly affect NYT newsgathering, access, and reporter protections, with the company serving over 10 million paid subscribers in 2024 and reliant on robust investigative output. Changes in shield laws or source protection—debated across multiple US states in 2024—can raise legal risk and litigation costs for investigative pieces. International operations face diverse censorship and licensing regimes that can increase compliance costs and slow content distribution in key markets.
Platform and content moderation policy
Government scrutiny of platforms, via rules like the EU Digital Services Act that targets services with over 45 million users, reshapes referral traffic and distribution for The New York Times. Mandated transparency and takedown regimes change what content surfaces and demands adaptive editorial and technical controls. News bargaining codes (eg Australia) have shifted revenue splits with platforms and pushed payments to publishers. Compliance requires ongoing legal teams and agile platform partnerships.

Electoral cycles and polarization
Election seasons boost demand for outlets like The New York Times—Pew Research found 57% of U.S. adults followed the 2020 election very closely—while elevating misinformation risks highlighted in the Reuters Institute 2024 reporting. Polarization can grow subscriptions but also prompt advertiser or reader boycotts. Coverage choices draw regulatory and political scrutiny, and CPJ and local reports show rising safety threats to journalists and correspondents.

Public media funding and competition
Trade, sanctions, and geopolitics
Cross-border data flows and journalist visas are critical for NYT global reporting; with the company reporting roughly $2.1B revenue in 2023 and digital subscribers near 10.9M by 2024, disruptions hurt distribution and licensing income. Sanctions on markets such as Russia and Iran limit ad sales and partnerships, while geopolitical instability raises correspondent security and insurance costs. Currency swings and compliance add measurable risk to international subscriptions and programmatic ads.
- Data/visa dependency: global licensing strain
- Sanctions: blocked monetization in sanctioned markets
- Safety costs: higher insurance for field reporters
- FX/compliance: revenue volatility in international ops
Platform and political shifts threaten major news publisher; 10.9M subs
Political shifts in press freedom, platform regulation and election cycles materially affect The New York Times operations, legal risk and revenue mix, with ~10.9M digital subscribers (2024) and $2.1B revenue (2023). EU rules like the DSA (45M user threshold) and national bargaining codes alter traffic and platform payments; subsidies and broadband funding (CPB ~465M FY2024; BEAD 42.45B) change competition and reach.
| Metric | Value |
|---|---|
| Digital subs (2024) | 10.9M |
| Revenue (2023) | $2.1B |
| EU DSA threshold | 45M users |
| CPB funding (FY2024) | $465M |
| BEAD broadband | $42.45B |
What is included in the product
 Detailed Word Document
Explores how macro-environmental factors uniquely affect The New York Times across Political, Economic, Social, Technological, Environmental, and Legal dimensions, with data-driven, forward-looking insights and concrete sub-points to support executives, consultants, and investors in strategy, risk mitigation, and funding decisions.

 Customizable Excel Spreadsheet
A concise, visually segmented PESTLE summary of The New York Times that relieves meeting prep pain—easy to drop into slides, edit with region- or business-specific notes, and share across teams for fast alignment on external risks and strategic positioning.
Economic factors

Advertising cyclicality
Ad markets track GDP and interest rates—with Fed funds near 5.25–5.5% in 2024—so brand-budget pullbacks hit display and branded content first while direct-response often stays resilient; shifts toward performance channels compress CPMs and raise programmatic supply pressure, forcing the New York Times to employ tight yield management, granular inventory control and dynamic forecasting to protect revenue per impression.
Subscription growth and ARPU
Subscriber additions and price optimization underpin NYT revenue stability, with the company reporting about 11.1 million paid subscribers and total revenue of $2.2 billion in the trailing twelve months to Q1 2025, reflecting steady ARPU gains from selective price increases. Intro offers lift trials but can dilute ARPU and raised churn in 2024 test cohorts. Bundles for news, games, cooking and audio increased customer lifetime value in recent quarters. Data-led segmentation drives higher upsell and retention rates.

Cost inflation and productivity
Wage, printing, and distribution costs continue to pressure margins amid a large newsroom headcount and physical production needs; The New York Times reported about 10.9 million total paid subscribers (end-2023), keeping print scale but not offsetting rising costs. Technology investments can boost newsroom efficiency and unit economics through automation and CMS upgrades. Vendor and cloud costs are material—global public cloud spending hit roughly $599.4 billion in 2023—so disciplined procurement is essential. Optimizing real estate footprint can free cash flow by reducing leases and facility overhead.

Competitive landscape
The New York Times faces competition from national outlets, niche verticals, platforms, and independent creators.
Substitution from free news and newsletters—Substack surpassed 1,000,000 paying subscribers in 2023—intensifies price sensitivity.
Differentiation relies on brand authority, investigative journalism, and product-bundle depth; NYT reported 9.6 million paid subscribers as of Q2 2024, making marketing efficiency a critical lever to lower CAC and boost retention.
- competition: national, niche, platforms, creators
- substitution: Substack 1,000,000+ paid (2023)
- diff: brand, investigations, bundles
- metric: NYT 9.6M paid subscribers (Q2 2024)
- focus: marketing efficiency, CAC & retention
FX and international exposure
Foreign subscribers introduce currency-driven revenue swings; The New York Times reported about 10.9 million total subscribers in mid-2024, making international FX moves materially affect reported digital revenue.
Pricing and localization drive penetration and churn abroad while payment processing fees—which vary by country and method—erode margins; corporate hedging policies can partially smooth reported quarterly results.
- FX exposure: material with ~10.9M subs (mid-2024)
- Pricing/localization: impacts churn and growth
- Payment fees: vary by market/method
- Hedging: used to stabilize reported revenue
Platform and political shifts threaten major news publisher; 10.9M subs
Ad demand tied to GDP and higher rates (Fed funds ~5.25–5.5% in 2024) pressures display CPMs, forcing tighter yield management; subscription strength (11.1M paid, TTM revenue $2.2B to Q1 2025) stabilizes cash flow while price tests affect ARPU and churn; rising wage, print and cloud costs compress margins; FX and international pricing materially affect reported digital revenue.
| Metric | Value | Notes |
|---|---|---|
| Paid subscribers | 11.1M | TTM to Q1 2025 |
| Revenue | $2.2B | TTM to Q1 2025 |
| Fed funds | 5.25–5.5% | 2024 peak |
Preview Before You Purchase
The New York Times PESTLE Analysis
The New York Times PESTLE Analysis examines political, economic, social, technological, legal, and environmental factors shaping the company and media sector. It highlights regulatory risks, advertising shifts, digital transformation, and sustainability challenges. The preview shown here is the exact document you’ll receive after purchase—fully formatted and ready to use. Apply it to inform strategy, risk assessment, and competitive positioning.

Original: $10.00
-65%$10.00
$3.50Product Information
Product Information
Shipping & Returns
Shipping & Returns
Description
Your Shortcut to Market Insight Starts Here
Gain a competitive edge with our PESTLE analysis of The New York Times. It maps political, economic, social, technological, legal and environmental forces shaping strategy and revenue streams. Buy the full report for detailed, editable insights and actionable recommendations ready for boardrooms and investment pitches.
Political factors
Press freedom and regulation
Shifts in press freedom and media regulation directly affect NYT newsgathering, access, and reporter protections, with the company serving over 10 million paid subscribers in 2024 and reliant on robust investigative output. Changes in shield laws or source protection—debated across multiple US states in 2024—can raise legal risk and litigation costs for investigative pieces. International operations face diverse censorship and licensing regimes that can increase compliance costs and slow content distribution in key markets.
Platform and content moderation policy
Government scrutiny of platforms, via rules like the EU Digital Services Act that targets services with over 45 million users, reshapes referral traffic and distribution for The New York Times. Mandated transparency and takedown regimes change what content surfaces and demands adaptive editorial and technical controls. News bargaining codes (eg Australia) have shifted revenue splits with platforms and pushed payments to publishers. Compliance requires ongoing legal teams and agile platform partnerships.
Electoral cycles and polarization
Election seasons boost demand for outlets like The New York Times—Pew Research found 57% of U.S. adults followed the 2020 election very closely—while elevating misinformation risks highlighted in the Reuters Institute 2024 reporting. Polarization can grow subscriptions but also prompt advertiser or reader boycotts. Coverage choices draw regulatory and political scrutiny, and CPJ and local reports show rising safety threats to journalists and correspondents.
Public media funding and competition
Trade, sanctions, and geopolitics
Cross-border data flows and journalist visas are critical for NYT global reporting; with the company reporting roughly $2.1B revenue in 2023 and digital subscribers near 10.9M by 2024, disruptions hurt distribution and licensing income. Sanctions on markets such as Russia and Iran limit ad sales and partnerships, while geopolitical instability raises correspondent security and insurance costs. Currency swings and compliance add measurable risk to international subscriptions and programmatic ads.
- Data/visa dependency: global licensing strain
- Sanctions: blocked monetization in sanctioned markets
- Safety costs: higher insurance for field reporters
- FX/compliance: revenue volatility in international ops
Platform and political shifts threaten major news publisher; 10.9M subs
Political shifts in press freedom, platform regulation and election cycles materially affect The New York Times operations, legal risk and revenue mix, with ~10.9M digital subscribers (2024) and $2.1B revenue (2023). EU rules like the DSA (45M user threshold) and national bargaining codes alter traffic and platform payments; subsidies and broadband funding (CPB ~465M FY2024; BEAD 42.45B) change competition and reach.
| Metric | Value |
|---|---|
| Digital subs (2024) | 10.9M |
| Revenue (2023) | $2.1B |
| EU DSA threshold | 45M users |
| CPB funding (FY2024) | $465M |
| BEAD broadband | $42.45B |
What is included in the product
Detailed Word Document
Explores how macro-environmental factors uniquely affect The New York Times across Political, Economic, Social, Technological, Environmental, and Legal dimensions, with data-driven, forward-looking insights and concrete sub-points to support executives, consultants, and investors in strategy, risk mitigation, and funding decisions.
Customizable Excel Spreadsheet
A concise, visually segmented PESTLE summary of The New York Times that relieves meeting prep pain—easy to drop into slides, edit with region- or business-specific notes, and share across teams for fast alignment on external risks and strategic positioning.
Economic factors
Advertising cyclicality
Ad markets track GDP and interest rates—with Fed funds near 5.25–5.5% in 2024—so brand-budget pullbacks hit display and branded content first while direct-response often stays resilient; shifts toward performance channels compress CPMs and raise programmatic supply pressure, forcing the New York Times to employ tight yield management, granular inventory control and dynamic forecasting to protect revenue per impression.
Subscription growth and ARPU
Subscriber additions and price optimization underpin NYT revenue stability, with the company reporting about 11.1 million paid subscribers and total revenue of $2.2 billion in the trailing twelve months to Q1 2025, reflecting steady ARPU gains from selective price increases. Intro offers lift trials but can dilute ARPU and raised churn in 2024 test cohorts. Bundles for news, games, cooking and audio increased customer lifetime value in recent quarters. Data-led segmentation drives higher upsell and retention rates.
Cost inflation and productivity
Wage, printing, and distribution costs continue to pressure margins amid a large newsroom headcount and physical production needs; The New York Times reported about 10.9 million total paid subscribers (end-2023), keeping print scale but not offsetting rising costs. Technology investments can boost newsroom efficiency and unit economics through automation and CMS upgrades. Vendor and cloud costs are material—global public cloud spending hit roughly $599.4 billion in 2023—so disciplined procurement is essential. Optimizing real estate footprint can free cash flow by reducing leases and facility overhead.
Competitive landscape
The New York Times faces competition from national outlets, niche verticals, platforms, and independent creators.
Substitution from free news and newsletters—Substack surpassed 1,000,000 paying subscribers in 2023—intensifies price sensitivity.
Differentiation relies on brand authority, investigative journalism, and product-bundle depth; NYT reported 9.6 million paid subscribers as of Q2 2024, making marketing efficiency a critical lever to lower CAC and boost retention.
- competition: national, niche, platforms, creators
- substitution: Substack 1,000,000+ paid (2023)
- diff: brand, investigations, bundles
- metric: NYT 9.6M paid subscribers (Q2 2024)
- focus: marketing efficiency, CAC & retention
FX and international exposure
Foreign subscribers introduce currency-driven revenue swings; The New York Times reported about 10.9 million total subscribers in mid-2024, making international FX moves materially affect reported digital revenue.
Pricing and localization drive penetration and churn abroad while payment processing fees—which vary by country and method—erode margins; corporate hedging policies can partially smooth reported quarterly results.
- FX exposure: material with ~10.9M subs (mid-2024)
- Pricing/localization: impacts churn and growth
- Payment fees: vary by market/method
- Hedging: used to stabilize reported revenue
Platform and political shifts threaten major news publisher; 10.9M subs
Ad demand tied to GDP and higher rates (Fed funds ~5.25–5.5% in 2024) pressures display CPMs, forcing tighter yield management; subscription strength (11.1M paid, TTM revenue $2.2B to Q1 2025) stabilizes cash flow while price tests affect ARPU and churn; rising wage, print and cloud costs compress margins; FX and international pricing materially affect reported digital revenue.
| Metric | Value | Notes |
|---|---|---|
| Paid subscribers | 11.1M | TTM to Q1 2025 |
| Revenue | $2.2B | TTM to Q1 2025 |
| Fed funds | 5.25–5.5% | 2024 peak |
Preview Before You Purchase
The New York Times PESTLE Analysis
The New York Times PESTLE Analysis examines political, economic, social, technological, legal, and environmental factors shaping the company and media sector. It highlights regulatory risks, advertising shifts, digital transformation, and sustainability challenges. The preview shown here is the exact document you’ll receive after purchase—fully formatted and ready to use. Apply it to inform strategy, risk assessment, and competitive positioning.











