Northwest Pipe PESTLE Analysis

Skip the Research. Get the Strategy.
Unlock how political, economic, social, technological, legal, and environmental forces are shaping Northwest Pipe’s strategic outlook with our concise PESTLE snapshot—crafted for investors and strategists alike. This analysis highlights regulatory risks, infrastructure demand drivers, and sustainability pressures that could alter future margins. Purchase the full PESTLE for the complete, actionable intelligence you need to make informed decisions.
Political factors

Infrastructure funding priorities
Federal and state budgets, notably the 2021 Bipartisan Infrastructure Law's $1.2 trillion package which includes roughly $55 billion for drinking water and wastewater, directly drive large-diameter steel pipe project pipelines. Shifts in appropriations or earmarks can accelerate or delay municipal conveyance projects and short-cycle procurement. Public–private partnership policies also shape deal flow and risk allocation. Northwest Pipe’s backlog closely tracks these funding cycles.
Buy America/Build America provisions
Buy America/Build America provisions tied to the IIJA (roughly $550 billion new infrastructure spending) favor U.S.-made steel pipe, giving Northwest Pipe pricing power on federally funded projects while increasing procurement complexity and audit exposure. Changes in waiver policy or enforcement can quickly shift competitive dynamics with imported pipe suppliers. The company benefits most from clear, stable domestic-preference rules.

Trade policy and steel tariffs
US Section 232 steel tariffs of 25% and ongoing anti-dumping/AD/CVD measures raise Northwest Pipe input costs and alter competitor pricing, while quotas on select origins tighten supply. Policy shifts with new administrations have produced double-digit landed-cost swings (often over 10%), forcing Northwest Pipe to hedge, use fixed-price contracts, or pass costs into bids. Stable trade frameworks reduce bid risk on multi-year infrastructure contracts.

Environmental permitting and water policy
Permitting timelines for water transmission projects are driven by federal and state agencies and often add 6–36 months to project start dates when NEPA reviews or wetlands rule changes occur.
Policy focus on drought resilience and managed aquifer recharge since 2020 has increased demand for long‑haul conveyance, supporting higher pipe order volumes and longer project pipelines.
- Permitting: federal/state coordination
- Delays: NEPA/wetlands 6–36 months
- Demand: drought/recharge → more long‑haul projects
Local governance and procurement practices
City and special district procurement rules set specs, bid methods and contractor selection; over 30 states permit best-value procurement, shifting rewards to quality and lifecycle cost which benefits Northwest Pipe’s durable products; political turnover alters project prioritization and can delay capital programs; Northwest Pipe must sustain stakeholder ties across jurisdictions to protect backlog and margin.
- Procurement rules dictate specs and award
- Best-value (30+ states) favors lifecycle cost
- Political turnover risks continuity
- Need strong multi-jurisdiction relationships
IIJA funds and 25% tariffs reshape water pipe demand; permitting delays raise project risk
Federal IIJA $1.2T (≈$55B for water) and 25% Section 232 tariffs drive demand and pricing; waiver/enforcement shifts alter competition. Permitting (NEPA/wetlands) adds 6–36 months, delaying starts. 30+ states' best-value procurement favors durable, lifecycle-cost pipe; PPP policy and political turnover change project timing and risk allocation.
| Item | 2024/25 |
|---|---|
| IIJA total | $1.2T |
| Water alloc. | $55B |
| Tariff | 25% |
| Permitting delay | 6–36 months |
| Best-value states | 30+ |
What is included in the product
 Detailed Word Document
Explores how Political, Economic, Social, Technological, Environmental and Legal forces uniquely affect Northwest Pipe, using data and current trends to identify sector-specific risks and opportunities. Designed for executives and investors, it offers forward-looking insights to support strategy, scenario planning and funding decisions.

 Customizable Excel Spreadsheet
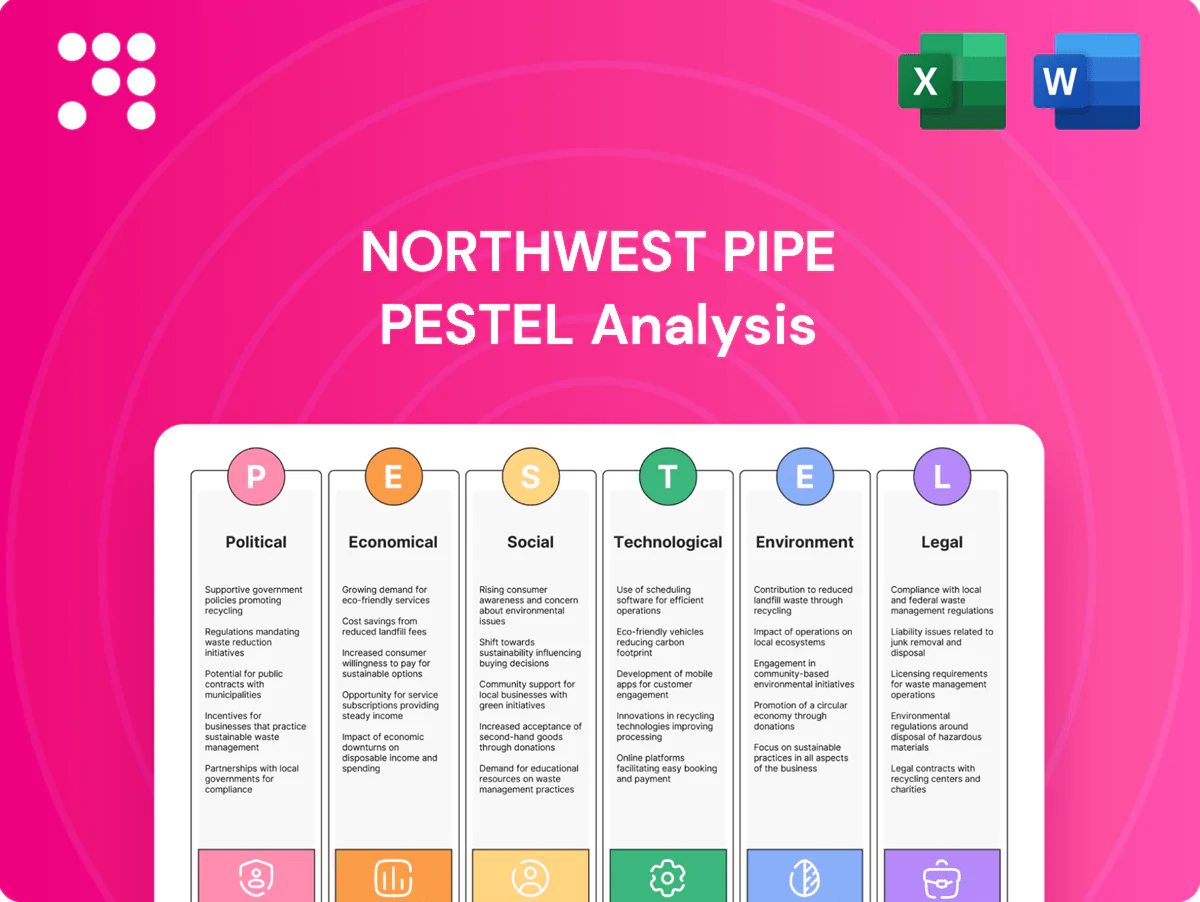
A compact PESTLE summary of Northwest Pipe, visually segmented and editable for region- or business-specific notes, easily dropped into presentations or shared across teams to streamline external risk discussions and strategic planning.
Economic factors

Steel price volatility
Spot hot-rolled coil ranged roughly 650–1,050 USD/short ton in 2024–H1 2025, and such swings can move Northwest Pipe’s fixed-price contract margins by several hundred basis points; effective pass-through clauses and a buy-ahead inventory strategy are therefore critical. Volatility complicates municipal bidding windows of 6–18 months, while hedging programs and long-term supplier partnerships help mitigate the risk.
Interest rates and municipal financing
Higher interest rates raise bond issuance costs and can defer water projects; as of June 2025 the Bloomberg Municipal Bond Index yield-to-worst was about 3.6%, increasing financing headwinds for smaller utilities. Rate cuts or a stable outlook would unlock portions of the EPA-estimated $744 billion water infrastructure backlog through 2036. Municipal credit health shapes bidding intensity, and Northwest Pipe’s demand closely tracks capital market conditions and municipal financing activity.

Cyclical construction and infrastructure spend
Macro slowdowns can compress near-term orders for Northwest Pipe (NWPX) despite persistent water infrastructure demand driven by the Bipartisan Infrastructure Law, a $1.2 trillion package that includes about $55 billion for water programs. Counter-cyclical stimulus and public-works funding often offset downturns by accelerating projects. Backlog quality and visibility are critical to smoothing cycles, and diversification into structural applications provides added resilience.

Logistics and freight costs
Large-diameter pipe is heavy and distance-sensitive, making freight a major cost driver—transport can add 10–20% to landed cost for 36–120 inch pipe. U.S. on-highway diesel averaged about $3.70/gal in 2024, trucking capacity faced an ~80,000 driver shortfall and Class I rail carloads declined ~3% in 2024, increasing delivered-cost volatility. Proximity to projects can cut freight expense up to 30%, and network planning (yards + multimodal routing) materially lowers total landed cost.
- Freight share: 10–20% of landed cost
- Diesel (2024): ~$3.70/gal
- Trucking: ~80,000 driver shortfall (2024)
- Rail: Class I carloads −3% (2024)
- Proximity benefit: up to −30% freight
Labor availability and wage inflation
Skilled welders, fitters and coating technicians remain scarce in key U.S. regions, constraining Northwest Pipe throughput and raising unit labor costs; the BLS reports a 2023 median annual wage for welders of $47,330. Apprenticeships and in-house training improve retention and productivity, while targeted automation cushions tight labor markets.
IIJA funds and 25% tariffs reshape water pipe demand; permitting delays raise project risk
Steel-price swings (hot-rolled coil 650–1,050 USD/short ton in 2024–H1 2025) and freight (10–20% of landed cost; diesel ~$3.70/gal in 2024) drive margin volatility; hedging, buy-ahead inventory and yard proximity cut risk. Higher yields (Bloomberg Muni Bond YTW ~3.6% June 2025) constrain municipal financing against an EPA $744B water backlog to 2036 and Bipartisan Infrastructure Law water funding ~55B. Labor shortages (welders median wage $47,330 2023) raise unit costs; automation/training mitigate capacity limits.
| Metric | Value |
|---|---|
| HRC | 650–1,050 USD/st |
| Muni YTW | ~3.6% (Jun 2025) |
| Water backlog | $744B to 2036 |
| Diesel 2024 | ~$3.70/gal |
Preview the Actual Deliverable
Northwest Pipe PESTLE Analysis
The preview shown here is the exact Northwest Pipe PESTLE Analysis document you’ll receive after purchase—fully formatted and ready to use. It includes the complete Political, Economic, Social, Technological, Legal, and Environmental analysis as displayed. No placeholders or teasers—this is the final, downloadable file.

Original: $10.00
-65%$10.00
$3.50Product Information
Product Information
Shipping & Returns
Shipping & Returns
Description
Skip the Research. Get the Strategy.
Unlock how political, economic, social, technological, legal, and environmental forces are shaping Northwest Pipe’s strategic outlook with our concise PESTLE snapshot—crafted for investors and strategists alike. This analysis highlights regulatory risks, infrastructure demand drivers, and sustainability pressures that could alter future margins. Purchase the full PESTLE for the complete, actionable intelligence you need to make informed decisions.
Political factors
Infrastructure funding priorities
Federal and state budgets, notably the 2021 Bipartisan Infrastructure Law's $1.2 trillion package which includes roughly $55 billion for drinking water and wastewater, directly drive large-diameter steel pipe project pipelines. Shifts in appropriations or earmarks can accelerate or delay municipal conveyance projects and short-cycle procurement. Public–private partnership policies also shape deal flow and risk allocation. Northwest Pipe’s backlog closely tracks these funding cycles.
Buy America/Build America provisions
Buy America/Build America provisions tied to the IIJA (roughly $550 billion new infrastructure spending) favor U.S.-made steel pipe, giving Northwest Pipe pricing power on federally funded projects while increasing procurement complexity and audit exposure. Changes in waiver policy or enforcement can quickly shift competitive dynamics with imported pipe suppliers. The company benefits most from clear, stable domestic-preference rules.
Trade policy and steel tariffs
US Section 232 steel tariffs of 25% and ongoing anti-dumping/AD/CVD measures raise Northwest Pipe input costs and alter competitor pricing, while quotas on select origins tighten supply. Policy shifts with new administrations have produced double-digit landed-cost swings (often over 10%), forcing Northwest Pipe to hedge, use fixed-price contracts, or pass costs into bids. Stable trade frameworks reduce bid risk on multi-year infrastructure contracts.
Environmental permitting and water policy
Permitting timelines for water transmission projects are driven by federal and state agencies and often add 6–36 months to project start dates when NEPA reviews or wetlands rule changes occur.
Policy focus on drought resilience and managed aquifer recharge since 2020 has increased demand for long‑haul conveyance, supporting higher pipe order volumes and longer project pipelines.
- Permitting: federal/state coordination
- Delays: NEPA/wetlands 6–36 months
- Demand: drought/recharge → more long‑haul projects
Local governance and procurement practices
City and special district procurement rules set specs, bid methods and contractor selection; over 30 states permit best-value procurement, shifting rewards to quality and lifecycle cost which benefits Northwest Pipe’s durable products; political turnover alters project prioritization and can delay capital programs; Northwest Pipe must sustain stakeholder ties across jurisdictions to protect backlog and margin.
- Procurement rules dictate specs and award
- Best-value (30+ states) favors lifecycle cost
- Political turnover risks continuity
- Need strong multi-jurisdiction relationships
IIJA funds and 25% tariffs reshape water pipe demand; permitting delays raise project risk
Federal IIJA $1.2T (≈$55B for water) and 25% Section 232 tariffs drive demand and pricing; waiver/enforcement shifts alter competition. Permitting (NEPA/wetlands) adds 6–36 months, delaying starts. 30+ states' best-value procurement favors durable, lifecycle-cost pipe; PPP policy and political turnover change project timing and risk allocation.
| Item | 2024/25 |
|---|---|
| IIJA total | $1.2T |
| Water alloc. | $55B |
| Tariff | 25% |
| Permitting delay | 6–36 months |
| Best-value states | 30+ |
What is included in the product
Detailed Word Document
Explores how Political, Economic, Social, Technological, Environmental and Legal forces uniquely affect Northwest Pipe, using data and current trends to identify sector-specific risks and opportunities. Designed for executives and investors, it offers forward-looking insights to support strategy, scenario planning and funding decisions.
Customizable Excel Spreadsheet
A compact PESTLE summary of Northwest Pipe, visually segmented and editable for region- or business-specific notes, easily dropped into presentations or shared across teams to streamline external risk discussions and strategic planning.
Economic factors
Steel price volatility
Spot hot-rolled coil ranged roughly 650–1,050 USD/short ton in 2024–H1 2025, and such swings can move Northwest Pipe’s fixed-price contract margins by several hundred basis points; effective pass-through clauses and a buy-ahead inventory strategy are therefore critical. Volatility complicates municipal bidding windows of 6–18 months, while hedging programs and long-term supplier partnerships help mitigate the risk.
Interest rates and municipal financing
Higher interest rates raise bond issuance costs and can defer water projects; as of June 2025 the Bloomberg Municipal Bond Index yield-to-worst was about 3.6%, increasing financing headwinds for smaller utilities. Rate cuts or a stable outlook would unlock portions of the EPA-estimated $744 billion water infrastructure backlog through 2036. Municipal credit health shapes bidding intensity, and Northwest Pipe’s demand closely tracks capital market conditions and municipal financing activity.
Cyclical construction and infrastructure spend
Macro slowdowns can compress near-term orders for Northwest Pipe (NWPX) despite persistent water infrastructure demand driven by the Bipartisan Infrastructure Law, a $1.2 trillion package that includes about $55 billion for water programs. Counter-cyclical stimulus and public-works funding often offset downturns by accelerating projects. Backlog quality and visibility are critical to smoothing cycles, and diversification into structural applications provides added resilience.
Logistics and freight costs
Large-diameter pipe is heavy and distance-sensitive, making freight a major cost driver—transport can add 10–20% to landed cost for 36–120 inch pipe. U.S. on-highway diesel averaged about $3.70/gal in 2024, trucking capacity faced an ~80,000 driver shortfall and Class I rail carloads declined ~3% in 2024, increasing delivered-cost volatility. Proximity to projects can cut freight expense up to 30%, and network planning (yards + multimodal routing) materially lowers total landed cost.
- Freight share: 10–20% of landed cost
- Diesel (2024): ~$3.70/gal
- Trucking: ~80,000 driver shortfall (2024)
- Rail: Class I carloads −3% (2024)
- Proximity benefit: up to −30% freight
Labor availability and wage inflation
Skilled welders, fitters and coating technicians remain scarce in key U.S. regions, constraining Northwest Pipe throughput and raising unit labor costs; the BLS reports a 2023 median annual wage for welders of $47,330. Apprenticeships and in-house training improve retention and productivity, while targeted automation cushions tight labor markets.
IIJA funds and 25% tariffs reshape water pipe demand; permitting delays raise project risk
Steel-price swings (hot-rolled coil 650–1,050 USD/short ton in 2024–H1 2025) and freight (10–20% of landed cost; diesel ~$3.70/gal in 2024) drive margin volatility; hedging, buy-ahead inventory and yard proximity cut risk. Higher yields (Bloomberg Muni Bond YTW ~3.6% June 2025) constrain municipal financing against an EPA $744B water backlog to 2036 and Bipartisan Infrastructure Law water funding ~55B. Labor shortages (welders median wage $47,330 2023) raise unit costs; automation/training mitigate capacity limits.
| Metric | Value |
|---|---|
| HRC | 650–1,050 USD/st |
| Muni YTW | ~3.6% (Jun 2025) |
| Water backlog | $744B to 2036 |
| Diesel 2024 | ~$3.70/gal |
Preview the Actual Deliverable
Northwest Pipe PESTLE Analysis
The preview shown here is the exact Northwest Pipe PESTLE Analysis document you’ll receive after purchase—fully formatted and ready to use. It includes the complete Political, Economic, Social, Technological, Legal, and Environmental analysis as displayed. No placeholders or teasers—this is the final, downloadable file.











