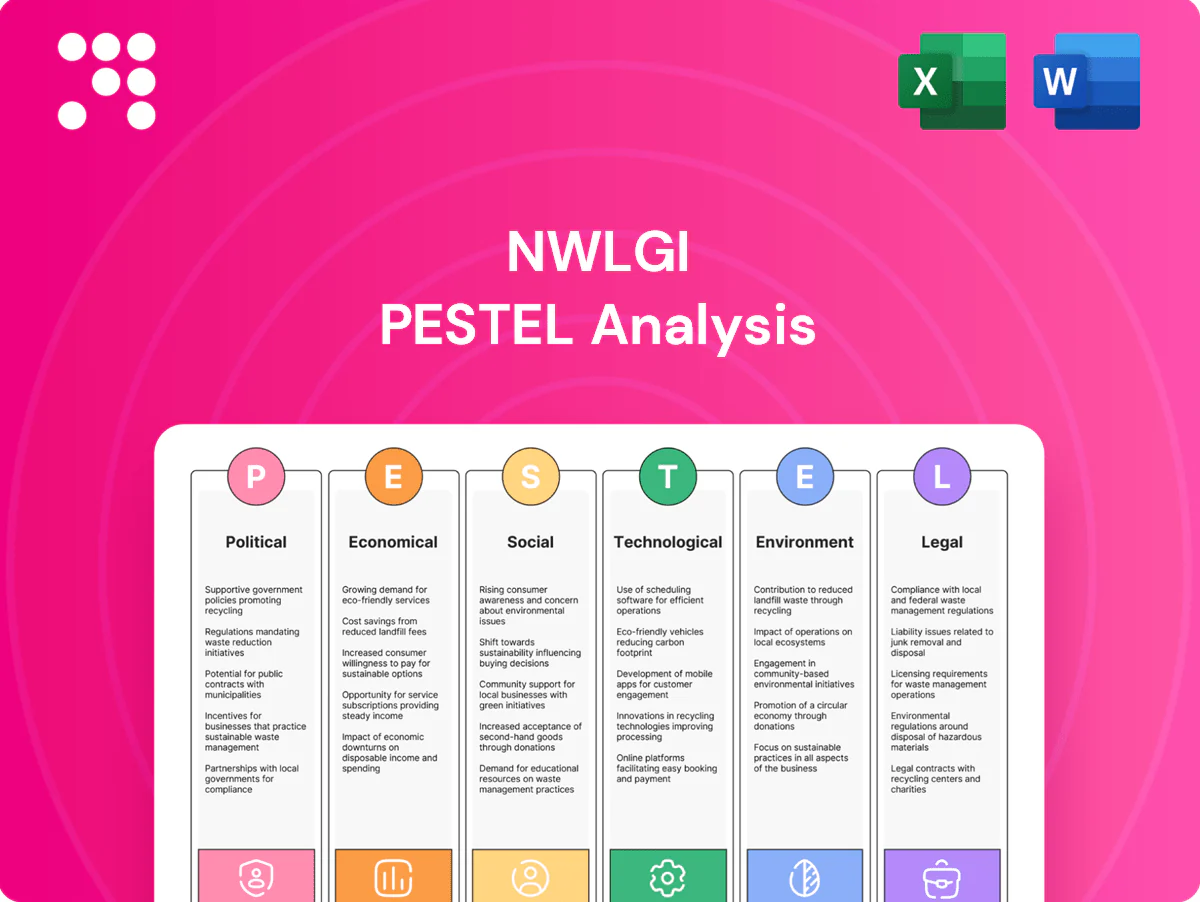
NWLGI PESTLE Analysis

Plan Smarter. Present Sharper. Compete Stronger.
Unlock how political, economic, social, technological, legal, and environmental forces are reshaping NWLGI’s strategic horizon in this concise PESTLE briefing. Our analysis highlights risks and opportunities that matter to investors and strategists. Ready-made and actionable—buy the full PESTLE to access the complete, editable intelligence instantly.
Political factors

State-based insurance regulation dynamics
Life insurers operate under 50 state regulators plus DC (51 jurisdictions), each with varying rules, examination frequencies, and approval timelines.
NWLGI must align product filings, reserves, and capital models with each jurisdiction, where approval windows commonly range from 30 to 180 days, slowing launches and raising compliance costs.
Proactive state-level engagement and continuous monitoring reduce average delay and regulatory friction.
Federal tax and retirement policy shifts
Changes to federal tax and retirement policy—such as revisions to life insurance tax treatment or retirement incentives—directly affect demand for permanent life and annuity products and can shift an industry servicing over $35 trillion in US retirement assets. Adjustments to IRC sections like 7702 or 817 would force product redesigns and repricing to preserve reserve and tax efficiency. Policy moves on Roth/IRA limits or Social Security reform (trust fund stresses within the next decade per trustees) shift client planning needs, so proactive product strategy is essential.

Geopolitical risk impacting investment portfolio
Sanctions, trade tensions and global instability drive credit spreads and equities—MSCI World fell ~18–20% in 2022 and stressed corporate spreads widened by >150 bps in some sectors—pressuring asset values. As a life insurer NWLGI’s surplus and earnings hinge on portfolio stability, so political shocks can impair sector-specific or foreign holdings. Active risk management and diversified allocations are therefore essential to limit tail losses.

Healthcare and long-term care policy interplay
Government healthcare funding and long-term care (LTC) initiatives materially influence demand for protection and income products; OECD members spend roughly 1.6% of GDP on public LTC, and in the US Medicaid finances about 60% of LTC costs, shifting private demand toward either supplemental cover or core annuity solutions. If public benefits expand, consumers may favor supplemental riders; if benefits tighten, annuity and guaranteed-income sales typically rise. Ongoing tracking of policy proposals and budget projections through 2024–25 is essential for timely product positioning.
- Policy impact: public LTC = ~1.6% GDP (OECD)
- US financing: Medicaid ≈60% of LTC spending
- Demand shift: expansion → supplemental; cuts → annuities/riders
- Action: monitor 2024–25 proposals for product timing
Government stance on market conduct and distribution
Political pressure for stronger consumer protections — exemplified by the UK FCA Consumer Duty rollout (effective 2023) and continued US Reg BI enforcement — is pushing higher suitability and disclosure standards across distribution channels.
Independent agents and broker channels face intensified scrutiny of sales practices, driving higher training and compliance spending while regulators seek transparent processes that bolster long-term trust.
- Regulatory drivers: FCA Consumer Duty (2023) and ongoing Reg BI enforcement
- Impact: higher suitability/disclosure requirements
- Channels: increased oversight on independent agents/brokers
- Outcomes: rising training/compliance costs; improved consumer trust
Regulatory, tax and LTC headwinds threaten insurers: 51 states, $35T assets
Life insurers face 51 state regulators; filings typically take 30–180 days, increasing launch costs and delay.
Federal tax/retirement rule changes (IRC 7702/817) affecting ~$35T US retirement assets can force product redesigns and repricing.
Medicaid funds ≈60% US LTC; OECD public LTC ≈1.6% GDP; FCA Consumer Duty (2023) and Reg BI raise compliance spend.
| Factor | Metric | Value |
|---|---|---|
| Jurisdictions | State regulators | 51 |
| Retirement assets | US market | $35T |
| Medicaid LTC | Share | ≈60% |
What is included in the product
 Detailed Word Document
Explores how Political, Economic, Social, Technological, Environmental and Legal forces uniquely impact NWLGI, combining data-driven trends and region-specific examples to identify risks and opportunities. Designed for executives and investors, it offers forward-looking insights to support strategy, scenario planning and funding decisions.

 Customizable Excel Spreadsheet
A concise, visually segmented NWLGI PESTLE summary that’s easily dropped into presentations, editable for local context, and shareable across teams to streamline external risk discussions and align strategy.
Economic factors

Interest rates and yield curve sensitivity
Life and annuity profitability hinges on investment yields versus crediting rates and guarantees.
A steeper curve (2s-10s ~+60 bps, 10y ~4.3% in mid-2025) aids spread income and reserve economics; inversion compresses margins.
Rapid rate moves create reinvestment and disintermediation risks; robust asset-liability management is pivotal.
Inflation and consumer affordability
High inflation (US CPI ~3.4% in 2024) is squeezing household budgets, likely delaying policy purchases or prompting reduced coverage. Rising input and medical inflation (estimated 5–7% in 2024) pushes up expense ratios and claims-related costs, compressing margins. Products with inflation-aware benefits (indexation, real-value payouts) gain relevance, and clear value messaging supports persistency and lapse mitigation.

Equity and credit market volatility
Equity and credit market volatility materially shifts NWLGI portfolio valuations, with VIX averaging near 18 in mid-2025 and the fed funds rate at 5.25–5.50% pressuring discount rates. Widening corporate spreads (around 110 bps for US IG in 2024–25) depressed bond prices while lifting forward yields for reinvestment. Equity downturns curb variable annuity demand and increase interest in principal-protected options. Dynamic hedging and elevated capital buffers remain critical to protect RBC ratios and maintain annuity capacity.

Employment and income trends
Currency and global exposure
FX moves alter NWLGI earnings translation and foreign-asset valuations, with global FX turnover at about 7.5 trillion USD per day (BIS, 2022) amplifying market depth and volatility risks; divergent central bank stances raise rate and currency-basis risk while localized recessions create pockets of credit and funding stress.
- FX translation risk
- Rate/currency basis from policy divergence
- Localized recession pockets
- Hedging frameworks to stabilize outcomes
Regulatory, tax and LTC headwinds threaten insurers: 51 states, $35T assets
Economic backdrop: higher rates (fed funds 5.25–5.50% mid-2025; 10y ~4.3%) widen spread income but raise discount rates and hedging costs. Inflation remains elevated (US CPI ~3.4% in 2024) and medical inflation 5–7%, pressuring claims and persistency. Market volatility (VIX ~18) and credit spreads (~110 bps) increase reserve and capital risk; targeted ALM and hedging are essential.
| Metric | Value |
|---|---|
| Fed funds | 5.25–5.50% |
| 10y | ~4.3% |
| US CPI 2024 | 3.4% |
| VIX mid-2025 | ~18 |
| Corp spread | ~110 bps |
Preview Before You Purchase
NWLGI PESTLE Analysis
The preview shown here is the exact NWLGI PESTLE Analysis document you’ll receive after purchase—fully formatted and ready to use. The layout, content, and structure visible here are exactly what you’ll be able to download immediately after buying. No placeholders or teasers—this is the final, professionally structured file.

Product Information
Product Information
Shipping & Returns
Shipping & Returns
Description
Plan Smarter. Present Sharper. Compete Stronger.
Unlock how political, economic, social, technological, legal, and environmental forces are reshaping NWLGI’s strategic horizon in this concise PESTLE briefing. Our analysis highlights risks and opportunities that matter to investors and strategists. Ready-made and actionable—buy the full PESTLE to access the complete, editable intelligence instantly.
Political factors
State-based insurance regulation dynamics
Life insurers operate under 50 state regulators plus DC (51 jurisdictions), each with varying rules, examination frequencies, and approval timelines.
NWLGI must align product filings, reserves, and capital models with each jurisdiction, where approval windows commonly range from 30 to 180 days, slowing launches and raising compliance costs.
Proactive state-level engagement and continuous monitoring reduce average delay and regulatory friction.
Federal tax and retirement policy shifts
Changes to federal tax and retirement policy—such as revisions to life insurance tax treatment or retirement incentives—directly affect demand for permanent life and annuity products and can shift an industry servicing over $35 trillion in US retirement assets. Adjustments to IRC sections like 7702 or 817 would force product redesigns and repricing to preserve reserve and tax efficiency. Policy moves on Roth/IRA limits or Social Security reform (trust fund stresses within the next decade per trustees) shift client planning needs, so proactive product strategy is essential.
Geopolitical risk impacting investment portfolio
Sanctions, trade tensions and global instability drive credit spreads and equities—MSCI World fell ~18–20% in 2022 and stressed corporate spreads widened by >150 bps in some sectors—pressuring asset values. As a life insurer NWLGI’s surplus and earnings hinge on portfolio stability, so political shocks can impair sector-specific or foreign holdings. Active risk management and diversified allocations are therefore essential to limit tail losses.
Healthcare and long-term care policy interplay
Government healthcare funding and long-term care (LTC) initiatives materially influence demand for protection and income products; OECD members spend roughly 1.6% of GDP on public LTC, and in the US Medicaid finances about 60% of LTC costs, shifting private demand toward either supplemental cover or core annuity solutions. If public benefits expand, consumers may favor supplemental riders; if benefits tighten, annuity and guaranteed-income sales typically rise. Ongoing tracking of policy proposals and budget projections through 2024–25 is essential for timely product positioning.
- Policy impact: public LTC = ~1.6% GDP (OECD)
- US financing: Medicaid ≈60% of LTC spending
- Demand shift: expansion → supplemental; cuts → annuities/riders
- Action: monitor 2024–25 proposals for product timing
Government stance on market conduct and distribution
Political pressure for stronger consumer protections — exemplified by the UK FCA Consumer Duty rollout (effective 2023) and continued US Reg BI enforcement — is pushing higher suitability and disclosure standards across distribution channels.
Independent agents and broker channels face intensified scrutiny of sales practices, driving higher training and compliance spending while regulators seek transparent processes that bolster long-term trust.
- Regulatory drivers: FCA Consumer Duty (2023) and ongoing Reg BI enforcement
- Impact: higher suitability/disclosure requirements
- Channels: increased oversight on independent agents/brokers
- Outcomes: rising training/compliance costs; improved consumer trust
Regulatory, tax and LTC headwinds threaten insurers: 51 states, $35T assets
Life insurers face 51 state regulators; filings typically take 30–180 days, increasing launch costs and delay.
Federal tax/retirement rule changes (IRC 7702/817) affecting ~$35T US retirement assets can force product redesigns and repricing.
Medicaid funds ≈60% US LTC; OECD public LTC ≈1.6% GDP; FCA Consumer Duty (2023) and Reg BI raise compliance spend.
| Factor | Metric | Value |
|---|---|---|
| Jurisdictions | State regulators | 51 |
| Retirement assets | US market | $35T |
| Medicaid LTC | Share | ≈60% |
What is included in the product
Detailed Word Document
Explores how Political, Economic, Social, Technological, Environmental and Legal forces uniquely impact NWLGI, combining data-driven trends and region-specific examples to identify risks and opportunities. Designed for executives and investors, it offers forward-looking insights to support strategy, scenario planning and funding decisions.
Customizable Excel Spreadsheet
A concise, visually segmented NWLGI PESTLE summary that’s easily dropped into presentations, editable for local context, and shareable across teams to streamline external risk discussions and align strategy.
Economic factors
Interest rates and yield curve sensitivity
Life and annuity profitability hinges on investment yields versus crediting rates and guarantees.
A steeper curve (2s-10s ~+60 bps, 10y ~4.3% in mid-2025) aids spread income and reserve economics; inversion compresses margins.
Rapid rate moves create reinvestment and disintermediation risks; robust asset-liability management is pivotal.
Inflation and consumer affordability
High inflation (US CPI ~3.4% in 2024) is squeezing household budgets, likely delaying policy purchases or prompting reduced coverage. Rising input and medical inflation (estimated 5–7% in 2024) pushes up expense ratios and claims-related costs, compressing margins. Products with inflation-aware benefits (indexation, real-value payouts) gain relevance, and clear value messaging supports persistency and lapse mitigation.
Equity and credit market volatility
Equity and credit market volatility materially shifts NWLGI portfolio valuations, with VIX averaging near 18 in mid-2025 and the fed funds rate at 5.25–5.50% pressuring discount rates. Widening corporate spreads (around 110 bps for US IG in 2024–25) depressed bond prices while lifting forward yields for reinvestment. Equity downturns curb variable annuity demand and increase interest in principal-protected options. Dynamic hedging and elevated capital buffers remain critical to protect RBC ratios and maintain annuity capacity.
Employment and income trends
Currency and global exposure
FX moves alter NWLGI earnings translation and foreign-asset valuations, with global FX turnover at about 7.5 trillion USD per day (BIS, 2022) amplifying market depth and volatility risks; divergent central bank stances raise rate and currency-basis risk while localized recessions create pockets of credit and funding stress.
- FX translation risk
- Rate/currency basis from policy divergence
- Localized recession pockets
- Hedging frameworks to stabilize outcomes
Regulatory, tax and LTC headwinds threaten insurers: 51 states, $35T assets
Economic backdrop: higher rates (fed funds 5.25–5.50% mid-2025; 10y ~4.3%) widen spread income but raise discount rates and hedging costs. Inflation remains elevated (US CPI ~3.4% in 2024) and medical inflation 5–7%, pressuring claims and persistency. Market volatility (VIX ~18) and credit spreads (~110 bps) increase reserve and capital risk; targeted ALM and hedging are essential.
| Metric | Value |
|---|---|
| Fed funds | 5.25–5.50% |
| 10y | ~4.3% |
| US CPI 2024 | 3.4% |
| VIX mid-2025 | ~18 |
| Corp spread | ~110 bps |
Preview Before You Purchase
NWLGI PESTLE Analysis
The preview shown here is the exact NWLGI PESTLE Analysis document you’ll receive after purchase—fully formatted and ready to use. The layout, content, and structure visible here are exactly what you’ll be able to download immediately after buying. No placeholders or teasers—this is the final, professionally structured file.











