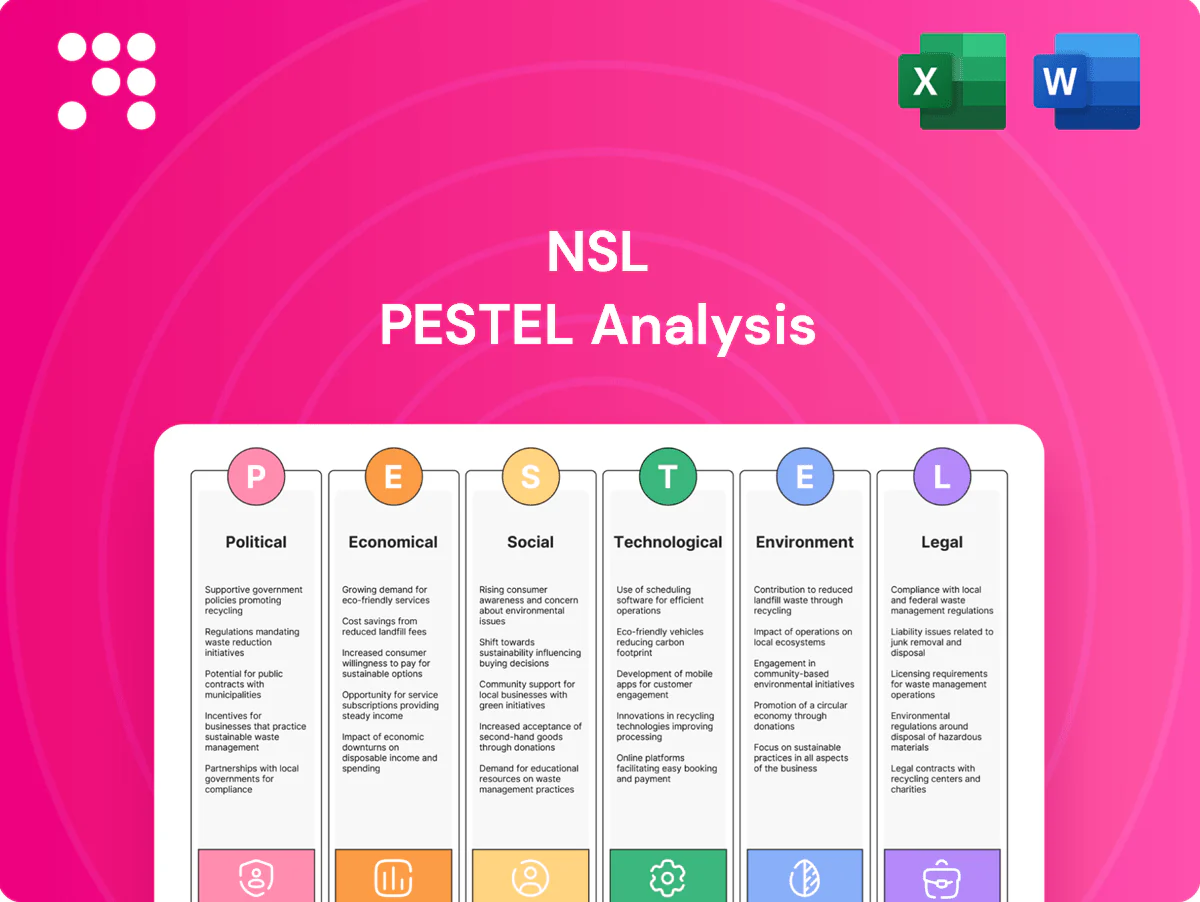
NSL PESTLE Analysis

Your Shortcut to Market Insight Starts Here
Discover how political, economic, social, technological, legal, and environmental forces are shaping NSL’s trajectory in our concise PESTLE brief. Ideal for investors, consultants, and strategists, it highlights risks and growth levers you can act on today. Purchase the full PESTLE to access the complete, editable analysis and make data-driven decisions.
Political factors

Cross-border policy stability
Operating across Asia, Australia and the Middle East exposes NSL to divergent government priorities and stability; ADB estimates Asia-Pacific needs about $1.7 trillion annually in infrastructure (roughly $26 trillion to 2030), so policy shifts reshape project pipelines. Stable regimes support long-term concessions and PPPs, while volatility raises bid and execution risk. Geographic diversification mitigates but cannot eliminate country-specific shocks.
Public infrastructure priorities
Government budgets for housing, water and transport—with the World Bank estimating a developing-country infrastructure financing gap of roughly $1.5–2.0 trillion annually (2024)—directly drive demand for precast and environmental services. Election cycles frequently delay tender awards or re-scope projects, compressing NSL cash flow timing. Strong fiscal stimulus programs historically lift order intake and capacity utilization sharply; NSL should align offerings to national development plans to capture funding flows.

Trade and tariff regimes
Import duties on cement, steel and machinery materially affect NSL’s input costs: global average MFN applied tariff was 6.4% in 2023 (WTO) while US steel Section 232 tariffs remain at 25%. Free‑trade agreements such as CPTPP and EU FTAs can lower or eliminate those levies for members, easing material flows. Sudden tariff changes disrupt cross‑border procurement and delivery schedules. Hedging suppliers and localizing key inputs reduces exposure to tariff shocks.

PPP and procurement practices
Transparency and procurement rules vary widely across jurisdictions, driving bid preparation costs that can run 1–2% of project value and materially affecting win rates.
Robust PPP frameworks unlock multi‑billion‑dollar environmental and construction projects, but approvals commonly take 12–24 months, straining working capital and timelines.
Demonstrable compliance and prior PPP delivery increasingly qualify firms for restricted tenders and preferred bidder lists.
- Bid costs: 1–2% of project value
- Approval timelines: commonly 12–24 months
- PPPs: enable multi‑billion projects
- Compliance track record: key for restricted tenders
Geopolitical tensions
Regional conflicts and maritime disruptions have driven war-risk insurance for some Red Sea transits to six-figure levels per voyage and forced rerouting that can add up to two weeks to schedules; sanctions and export controls from the US/EU since 2022 have restricted counterparties and equipment vendors; political risk also constrains labor mobility and site access, so scenario planning must include alternate routes and suppliers.
- Insurance spike: six-figure war-risk premiums
- Delays: reroutes add up to two weeks
- Sanctions: US/EU export controls since 2022
- Mitigation: alternate logistics routes and suppliers
Political, tariff and war-risk raise costs for Asia-Pacific infrastructure projects
NSL faces country-specific political risk across Asia, Australia and the Middle East where ADB cites ~1.7 trillion USD/yr Asia‑Pacific infrastructure need and World Bank estimates a developing-country gap of 1.5–2.0 trillion USD (2024), shifting project pipelines and PPP demand. Tariff shocks (WTO avg MFN 6.4% in 2023) and sanctions raise input and supplier risks while war-risk premiums have reached six-figure levels per voyage.
| Metric | Value |
|---|---|
| Bid costs | 1–2% of project value |
| Approval timelines | 12–24 months |
| Asia‑Pacific infra need | ~1.7T USD/yr (ADB) |
| Infra financing gap | 1.5–2.0T USD (2024) |
| Avg MFN tariff | 6.4% (2023, WTO) |
| War-risk premiums | Six-figure per voyage |
What is included in the product
 Detailed Word Document
Explores how external macro-environmental factors uniquely affect the NSL across Political, Economic, Social, Technological, Environmental and Legal dimensions, with detailed sub-points and examples specific to the business and region. Backed by current data and forward-looking insights, the analysis is formatted for executive use to identify threats, opportunities and inform strategic planning.

 Customizable Excel Spreadsheet
A concise, visually segmented PESTLE summary for NSL that’s easily dropped into presentations, editable for local context, and shareable across teams to speed strategic planning and risk discussions.
Economic factors

Construction cycle sensitivity
NSL’s revenues move in step with building and infrastructure cycles, so shifts in construction activity directly affect order intake and margins. Rising interest rates reduce developer activity and tighten project financing, slowing new contracts. In downturns clients pursue value engineering, often preferring cost-efficient precast solutions that support NSL’s product mix. Backlogs and framework agreements help smooth revenue volatility by providing multi-year visibility.
Commodity and energy costs
Cement, steel, aggregates and fuel costs drive NSL margins, with raw materials often representing 50-70% of variable costs; volatility has made dynamic pricing and index-linked contracts standard practice. Energy-efficient plants can cut thermal energy use by 20-30% and lower CO2 intensity, reducing unit costs. Strategic inventories covering 2-3 months and long-term supplier partnerships improve supply resilience and price visibility.

Currency fluctuations
Multi-region operations create material FX translation and transaction risk; BIS triennial data show global FX turnover around $7.5 trillion daily (2022), underscoring scale. Imported equipment and materials compress margins when local currencies weaken versus major currencies. Natural hedges via local sourcing and local-currency invoicing materially reduce exposure. Hedging policies should align with project cash-flow timing and tenor.

Labor market dynamics
Skilled labor shortages have driven wage growth of roughly 4–6% in key construction markets in 2023–24, squeezing productivity and raising unit labor costs; automation and modularization can reduce on-site labor needs by up to 30% per project. Migrant labor policies in the Middle East and Asia, which account for 20–40% of contractor staffing, directly affect flexibility, while structured training pipelines cut turnover and incidents by an estimated 15–25%.
- Skilled shortages: wages +4–6% (2023–24)
- Automation/modularization: up to −30% on-site labor
- Migrant labor: 20–40% of staffing (GCC/Asia projects)
- Training pipelines: −15–25% turnover/incidents
Credit and client solvency
Contractor and developer liquidity directly drives payment cycles and bad-debt exposure, increasing receivable durations when clients are strained. Tight credit conditions compress new project starts and push contractors to accept altered payment terms or higher pricing to cover liquidity risk. Milestone-based billing and performance bonds are standard mitigants that preserve cash flow and limit downside before handover. Counterparty credit assessment is essential prior to mobilization to avoid stranded assets.
- Contractor liquidity impacts payment cycles and bad-debt risk
- Tight credit delays starts and alters contract terms
- Milestone billing and performance bonds protect cash flow
- Pre-mobilization counterparty risk assessment is critical
Political, tariff and war-risk raise costs for Asia-Pacific infrastructure projects
NSL revenues track construction cycles; higher rates cut developer activity and new contracts. Materials drive 50–70% of variable costs, with index-linked pricing standard. Wage inflation ~4–6% (2023–24) and FX swings raise margin risk; backlogs/frameworks (12–24 months) smooth revenue.
| Metric | Value |
|---|---|
| Material cost share | 50–70% |
| Wage growth | 4–6% |
| Backlog | 12–24 months |
Full Version Awaits
NSL PESTLE Analysis
The NSL PESTLE Analysis preview shown here is the exact document you’ll receive after purchase—fully formatted and ready to use. This is a real snapshot of the final file with complete sections and professional structure. After payment you’ll instantly download this same, ready-to-use report.

Original: $10.00
-65%$10.00
$3.50Product Information
Product Information
Shipping & Returns
Shipping & Returns
Description
Your Shortcut to Market Insight Starts Here
Discover how political, economic, social, technological, legal, and environmental forces are shaping NSL’s trajectory in our concise PESTLE brief. Ideal for investors, consultants, and strategists, it highlights risks and growth levers you can act on today. Purchase the full PESTLE to access the complete, editable analysis and make data-driven decisions.
Political factors
Cross-border policy stability
Operating across Asia, Australia and the Middle East exposes NSL to divergent government priorities and stability; ADB estimates Asia-Pacific needs about $1.7 trillion annually in infrastructure (roughly $26 trillion to 2030), so policy shifts reshape project pipelines. Stable regimes support long-term concessions and PPPs, while volatility raises bid and execution risk. Geographic diversification mitigates but cannot eliminate country-specific shocks.
Public infrastructure priorities
Government budgets for housing, water and transport—with the World Bank estimating a developing-country infrastructure financing gap of roughly $1.5–2.0 trillion annually (2024)—directly drive demand for precast and environmental services. Election cycles frequently delay tender awards or re-scope projects, compressing NSL cash flow timing. Strong fiscal stimulus programs historically lift order intake and capacity utilization sharply; NSL should align offerings to national development plans to capture funding flows.
Trade and tariff regimes
Import duties on cement, steel and machinery materially affect NSL’s input costs: global average MFN applied tariff was 6.4% in 2023 (WTO) while US steel Section 232 tariffs remain at 25%. Free‑trade agreements such as CPTPP and EU FTAs can lower or eliminate those levies for members, easing material flows. Sudden tariff changes disrupt cross‑border procurement and delivery schedules. Hedging suppliers and localizing key inputs reduces exposure to tariff shocks.
PPP and procurement practices
Transparency and procurement rules vary widely across jurisdictions, driving bid preparation costs that can run 1–2% of project value and materially affecting win rates.
Robust PPP frameworks unlock multi‑billion‑dollar environmental and construction projects, but approvals commonly take 12–24 months, straining working capital and timelines.
Demonstrable compliance and prior PPP delivery increasingly qualify firms for restricted tenders and preferred bidder lists.
- Bid costs: 1–2% of project value
- Approval timelines: commonly 12–24 months
- PPPs: enable multi‑billion projects
- Compliance track record: key for restricted tenders
Geopolitical tensions
Regional conflicts and maritime disruptions have driven war-risk insurance for some Red Sea transits to six-figure levels per voyage and forced rerouting that can add up to two weeks to schedules; sanctions and export controls from the US/EU since 2022 have restricted counterparties and equipment vendors; political risk also constrains labor mobility and site access, so scenario planning must include alternate routes and suppliers.
- Insurance spike: six-figure war-risk premiums
- Delays: reroutes add up to two weeks
- Sanctions: US/EU export controls since 2022
- Mitigation: alternate logistics routes and suppliers
Political, tariff and war-risk raise costs for Asia-Pacific infrastructure projects
NSL faces country-specific political risk across Asia, Australia and the Middle East where ADB cites ~1.7 trillion USD/yr Asia‑Pacific infrastructure need and World Bank estimates a developing-country gap of 1.5–2.0 trillion USD (2024), shifting project pipelines and PPP demand. Tariff shocks (WTO avg MFN 6.4% in 2023) and sanctions raise input and supplier risks while war-risk premiums have reached six-figure levels per voyage.
| Metric | Value |
|---|---|
| Bid costs | 1–2% of project value |
| Approval timelines | 12–24 months |
| Asia‑Pacific infra need | ~1.7T USD/yr (ADB) |
| Infra financing gap | 1.5–2.0T USD (2024) |
| Avg MFN tariff | 6.4% (2023, WTO) |
| War-risk premiums | Six-figure per voyage |
What is included in the product
Detailed Word Document
Explores how external macro-environmental factors uniquely affect the NSL across Political, Economic, Social, Technological, Environmental and Legal dimensions, with detailed sub-points and examples specific to the business and region. Backed by current data and forward-looking insights, the analysis is formatted for executive use to identify threats, opportunities and inform strategic planning.
Customizable Excel Spreadsheet
A concise, visually segmented PESTLE summary for NSL that’s easily dropped into presentations, editable for local context, and shareable across teams to speed strategic planning and risk discussions.
Economic factors
Construction cycle sensitivity
NSL’s revenues move in step with building and infrastructure cycles, so shifts in construction activity directly affect order intake and margins. Rising interest rates reduce developer activity and tighten project financing, slowing new contracts. In downturns clients pursue value engineering, often preferring cost-efficient precast solutions that support NSL’s product mix. Backlogs and framework agreements help smooth revenue volatility by providing multi-year visibility.
Commodity and energy costs
Cement, steel, aggregates and fuel costs drive NSL margins, with raw materials often representing 50-70% of variable costs; volatility has made dynamic pricing and index-linked contracts standard practice. Energy-efficient plants can cut thermal energy use by 20-30% and lower CO2 intensity, reducing unit costs. Strategic inventories covering 2-3 months and long-term supplier partnerships improve supply resilience and price visibility.
Currency fluctuations
Multi-region operations create material FX translation and transaction risk; BIS triennial data show global FX turnover around $7.5 trillion daily (2022), underscoring scale. Imported equipment and materials compress margins when local currencies weaken versus major currencies. Natural hedges via local sourcing and local-currency invoicing materially reduce exposure. Hedging policies should align with project cash-flow timing and tenor.
Labor market dynamics
Skilled labor shortages have driven wage growth of roughly 4–6% in key construction markets in 2023–24, squeezing productivity and raising unit labor costs; automation and modularization can reduce on-site labor needs by up to 30% per project. Migrant labor policies in the Middle East and Asia, which account for 20–40% of contractor staffing, directly affect flexibility, while structured training pipelines cut turnover and incidents by an estimated 15–25%.
- Skilled shortages: wages +4–6% (2023–24)
- Automation/modularization: up to −30% on-site labor
- Migrant labor: 20–40% of staffing (GCC/Asia projects)
- Training pipelines: −15–25% turnover/incidents
Credit and client solvency
Contractor and developer liquidity directly drives payment cycles and bad-debt exposure, increasing receivable durations when clients are strained. Tight credit conditions compress new project starts and push contractors to accept altered payment terms or higher pricing to cover liquidity risk. Milestone-based billing and performance bonds are standard mitigants that preserve cash flow and limit downside before handover. Counterparty credit assessment is essential prior to mobilization to avoid stranded assets.
- Contractor liquidity impacts payment cycles and bad-debt risk
- Tight credit delays starts and alters contract terms
- Milestone billing and performance bonds protect cash flow
- Pre-mobilization counterparty risk assessment is critical
Political, tariff and war-risk raise costs for Asia-Pacific infrastructure projects
NSL revenues track construction cycles; higher rates cut developer activity and new contracts. Materials drive 50–70% of variable costs, with index-linked pricing standard. Wage inflation ~4–6% (2023–24) and FX swings raise margin risk; backlogs/frameworks (12–24 months) smooth revenue.
| Metric | Value |
|---|---|
| Material cost share | 50–70% |
| Wage growth | 4–6% |
| Backlog | 12–24 months |
Full Version Awaits
NSL PESTLE Analysis
The NSL PESTLE Analysis preview shown here is the exact document you’ll receive after purchase—fully formatted and ready to use. This is a real snapshot of the final file with complete sections and professional structure. After payment you’ll instantly download this same, ready-to-use report.











