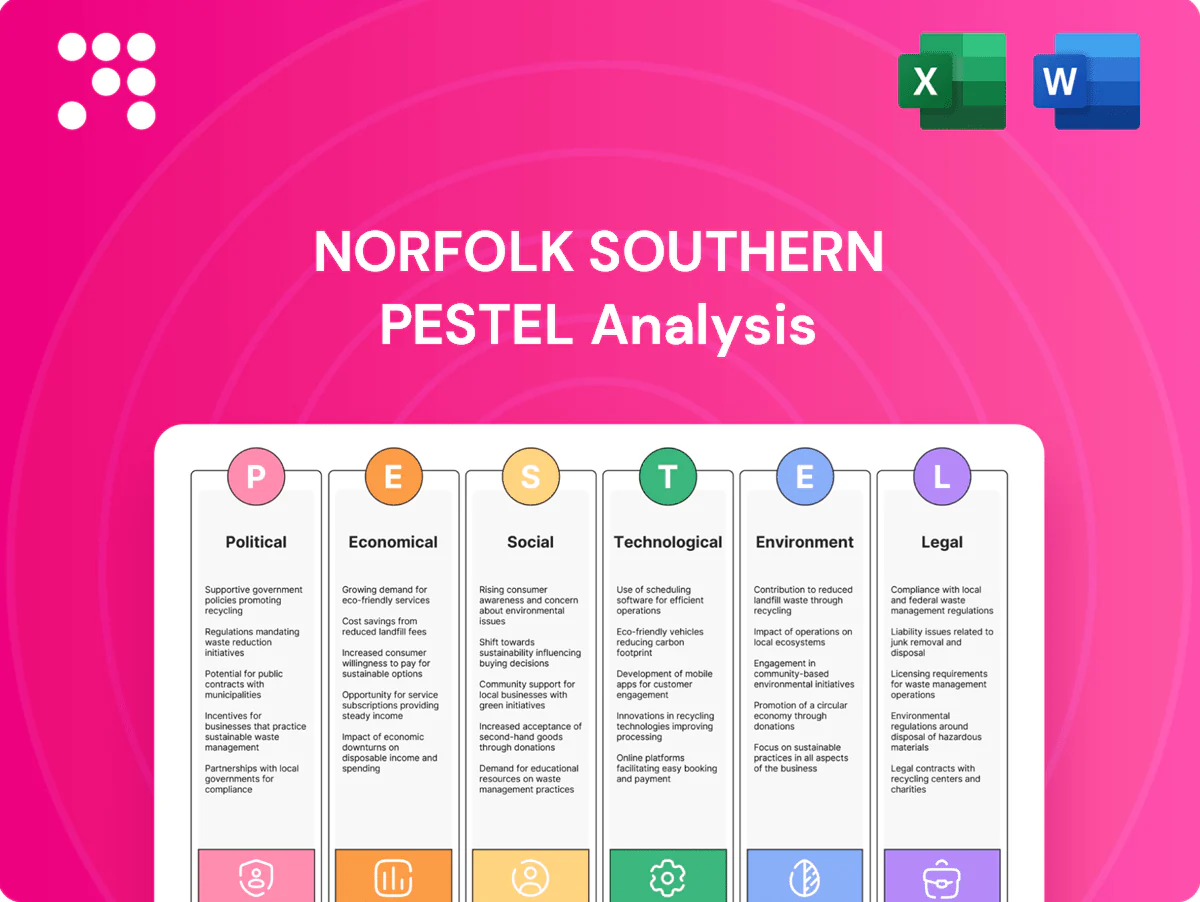
Norfolk Southern PESTLE Analysis

Skip the Research. Get the Strategy.
Our PESTLE analysis of Norfolk Southern reveals how regulatory shifts, infrastructure spending, labor dynamics, environmental pressures, and tech adoption converge to reshape the carrier’s strategy and risk profile. Ideal for investors and strategists, it translates macro trends into actionable implications. Purchase the full report to access the complete, editable breakdown and strategic recommendations.
Political factors

Federal rail policy and oversight
Congress and the Administration shape rail via funding priorities and safety mandates, notably the 2021 Infrastructure Investment and Jobs Act which committed about 66 billion USD for rail programs; Amtrak access and corridor development (Amtrak ridership ~32.5M in 2023) directly affect NSs ~19,500-route-mile network capacity. High-profile derailments (eg East Palestine 2023) have spurred tighter rulemaking, raising compliance scrutiny; NS must engage policymakers proactively.
Surface Transportation Board (STB) scrutiny
STB oversight of service, competition and pricing since 2023 constrains Norfolk Southern’s commercial flexibility by subjecting scheduling and rate actions to regulatory review. Investigations and public hearings on reliability and shipper access have prompted operational shifts and increased reporting to the STB. Potential adoption of stricter service metrics and penalties would raise compliance burdens and cost-to-serve. Aligning strategy with STB expectations preserves market credibility and shipper relationships.

State and local permitting and incentives
State and local permitting and incentives are critical for Norfolk Southern, which operates roughly 19,500 route miles across 22 states; track expansions, terminals and industrial spurs hinge on local approvals. State tax credits and infrastructure grants can materially reduce upfront capex for major projects. Community politics and environmental/zoning reviews frequently add months to project timelines. Building coalitions with regional authorities speeds permitting and execution.

Trade and port policy impacts
Tariffs and customs procedures shape import/export flows and intermodal volumes; US goods imports were about $2.9 trillion in 2023, so policy shifts materially affect NS volumes. Port dredging—Port of Virginia at 55 ft—changes ship calls and routing between East Coast and Gulf ports, altering rail share. Federal IIJA funding ($1.2 trillion) and political backing for inland ports can unlock new corridors; NS’s port partnerships benefit from stable pro-trade policies.
- Tariffs: alter container flows
- Port dredging: 55 ft Port of Virginia
- Customs: impacts dwell and volumes
- Inland ports: IIJA $1.2T enables corridors
- Routing shifts: East/Gulf competitiveness affects NS share
Labor relations and national rail policy
National Mediation Board processes and potential political intervention can shape bargaining timetables and outcomes for Norfolk Southern, where roughly 19,000 employees were reported in 2024 and compensation and benefits comprised about 36% of Class I railroad operating expenses per AAR data. Rail labor agreements directly affect costs, staffing levels, crew availability and operational flexibility; federal or state mandates on crew sizes or expanded sick-leave could materially raise labor expense. Constructive engagement with unions and timely NMB mediation reduces risk of costly service disruptions and regulatory escalation.
IIJA funding and STB safety rules tighten compliance for major freight railroad with ≈19,500 miles
Federal policy and IIJA funding (≈$66B for rail within $1.2T) plus STB rulemaking and post‑East Palestine safety mandates tighten compliance and operational oversight for Norfolk Southern (≈19,500 route miles). State/local permits and port dredging (Port of Virginia 55 ft) affect network growth and intermodal volumes. Labor (≈19,000 employees in 2024; comp ~36% of opex) is politically sensitive via NMB and potential crew/leave mandates.
| Item | Key figure |
|---|---|
| Route miles | ≈19,500 |
| Employees (2024) | ≈19,000 |
| Amtrak ridership (2023) | 32.5M |
| IIJA rail funding | ≈$66B |
| Comp share (AAR) | ≈36% opex |
What is included in the product
 Detailed Word Document
Explores how external macro-environmental factors uniquely affect Norfolk Southern across Political, Economic, Social, Technological, Environmental and Legal dimensions, with data-driven trends, region-specific examples and forward-looking scenarios. Designed for executives and advisors to pinpoint risks, opportunities and support strategic planning and investor communications.

 Customizable Excel Spreadsheet
A concise, visually segmented Norfolk Southern PESTLE summary that distills external risks and opportunities for quick reference, editable for region- or business-line notes, and easily dropped into presentations or team briefings to streamline planning and alignment.
Economic factors

Industrial production and GDP cycles
Core volumes for Norfolk Southern closely mirror steel, chemicals, construction, agriculture and energy activity, so economic slowdowns cut carloads and yield while expansions improve pricing power. Shifts in commodity mix change margins between merchandise and bulk segments, with higher-value intermodal/manifest lifting revenue per car. NS’s cost discipline and network-efficiency initiatives act as a buffer against cycle volatility.
E-commerce and intermodal demand
Consumer spending — with e-commerce at 16.4% of U.S. retail sales in 2023 (U.S. Census Bureau) — drives port and domestic intermodal flows critical to Norfolk Southern’s volumes. Mode competition with trucking tightens when diesel prices climb and truck capacity tightens, shifting load to rail. Service reliability and shorter transit times determine share capture. Strategic terminal capacity underpins peak-season resilience and throughput flexibility.

Fuel prices and operating ratio
Diesel price volatility drives Norfolk Southern’s locomotive fuel expense and shapes fuel surcharge recoveries; U.S. on‑highway diesel averaged about $3.80/gal in 2024 (EIA), pressuring cash flow when surcharges lag. Higher fuel levels tend to improve rail’s cost per ton‑mile versus trucking, supporting modal shift. Ongoing efficiency programs (locomotive renewals, precision scheduled railroading tweaks) cut consumption and emissions, while well‑designed surcharges help stabilize margins during swings.

Interest rates and capital intensity
Rail is capital‑intensive with multi‑year horizons; higher rates (Fed funds ~5.25–5.50% July 2025) lift debt service and raise hurdle rates for track, terminals and $3–4M locomotives, squeezing NPV of projects. Norfolk Southern’s strong cash flow and balance‑sheet liquidity enable buybacks and fleet renewal, so timing capex to rate cycles preserves shareholder returns.
- Capex timing critical
- Higher rates ↑ project hurdle rates
- Locomotive ~$3–4M each
- Cash strength supports buybacks/fleet refresh
Supply chain re-shoring and commodity flows
Nearshoring and U.S. manufacturing investment are reconfiguring freight lanes as domestic capacity grows; semiconductor support from the CHIPS Act (authorized $52 billion) and rising chemicals and auto supply chains boost merchandise volumes. Agricultural exports remain sensitive to global demand and FX movements. Norfolk Southern’s ~19,500 route miles and eastern U.S. footprint position it to capture new inland flows.
- CHIPS Act $52 billion
- NS network ~19,500 route miles
- Autos, semiconductors, chemicals = volume drivers
- Agricultural exports hinge on global demand and currency trends
IIJA funding and STB safety rules tighten compliance for major freight railroad with ≈19,500 miles
NS volumes track steel, chemicals, construction, ag and energy; e‑commerce 16.4% (2023) and CHIPS $52B boost intermodal and merchandise. Diesel ~$3.80/gal (2024) and Fed funds ~5.25–5.50% (Jul 2025) pressure costs and capex hurdle rates; locomotives ~$3–4M each. NS ~19,500 route miles position it to capture nearshoring and domestic manufacturing flows.
| Metric | Value |
|---|---|
| E‑commerce (2023) | 16.4% |
| Diesel (2024 avg) | $3.80/gal |
| Fed funds (Jul 2025) | 5.25–5.50% |
| Locomotive cost | $3–4M |
| NS network | ~19,500 route miles |
| CHIPS Act | $52B |
Preview the Actual Deliverable
Norfolk Southern PESTLE Analysis
The Norfolk Southern PESTLE Analysis preview shown here is the exact document you’ll receive after purchase—fully formatted and professionally structured. No placeholders or teasers: the content and layout visible are the final, ready-to-download file. After payment you’ll instantly get this same, ready-to-use report.

Original: $10.00
-65%$10.00
$3.50Product Information
Product Information
Shipping & Returns
Shipping & Returns
Description
Skip the Research. Get the Strategy.
Our PESTLE analysis of Norfolk Southern reveals how regulatory shifts, infrastructure spending, labor dynamics, environmental pressures, and tech adoption converge to reshape the carrier’s strategy and risk profile. Ideal for investors and strategists, it translates macro trends into actionable implications. Purchase the full report to access the complete, editable breakdown and strategic recommendations.
Political factors
Federal rail policy and oversight
Congress and the Administration shape rail via funding priorities and safety mandates, notably the 2021 Infrastructure Investment and Jobs Act which committed about 66 billion USD for rail programs; Amtrak access and corridor development (Amtrak ridership ~32.5M in 2023) directly affect NSs ~19,500-route-mile network capacity. High-profile derailments (eg East Palestine 2023) have spurred tighter rulemaking, raising compliance scrutiny; NS must engage policymakers proactively.
Surface Transportation Board (STB) scrutiny
STB oversight of service, competition and pricing since 2023 constrains Norfolk Southern’s commercial flexibility by subjecting scheduling and rate actions to regulatory review. Investigations and public hearings on reliability and shipper access have prompted operational shifts and increased reporting to the STB. Potential adoption of stricter service metrics and penalties would raise compliance burdens and cost-to-serve. Aligning strategy with STB expectations preserves market credibility and shipper relationships.
State and local permitting and incentives
State and local permitting and incentives are critical for Norfolk Southern, which operates roughly 19,500 route miles across 22 states; track expansions, terminals and industrial spurs hinge on local approvals. State tax credits and infrastructure grants can materially reduce upfront capex for major projects. Community politics and environmental/zoning reviews frequently add months to project timelines. Building coalitions with regional authorities speeds permitting and execution.
Trade and port policy impacts
Tariffs and customs procedures shape import/export flows and intermodal volumes; US goods imports were about $2.9 trillion in 2023, so policy shifts materially affect NS volumes. Port dredging—Port of Virginia at 55 ft—changes ship calls and routing between East Coast and Gulf ports, altering rail share. Federal IIJA funding ($1.2 trillion) and political backing for inland ports can unlock new corridors; NS’s port partnerships benefit from stable pro-trade policies.
- Tariffs: alter container flows
- Port dredging: 55 ft Port of Virginia
- Customs: impacts dwell and volumes
- Inland ports: IIJA $1.2T enables corridors
- Routing shifts: East/Gulf competitiveness affects NS share
Labor relations and national rail policy
National Mediation Board processes and potential political intervention can shape bargaining timetables and outcomes for Norfolk Southern, where roughly 19,000 employees were reported in 2024 and compensation and benefits comprised about 36% of Class I railroad operating expenses per AAR data. Rail labor agreements directly affect costs, staffing levels, crew availability and operational flexibility; federal or state mandates on crew sizes or expanded sick-leave could materially raise labor expense. Constructive engagement with unions and timely NMB mediation reduces risk of costly service disruptions and regulatory escalation.
IIJA funding and STB safety rules tighten compliance for major freight railroad with ≈19,500 miles
Federal policy and IIJA funding (≈$66B for rail within $1.2T) plus STB rulemaking and post‑East Palestine safety mandates tighten compliance and operational oversight for Norfolk Southern (≈19,500 route miles). State/local permits and port dredging (Port of Virginia 55 ft) affect network growth and intermodal volumes. Labor (≈19,000 employees in 2024; comp ~36% of opex) is politically sensitive via NMB and potential crew/leave mandates.
| Item | Key figure |
|---|---|
| Route miles | ≈19,500 |
| Employees (2024) | ≈19,000 |
| Amtrak ridership (2023) | 32.5M |
| IIJA rail funding | ≈$66B |
| Comp share (AAR) | ≈36% opex |
What is included in the product
Detailed Word Document
Explores how external macro-environmental factors uniquely affect Norfolk Southern across Political, Economic, Social, Technological, Environmental and Legal dimensions, with data-driven trends, region-specific examples and forward-looking scenarios. Designed for executives and advisors to pinpoint risks, opportunities and support strategic planning and investor communications.
Customizable Excel Spreadsheet
A concise, visually segmented Norfolk Southern PESTLE summary that distills external risks and opportunities for quick reference, editable for region- or business-line notes, and easily dropped into presentations or team briefings to streamline planning and alignment.
Economic factors
Industrial production and GDP cycles
Core volumes for Norfolk Southern closely mirror steel, chemicals, construction, agriculture and energy activity, so economic slowdowns cut carloads and yield while expansions improve pricing power. Shifts in commodity mix change margins between merchandise and bulk segments, with higher-value intermodal/manifest lifting revenue per car. NS’s cost discipline and network-efficiency initiatives act as a buffer against cycle volatility.
E-commerce and intermodal demand
Consumer spending — with e-commerce at 16.4% of U.S. retail sales in 2023 (U.S. Census Bureau) — drives port and domestic intermodal flows critical to Norfolk Southern’s volumes. Mode competition with trucking tightens when diesel prices climb and truck capacity tightens, shifting load to rail. Service reliability and shorter transit times determine share capture. Strategic terminal capacity underpins peak-season resilience and throughput flexibility.
Fuel prices and operating ratio
Diesel price volatility drives Norfolk Southern’s locomotive fuel expense and shapes fuel surcharge recoveries; U.S. on‑highway diesel averaged about $3.80/gal in 2024 (EIA), pressuring cash flow when surcharges lag. Higher fuel levels tend to improve rail’s cost per ton‑mile versus trucking, supporting modal shift. Ongoing efficiency programs (locomotive renewals, precision scheduled railroading tweaks) cut consumption and emissions, while well‑designed surcharges help stabilize margins during swings.
Interest rates and capital intensity
Rail is capital‑intensive with multi‑year horizons; higher rates (Fed funds ~5.25–5.50% July 2025) lift debt service and raise hurdle rates for track, terminals and $3–4M locomotives, squeezing NPV of projects. Norfolk Southern’s strong cash flow and balance‑sheet liquidity enable buybacks and fleet renewal, so timing capex to rate cycles preserves shareholder returns.
- Capex timing critical
- Higher rates ↑ project hurdle rates
- Locomotive ~$3–4M each
- Cash strength supports buybacks/fleet refresh
Supply chain re-shoring and commodity flows
Nearshoring and U.S. manufacturing investment are reconfiguring freight lanes as domestic capacity grows; semiconductor support from the CHIPS Act (authorized $52 billion) and rising chemicals and auto supply chains boost merchandise volumes. Agricultural exports remain sensitive to global demand and FX movements. Norfolk Southern’s ~19,500 route miles and eastern U.S. footprint position it to capture new inland flows.
- CHIPS Act $52 billion
- NS network ~19,500 route miles
- Autos, semiconductors, chemicals = volume drivers
- Agricultural exports hinge on global demand and currency trends
IIJA funding and STB safety rules tighten compliance for major freight railroad with ≈19,500 miles
NS volumes track steel, chemicals, construction, ag and energy; e‑commerce 16.4% (2023) and CHIPS $52B boost intermodal and merchandise. Diesel ~$3.80/gal (2024) and Fed funds ~5.25–5.50% (Jul 2025) pressure costs and capex hurdle rates; locomotives ~$3–4M each. NS ~19,500 route miles position it to capture nearshoring and domestic manufacturing flows.
| Metric | Value |
|---|---|
| E‑commerce (2023) | 16.4% |
| Diesel (2024 avg) | $3.80/gal |
| Fed funds (Jul 2025) | 5.25–5.50% |
| Locomotive cost | $3–4M |
| NS network | ~19,500 route miles |
| CHIPS Act | $52B |
Preview the Actual Deliverable
Norfolk Southern PESTLE Analysis
The Norfolk Southern PESTLE Analysis preview shown here is the exact document you’ll receive after purchase—fully formatted and professionally structured. No placeholders or teasers: the content and layout visible are the final, ready-to-download file. After payment you’ll instantly get this same, ready-to-use report.











