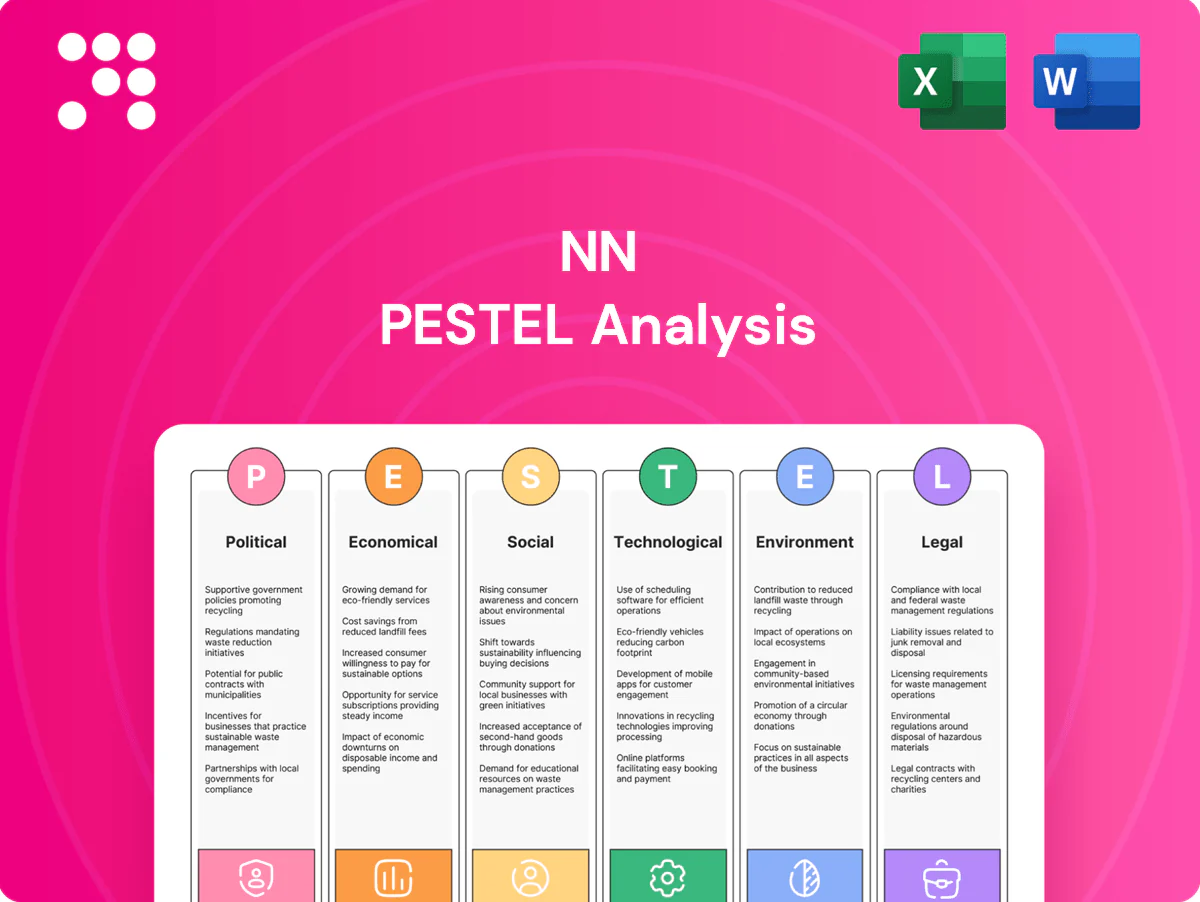
NN PESTLE Analysis

Skip the Research. Get the Strategy.
Discover how political shifts, economic trends, social changes, and technological advances are shaping NN’s strategic outlook in our concise PESTLE snapshot. Ideal for investors, consultants, and executives, this analysis highlights risks and opportunities you can act on immediately. Purchase the full PESTLE for the complete, editable deep dive and actionable recommendations.
Political factors

Defense spending and procurement cycles
NN’s aerospace and defense exposure ties revenue to government budgets and multi-year procurement timetables; U.S. defense spending remains a key driver with the FY2025 proposal near $842 billion and NATO members collectively spending over $1 trillion annually. Shifts in U.S./NATO allocations or supplemental authorizations can accelerate or delay component orders. Election outcomes and geopolitical flashpoints reshape priorities across air, land, sea, and space platforms. Diversifying programs and allies mitigates single-program risk.
Trade policy, tariffs, and reshoring incentives
Tariffs (eg US 25% steel/aluminum Section 232, US Section 301 tariffs up to 25% on about $370B of Chinese goods) raise input costs and squeeze pricing power; the CHIPS Act ($52B) and EU mobilization of tens of billions of euros for industrial reshoring favor domestic capacity and qualified suppliers. Trade frictions and export controls on semiconductors disrupt cross‑border flows; strategic dual‑sourcing hedges volatility.

Export controls and sanctions regimes
ITAR and EAR govern aerospace, defense and select medical technologies via the US Munitions List and Commerce Control List, and compliance is mandatory for cross-border sales. Expanding sanctions and end-use controls — with OFAC SDN lists now exceeding 10,000 entries — force stringent screening and documentation. Non-compliance can trigger shipment holds, seizure and long-term reputational harm. Robust compliance programs and audited export controls enable continued global sales without regulatory breaches.

Industrial policy and subsidies
Government grants, tax credits and concessional loans in 2024–25 commonly cover 10–50% of project capex, with award sizes from $100k to >$50m, supporting automation, precision machining and materials R&D; participation lowers upfront capex and funds workforce upskilling. Subsidy eligibility requires regular reporting, milestone performance and potential clawbacks, and alignment with priority sectors raises award likelihood.
- Grant sizes: $0.1M–$50M+
- Capex coverage: ~10–50%
- R&D tax credits: material offset to operating cost
- Compliance: reporting, milestones, clawbacks
Political stability and regional risk
Operations and suppliers in emerging markets face coups, labor unrest or policy reversals that can hit regions contributing about 60% of global GDP (IMF 2024); logistics corridors can be disrupted by conflicts or port closures, delaying shipments weeks and adding costs in the low- to mid-single-digit percent of revenue. Scenario planning, inventory buffers and country diversification with local partners reduce shock impacts and speed recovery.
- ~60% of global GDP in emerging markets (IMF 2024)
- 30+ high-risk countries for political instability
- Inventory buffers and local partnerships shorten recovery times
Defense demand tied to FY2025 US $842B, NATO >$1T; tariffs and controls raise costs
NN’s defense revenue tied to FY2025 US defense ~$842B and NATO >$1T; budget shifts and elections can delay multi‑year procurements. Tariffs (US 25% steel/al) and Section 301 on ~$370B of China goods, plus export controls/OFAC SDN >10,000, raise input/compliance costs. Grants cover ~10–50% capex; emerging‑market instability (≈60% global GDP) amplifies supply risk.
| Metric | Value |
|---|---|
| US FY2025 | $842B |
| NATO | >$1T |
| Tariffs | 25% |
What is included in the product
 Detailed Word Document
Explores how external macro-environmental factors uniquely affect NN across Political, Economic, Social, Technological, Environmental and Legal dimensions, providing data-backed, region- and industry-specific insights to identify threats, opportunities and forward-looking scenarios for executives, investors and strategists.

 Customizable Excel Spreadsheet
A concise, visually segmented NN PESTLE summary that’s easily dropped into presentations or shared across teams, helping stakeholders quickly align on external risks and market positioning while allowing contextual notes for region or business-line specifics.
Economic factors

Industrial cycle sensitivity
Precision components closely track OEM build rates in aerospace, medical devices and power systems; global commercial aircraft backlog remained ~8,000 units in 2024 supporting near-term demand but cyclicality persists. Downturns can compress volumes and mix, cutting EBITDA margins by 3–8 percentage points; recoveries lift utilization and margins. Flexible cost structures and backlog visibility stabilize profitability across cycles.
Input cost inflation and commodity volatility
Tool steel, titanium, specialty alloys, resins and energy are primary drivers of COGS for NN, with Brent averaging about $85/bbl in 2024 lifting energy-related input costs; index-linked contracts and hedging typically trim volatility but rarely eliminate margin exposure. Supplier consolidation has begun to improve purchasing leverage, while continuous yield improvements of a few percent per year help offset cost swings over time.

Interest rates and capital access
Higher policy rates have raised borrowing costs for capex, automation and working capital, with US fed funds at about 5.25–5.50% and ECB deposit around 4.0% as of mid‑2025. Customers may delay new program launches under tighter conditions, reducing near‑term demand. Strong liquidity and staggered maturities preserve investment capacity. ROI discipline focuses on projects with quick paybacks and clear pricing power.

FX fluctuations and global revenue mix
Multi-currency sales and sourcing create translation and transaction risk; the US dollar surged ~16% in 2022 (DXY), highlighting exposure that can shave margins if currency mismatches are not hedged. Localized sourcing and natural hedges reduce P&L volatility, while pricing clauses and forward contracts (FX markets average $6.6tn/day per BIS 2019) provide active protection.
- Translation risk: cross-border revenues
- Transaction risk: invoicing currency mismatch
- Natural hedge: localized sourcing
- Mitigation: pricing clauses, forwards/futures
Labor markets and productivity
Skilled machinist and engineer shortages push wages and extend lead times, while apprenticeships and partnerships with technical schools are stabilizing pipelines. Automation adoption is rising — IFR reports 517,385 industrial robot installations in 2023 — raising throughput per headcount and quality yield. Retention programs reduce rework and scrap costs by improving operator skill continuity.
- Shortages → higher wages, longer lead times
- Apprenticeships → skilled pipeline growth
- Automation (IFR 2023: 517,385 robots) → higher throughput, better yield
- Retention programs → lower rework/scrap costs
Defense demand tied to FY2025 US $842B, NATO >$1T; tariffs and controls raise costs
Demand tied to OEM build rates remains supported by a ~8,000 commercial aircraft backlog in 2024 but cyclical dips can cut EBITDA 3–8pp. Input costs driven by Brent ~$85/bbl (2024) and specialty alloys; supplier consolidation and yield gains mitigate. Higher rates (US fed funds 5.25–5.50% mid‑2025), FX volatility (DXY spike ~16% in 2022) and labor/automation trends (IFR 2023: 517,385 robots) shape margins.
| Metric | Value |
|---|---|
| Aircraft backlog (2024) | ~8,000 units |
| Brent (2024) | $~85/bbl |
| Fed funds (mid‑2025) | 5.25–5.50% |
| IFR robot installs (2023) | 517,385 |
What You See Is What You Get
NN PESTLE Analysis
The preview shown here is the exact NN PESTLE Analysis document you’ll receive after purchase—fully formatted and ready to use. The layout, content, and structure you see are identical to the downloadable file with no placeholders or teasers. After checkout you’ll instantly get this finished, professionally structured file.

Original: $10.00
-65%$10.00
$3.50Product Information
Product Information
Shipping & Returns
Shipping & Returns
Description
Skip the Research. Get the Strategy.
Discover how political shifts, economic trends, social changes, and technological advances are shaping NN’s strategic outlook in our concise PESTLE snapshot. Ideal for investors, consultants, and executives, this analysis highlights risks and opportunities you can act on immediately. Purchase the full PESTLE for the complete, editable deep dive and actionable recommendations.
Political factors
Defense spending and procurement cycles
NN’s aerospace and defense exposure ties revenue to government budgets and multi-year procurement timetables; U.S. defense spending remains a key driver with the FY2025 proposal near $842 billion and NATO members collectively spending over $1 trillion annually. Shifts in U.S./NATO allocations or supplemental authorizations can accelerate or delay component orders. Election outcomes and geopolitical flashpoints reshape priorities across air, land, sea, and space platforms. Diversifying programs and allies mitigates single-program risk.
Trade policy, tariffs, and reshoring incentives
Tariffs (eg US 25% steel/aluminum Section 232, US Section 301 tariffs up to 25% on about $370B of Chinese goods) raise input costs and squeeze pricing power; the CHIPS Act ($52B) and EU mobilization of tens of billions of euros for industrial reshoring favor domestic capacity and qualified suppliers. Trade frictions and export controls on semiconductors disrupt cross‑border flows; strategic dual‑sourcing hedges volatility.
Export controls and sanctions regimes
ITAR and EAR govern aerospace, defense and select medical technologies via the US Munitions List and Commerce Control List, and compliance is mandatory for cross-border sales. Expanding sanctions and end-use controls — with OFAC SDN lists now exceeding 10,000 entries — force stringent screening and documentation. Non-compliance can trigger shipment holds, seizure and long-term reputational harm. Robust compliance programs and audited export controls enable continued global sales without regulatory breaches.
Industrial policy and subsidies
Government grants, tax credits and concessional loans in 2024–25 commonly cover 10–50% of project capex, with award sizes from $100k to >$50m, supporting automation, precision machining and materials R&D; participation lowers upfront capex and funds workforce upskilling. Subsidy eligibility requires regular reporting, milestone performance and potential clawbacks, and alignment with priority sectors raises award likelihood.
- Grant sizes: $0.1M–$50M+
- Capex coverage: ~10–50%
- R&D tax credits: material offset to operating cost
- Compliance: reporting, milestones, clawbacks
Political stability and regional risk
Operations and suppliers in emerging markets face coups, labor unrest or policy reversals that can hit regions contributing about 60% of global GDP (IMF 2024); logistics corridors can be disrupted by conflicts or port closures, delaying shipments weeks and adding costs in the low- to mid-single-digit percent of revenue. Scenario planning, inventory buffers and country diversification with local partners reduce shock impacts and speed recovery.
- ~60% of global GDP in emerging markets (IMF 2024)
- 30+ high-risk countries for political instability
- Inventory buffers and local partnerships shorten recovery times
Defense demand tied to FY2025 US $842B, NATO >$1T; tariffs and controls raise costs
NN’s defense revenue tied to FY2025 US defense ~$842B and NATO >$1T; budget shifts and elections can delay multi‑year procurements. Tariffs (US 25% steel/al) and Section 301 on ~$370B of China goods, plus export controls/OFAC SDN >10,000, raise input/compliance costs. Grants cover ~10–50% capex; emerging‑market instability (≈60% global GDP) amplifies supply risk.
| Metric | Value |
|---|---|
| US FY2025 | $842B |
| NATO | >$1T |
| Tariffs | 25% |
What is included in the product
Detailed Word Document
Explores how external macro-environmental factors uniquely affect NN across Political, Economic, Social, Technological, Environmental and Legal dimensions, providing data-backed, region- and industry-specific insights to identify threats, opportunities and forward-looking scenarios for executives, investors and strategists.
Customizable Excel Spreadsheet
A concise, visually segmented NN PESTLE summary that’s easily dropped into presentations or shared across teams, helping stakeholders quickly align on external risks and market positioning while allowing contextual notes for region or business-line specifics.
Economic factors
Industrial cycle sensitivity
Precision components closely track OEM build rates in aerospace, medical devices and power systems; global commercial aircraft backlog remained ~8,000 units in 2024 supporting near-term demand but cyclicality persists. Downturns can compress volumes and mix, cutting EBITDA margins by 3–8 percentage points; recoveries lift utilization and margins. Flexible cost structures and backlog visibility stabilize profitability across cycles.
Input cost inflation and commodity volatility
Tool steel, titanium, specialty alloys, resins and energy are primary drivers of COGS for NN, with Brent averaging about $85/bbl in 2024 lifting energy-related input costs; index-linked contracts and hedging typically trim volatility but rarely eliminate margin exposure. Supplier consolidation has begun to improve purchasing leverage, while continuous yield improvements of a few percent per year help offset cost swings over time.
Interest rates and capital access
Higher policy rates have raised borrowing costs for capex, automation and working capital, with US fed funds at about 5.25–5.50% and ECB deposit around 4.0% as of mid‑2025. Customers may delay new program launches under tighter conditions, reducing near‑term demand. Strong liquidity and staggered maturities preserve investment capacity. ROI discipline focuses on projects with quick paybacks and clear pricing power.
FX fluctuations and global revenue mix
Multi-currency sales and sourcing create translation and transaction risk; the US dollar surged ~16% in 2022 (DXY), highlighting exposure that can shave margins if currency mismatches are not hedged. Localized sourcing and natural hedges reduce P&L volatility, while pricing clauses and forward contracts (FX markets average $6.6tn/day per BIS 2019) provide active protection.
- Translation risk: cross-border revenues
- Transaction risk: invoicing currency mismatch
- Natural hedge: localized sourcing
- Mitigation: pricing clauses, forwards/futures
Labor markets and productivity
Skilled machinist and engineer shortages push wages and extend lead times, while apprenticeships and partnerships with technical schools are stabilizing pipelines. Automation adoption is rising — IFR reports 517,385 industrial robot installations in 2023 — raising throughput per headcount and quality yield. Retention programs reduce rework and scrap costs by improving operator skill continuity.
- Shortages → higher wages, longer lead times
- Apprenticeships → skilled pipeline growth
- Automation (IFR 2023: 517,385 robots) → higher throughput, better yield
- Retention programs → lower rework/scrap costs
Defense demand tied to FY2025 US $842B, NATO >$1T; tariffs and controls raise costs
Demand tied to OEM build rates remains supported by a ~8,000 commercial aircraft backlog in 2024 but cyclical dips can cut EBITDA 3–8pp. Input costs driven by Brent ~$85/bbl (2024) and specialty alloys; supplier consolidation and yield gains mitigate. Higher rates (US fed funds 5.25–5.50% mid‑2025), FX volatility (DXY spike ~16% in 2022) and labor/automation trends (IFR 2023: 517,385 robots) shape margins.
| Metric | Value |
|---|---|
| Aircraft backlog (2024) | ~8,000 units |
| Brent (2024) | $~85/bbl |
| Fed funds (mid‑2025) | 5.25–5.50% |
| IFR robot installs (2023) | 517,385 |
What You See Is What You Get
NN PESTLE Analysis
The preview shown here is the exact NN PESTLE Analysis document you’ll receive after purchase—fully formatted and ready to use. The layout, content, and structure you see are identical to the downloadable file with no placeholders or teasers. After checkout you’ll instantly get this finished, professionally structured file.











