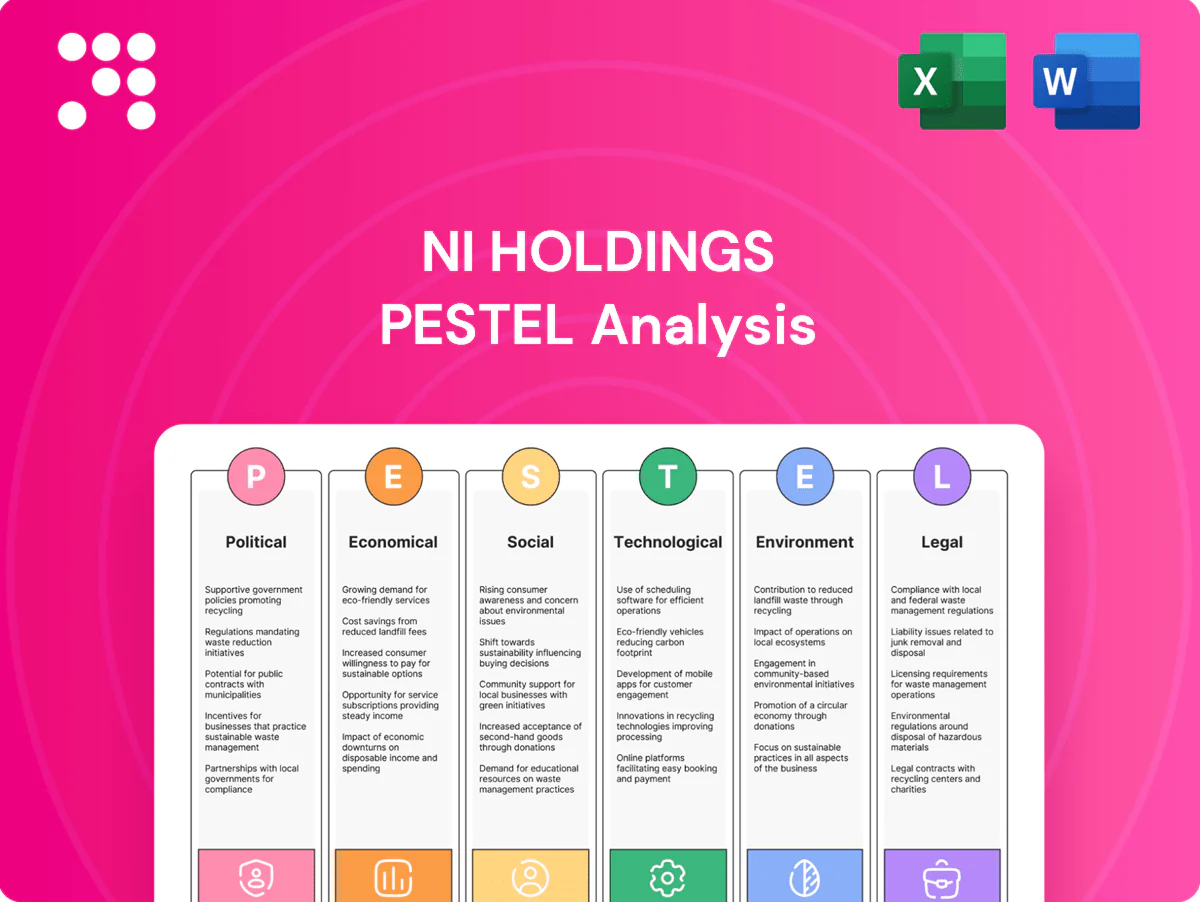
NI Holdings PESTLE Analysis

Plan Smarter. Present Sharper. Compete Stronger.
Discover how political shifts, economic cycles, social trends, technological advances, legal changes, and environmental pressures converge to shape NI Holdings’ strategic outlook. Our concise PESTLE highlights key risks and opportunities you can act on immediately. Purchase the full analysis for the complete, editable report and make data-driven decisions with confidence.
Political factors

State-level insurance oversight
Insurance regulation in the U.S. is predominantly at the state level across 50 states plus the District of Columbia, determining rate approvals and product filings for NI Holdings. Shifts in gubernatorial and state legislative leadership since 2022 have altered regulatory priorities and scrutiny in key markets. Coordination across multiple state regulators and uneven adoption of NAIC model laws increases launch complexity and can lengthen approval processes.
Federal disaster policy
Federal disaster policy reshapes NI Holdings' residual market exposure: NFIP still insures about 4.6 million policies with roughly $1.3 trillion in coverage, and NFIP reforms plus federal catastrophe backstops materially influence pricing and tail risk allocation. Policy shifts alter private take-up—only ~30% of high-risk flood properties carry insurance—so reduced federal support reallocates risk to private carriers. Budget cycles and congressional gridlock create multi-year uncertainty for disaster frameworks and pricing assumptions.

Trade and reinsurance relations
International reinsurance markets are highly sensitive to geopolitical risk and trade policy; sanctions such as those on Russia since 2022 have demonstrably reduced capacity and reallocated risk. Political stability in hubs like London, Bermuda and Zurich (Lloyds reported £48.3bn GWP in 2023) underpins catastrophe risk transfer. Treaty frictions can raise retrocession costs and compress underwriting margins, tightening capacity during crises.

Infrastructure and climate policy
Government resilience funding—Bipartisan Infrastructure Law committed about 50 billion USD toward climate resilience since 2021—lowers loss severity for NI Holdings over time, while lax local building standards increase P&C catastrophe exposures and claim volatility. Insurer underwriting incorporates mitigation incentives, affecting eligibility and premium discounts; clearer policy frameworks improve catastrophe-model assumptions and capital planning.
- resilience funding: 50bn USD since 2021
- lax standards = higher CAT exposure
- mitigation incentives affect underwriting/discounts
- policy clarity improves CAT modeling
Tax and capital incentives
Corporate tax policy (federal 21% with typical combined effective rates near 25–27% in the US) plus loss-reserve tax timing and investment tax rules materially shape NI Holdings after-tax ROE; NAIC RBC debates and proposed capital requirement shifts (company action level 200% RBC) can force surplus adjustments and change reinsurance/use of capital. Incentives for municipal bonds in a $4.3T muni market tilt portfolios toward tax-exempt yield, and stability supports multi-year underwriting cycles.
- tax-rate: federal 21%, effective ~25–27%
- RBC: company action level 200%
- muni-market: ~$4.3T
- impact: reserves/timing alter after-tax ROE
State insurance control, NFIP tail risk, reinsurance squeeze, resilience funding shift pricing
State-led insurance regulation across 50 states plus DC shapes product approvals and pricing, with shifting state political control since 2022 increasing regulatory variability. Federal disaster policy and NFIP (≈4.6M policies, ~$1.3T coverage) shift tail risk toward private markets. Reinsurance capacity (Lloyds GWP £48.3bn in 2023) and sanctions affect retrocession costs. Resilience funding (~$50bn since 2021) and tax/RBC rules (federal 21%, effective ~25–27%; CAL 200% RBC) drive capital and pricing decisions.
| Factor | Key Metric |
|---|---|
| NFIP | ~4.6M policies; ~$1.3T coverage |
| Resilience funding | ~$50bn since 2021 |
| Reinsurance | Lloyds GWP £48.3bn (2023) |
| Tax/RBC | Fed 21%; effective 25–27%; CAL 200% RBC |
| Muni market | ~$4.3T |
What is included in the product
 Detailed Word Document
Explores how Political, Economic, Social, Technological, Environmental, and Legal forces uniquely affect NI Holdings, with data-backed trends and region-specific regulatory context; designed to help executives, investors, and strategists identify risks, opportunities and actionable, forward-looking scenarios for planning and funding.

 Customizable Excel Spreadsheet
A concise, visually segmented PESTLE summary for NI Holdings that simplifies external risk assessment and market positioning, ready to drop into presentations or share across teams; editable notes let users tailor insights to region or business line.
Economic factors

Interest rate environment
Investment income is a key earnings driver for NI Holdings; higher rates in mid-2025 (US 10-yr ~4.0%, fed funds ~5.25–5.50%) lift fixed-income yields but depress bond market valuations short term. Longer duration holdings increase OCI volatility and regulatory capital strain. Rate cycles also expand or compress pricing capacity in P&C underwriting.
Inflation and claims severity
Auto and property repair cost inflation, which peaked near 15% in 2021–22, has moderated to mid-single digits by 2024, but still elevates loss severity and LAE for NI Holdings. Social inflation continues to push liability awards higher, contributing double-digit severity gains in recent years. Accurate rate filings and rapid repricing are essential to protect combined ratios near or above 100%. Supply-chain normalization should moderate trends going into 2025.

Catastrophe frequency and capital cycle
Active CAT seasons have driven insured losses of roughly $120bn in 2023, tightening reinsurance capacity and pushing ceded premiums higher; reinsurer rate-on-line rises of roughly 15–25% in peak catastrophe lines in 2023–24 improved rate adequacy but constrained growth in retrocession-sensitive commercial lines. Flows into ILS, around $100bn of collateralised limit in 2024, and periodic outflows shift NI Holdings’ net retention choices. Robust volatility management and capital optimisation remain critical to preserve underwriting profitability.

Employment and exposure growth
Rising payrolls, housing starts and small-business formation drive NI Holdings’ insured exposure growth; US nonfarm payrolls rose ~1.6% in 2024, housing starts averaged ~1.4M annualized (Census Bureau 2024) and business applications stayed elevated, supporting premium base. Economic slowdowns compress commercial-line premiums; niche specialties show resilience if demand remains. Geographic mix across regions moderates underwriting cyclicality.
- payrolls: +1.6% (2024)
- housing starts: ~1.4M (2024)
- biz formation: elevated (2024)
- niche resilience
- geographic diversification
Consumer price sensitivity
Premium affordability pressures are driving retention risks as 2024 US CPI at 3.4% y/y and tighter household budgets push more policyholders to shop or lapse; multi-policy discounts and usage-based insurance (rising adoption in 2023–24) can materially reduce churn. Competitor price cuts propagate rapidly across regional markets, so transparent value propositions and clear persistency metrics improve renewals.
- Inflation pressure: 2024 CPI 3.4% y/y
- Churn mitigation: multi-policy + UBI lower lapse rates
- Market sensitivity: competitor pricing spreads quickly
- Retention lever: clear, quantifiable value propositions
State insurance control, NFIP tail risk, reinsurance squeeze, resilience funding shift pricing
Higher rates (US 10yr ~4.0% mid‑2025; fed funds ~5.25–5.50%) boost investment yields but raise OCI volatility and capital strain; 2024 CPI 3.4% pressures premium affordability and churn. Active CATs (insured losses ~$120bn in 2023) tightened reinsurance; ILS collateral ~ $100bn (2024). Payrolls +1.6% and housing starts ~1.4M (2024) support exposure growth.
| Metric | Value |
|---|---|
| US 10yr (mid‑2025) | ~4.0% |
| Fed funds | 5.25–5.50% |
| CPI (2024) | 3.4% y/y |
| Insured CAT losses (2023) | ~$120bn |
| ILS collateral (2024) | ~$100bn |
| Payrolls (2024) | +1.6% |
| Housing starts (2024) | ~1.4M |
Preview the Actual Deliverable
NI Holdings PESTLE Analysis
The preview shown here is the exact NI Holdings PESTLE Analysis you’ll receive after purchase—fully formatted and ready to use. The content, structure, and professional layout visible in the preview are identical to the downloadable file delivered immediately after payment. No placeholders or teasers—this is the real, final document.

Original: $10.00
-65%$10.00
$3.50Product Information
Product Information
Shipping & Returns
Shipping & Returns
Description
Plan Smarter. Present Sharper. Compete Stronger.
Discover how political shifts, economic cycles, social trends, technological advances, legal changes, and environmental pressures converge to shape NI Holdings’ strategic outlook. Our concise PESTLE highlights key risks and opportunities you can act on immediately. Purchase the full analysis for the complete, editable report and make data-driven decisions with confidence.
Political factors
State-level insurance oversight
Insurance regulation in the U.S. is predominantly at the state level across 50 states plus the District of Columbia, determining rate approvals and product filings for NI Holdings. Shifts in gubernatorial and state legislative leadership since 2022 have altered regulatory priorities and scrutiny in key markets. Coordination across multiple state regulators and uneven adoption of NAIC model laws increases launch complexity and can lengthen approval processes.
Federal disaster policy
Federal disaster policy reshapes NI Holdings' residual market exposure: NFIP still insures about 4.6 million policies with roughly $1.3 trillion in coverage, and NFIP reforms plus federal catastrophe backstops materially influence pricing and tail risk allocation. Policy shifts alter private take-up—only ~30% of high-risk flood properties carry insurance—so reduced federal support reallocates risk to private carriers. Budget cycles and congressional gridlock create multi-year uncertainty for disaster frameworks and pricing assumptions.
Trade and reinsurance relations
International reinsurance markets are highly sensitive to geopolitical risk and trade policy; sanctions such as those on Russia since 2022 have demonstrably reduced capacity and reallocated risk. Political stability in hubs like London, Bermuda and Zurich (Lloyds reported £48.3bn GWP in 2023) underpins catastrophe risk transfer. Treaty frictions can raise retrocession costs and compress underwriting margins, tightening capacity during crises.
Infrastructure and climate policy
Government resilience funding—Bipartisan Infrastructure Law committed about 50 billion USD toward climate resilience since 2021—lowers loss severity for NI Holdings over time, while lax local building standards increase P&C catastrophe exposures and claim volatility. Insurer underwriting incorporates mitigation incentives, affecting eligibility and premium discounts; clearer policy frameworks improve catastrophe-model assumptions and capital planning.
- resilience funding: 50bn USD since 2021
- lax standards = higher CAT exposure
- mitigation incentives affect underwriting/discounts
- policy clarity improves CAT modeling
Tax and capital incentives
Corporate tax policy (federal 21% with typical combined effective rates near 25–27% in the US) plus loss-reserve tax timing and investment tax rules materially shape NI Holdings after-tax ROE; NAIC RBC debates and proposed capital requirement shifts (company action level 200% RBC) can force surplus adjustments and change reinsurance/use of capital. Incentives for municipal bonds in a $4.3T muni market tilt portfolios toward tax-exempt yield, and stability supports multi-year underwriting cycles.
- tax-rate: federal 21%, effective ~25–27%
- RBC: company action level 200%
- muni-market: ~$4.3T
- impact: reserves/timing alter after-tax ROE
State insurance control, NFIP tail risk, reinsurance squeeze, resilience funding shift pricing
State-led insurance regulation across 50 states plus DC shapes product approvals and pricing, with shifting state political control since 2022 increasing regulatory variability. Federal disaster policy and NFIP (≈4.6M policies, ~$1.3T coverage) shift tail risk toward private markets. Reinsurance capacity (Lloyds GWP £48.3bn in 2023) and sanctions affect retrocession costs. Resilience funding (~$50bn since 2021) and tax/RBC rules (federal 21%, effective ~25–27%; CAL 200% RBC) drive capital and pricing decisions.
| Factor | Key Metric |
|---|---|
| NFIP | ~4.6M policies; ~$1.3T coverage |
| Resilience funding | ~$50bn since 2021 |
| Reinsurance | Lloyds GWP £48.3bn (2023) |
| Tax/RBC | Fed 21%; effective 25–27%; CAL 200% RBC |
| Muni market | ~$4.3T |
What is included in the product
Detailed Word Document
Explores how Political, Economic, Social, Technological, Environmental, and Legal forces uniquely affect NI Holdings, with data-backed trends and region-specific regulatory context; designed to help executives, investors, and strategists identify risks, opportunities and actionable, forward-looking scenarios for planning and funding.
Customizable Excel Spreadsheet
A concise, visually segmented PESTLE summary for NI Holdings that simplifies external risk assessment and market positioning, ready to drop into presentations or share across teams; editable notes let users tailor insights to region or business line.
Economic factors
Interest rate environment
Investment income is a key earnings driver for NI Holdings; higher rates in mid-2025 (US 10-yr ~4.0%, fed funds ~5.25–5.50%) lift fixed-income yields but depress bond market valuations short term. Longer duration holdings increase OCI volatility and regulatory capital strain. Rate cycles also expand or compress pricing capacity in P&C underwriting.
Inflation and claims severity
Auto and property repair cost inflation, which peaked near 15% in 2021–22, has moderated to mid-single digits by 2024, but still elevates loss severity and LAE for NI Holdings. Social inflation continues to push liability awards higher, contributing double-digit severity gains in recent years. Accurate rate filings and rapid repricing are essential to protect combined ratios near or above 100%. Supply-chain normalization should moderate trends going into 2025.
Catastrophe frequency and capital cycle
Active CAT seasons have driven insured losses of roughly $120bn in 2023, tightening reinsurance capacity and pushing ceded premiums higher; reinsurer rate-on-line rises of roughly 15–25% in peak catastrophe lines in 2023–24 improved rate adequacy but constrained growth in retrocession-sensitive commercial lines. Flows into ILS, around $100bn of collateralised limit in 2024, and periodic outflows shift NI Holdings’ net retention choices. Robust volatility management and capital optimisation remain critical to preserve underwriting profitability.
Employment and exposure growth
Rising payrolls, housing starts and small-business formation drive NI Holdings’ insured exposure growth; US nonfarm payrolls rose ~1.6% in 2024, housing starts averaged ~1.4M annualized (Census Bureau 2024) and business applications stayed elevated, supporting premium base. Economic slowdowns compress commercial-line premiums; niche specialties show resilience if demand remains. Geographic mix across regions moderates underwriting cyclicality.
- payrolls: +1.6% (2024)
- housing starts: ~1.4M (2024)
- biz formation: elevated (2024)
- niche resilience
- geographic diversification
Consumer price sensitivity
Premium affordability pressures are driving retention risks as 2024 US CPI at 3.4% y/y and tighter household budgets push more policyholders to shop or lapse; multi-policy discounts and usage-based insurance (rising adoption in 2023–24) can materially reduce churn. Competitor price cuts propagate rapidly across regional markets, so transparent value propositions and clear persistency metrics improve renewals.
- Inflation pressure: 2024 CPI 3.4% y/y
- Churn mitigation: multi-policy + UBI lower lapse rates
- Market sensitivity: competitor pricing spreads quickly
- Retention lever: clear, quantifiable value propositions
State insurance control, NFIP tail risk, reinsurance squeeze, resilience funding shift pricing
Higher rates (US 10yr ~4.0% mid‑2025; fed funds ~5.25–5.50%) boost investment yields but raise OCI volatility and capital strain; 2024 CPI 3.4% pressures premium affordability and churn. Active CATs (insured losses ~$120bn in 2023) tightened reinsurance; ILS collateral ~ $100bn (2024). Payrolls +1.6% and housing starts ~1.4M (2024) support exposure growth.
| Metric | Value |
|---|---|
| US 10yr (mid‑2025) | ~4.0% |
| Fed funds | 5.25–5.50% |
| CPI (2024) | 3.4% y/y |
| Insured CAT losses (2023) | ~$120bn |
| ILS collateral (2024) | ~$100bn |
| Payrolls (2024) | +1.6% |
| Housing starts (2024) | ~1.4M |
Preview the Actual Deliverable
NI Holdings PESTLE Analysis
The preview shown here is the exact NI Holdings PESTLE Analysis you’ll receive after purchase—fully formatted and ready to use. The content, structure, and professional layout visible in the preview are identical to the downloadable file delivered immediately after payment. No placeholders or teasers—this is the real, final document.











