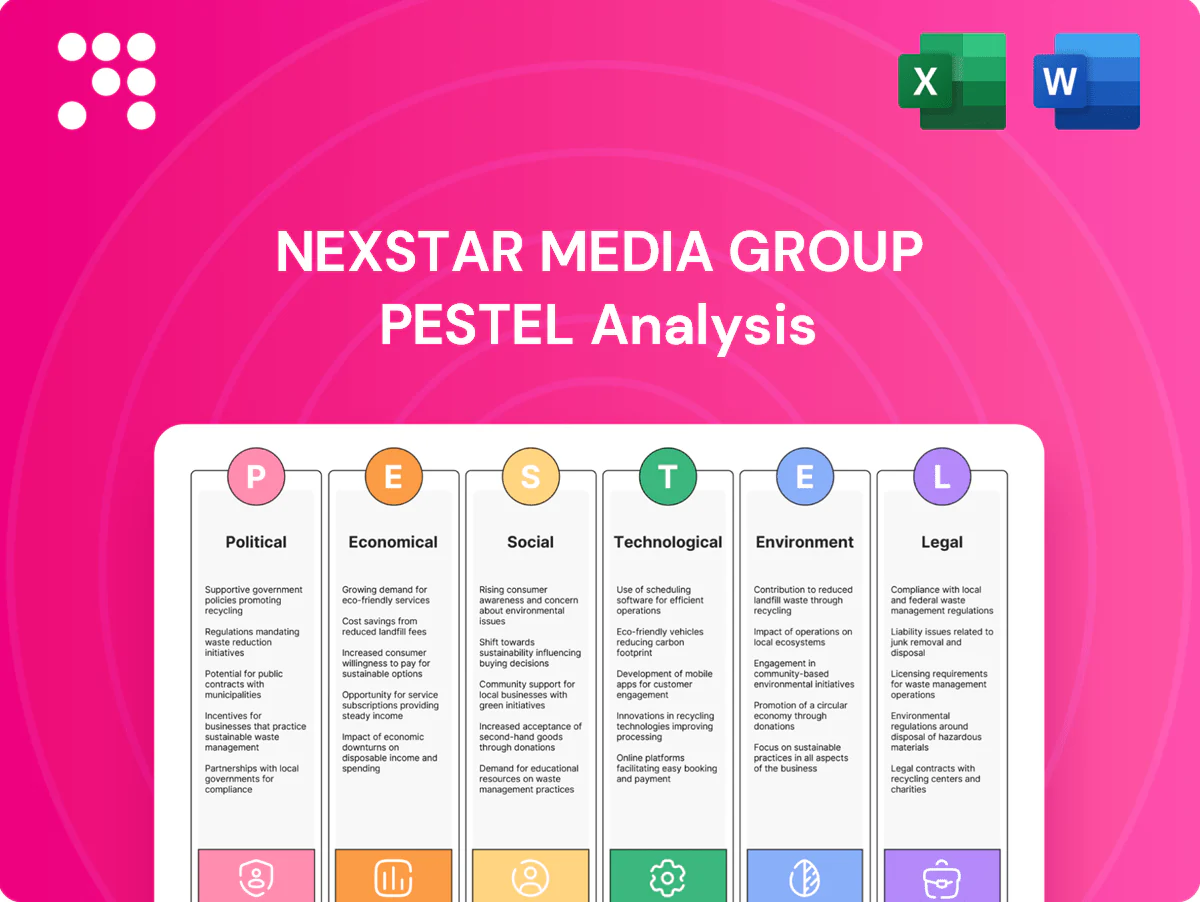
Nexstar Media Group PESTLE Analysis

Your Competitive Advantage Starts with This Report
Discover how political regulation, shifting ad markets, and digital disruption are reshaping Nexstar Media Group’s outlook in our concise PESTLE snapshot; use these insights to refine strategy and anticipate risks. Purchase the full PESTLE for the complete, actionable breakdown and ready-to-use intelligence.
Political factors

FCC oversight and media policy
FCC rules on station ownership, licensing, content standards and public-interest obligations define Nexstar’s operating latitude; Nexstar owns 199 stations in ~115 markets reaching about 111 million viewers (~38% of US TV households). Changes to cross-ownership or localism mandates could reshape market structure and M&A options. Political shifts in the commission or Congress can alter enforcement priorities and review timelines. Proactive compliance and advocacy help preserve strategic flexibility.
Retransmission and must-carry debates
Policy outcomes on retransmission consent shape affiliate bargaining power and fee trajectories, with U.S. pay-TV subscriptions falling below 60 million in 2023, raising leverage for digital carriage; lawmaker hearings in 2023–24 over blackout harms have increased political pressure on negotiations and margins. As cable/satellite erosion elevates virtual MVPD carriage terms, Nexstar must balance consumer optics against fee-growth imperatives.

Political advertising cycles
Election-year TV ad surges—US political ad spend hit about $8.9B in 2020 and roughly $4.9B in 2022—are major revenue drivers for Nexstar and NewsNation, often spiking local station inventory allocation and CPMs. Campaign finance rules and ad access requirements shape pricing and blackout windows, while redistricting and ballot initiatives concentrate local spend; off-cycle years force Nexstar to diversify nonpolitical revenue to smooth volatility.

Spectrum and public safety priorities
National spectrum policy and the ATSC 3.0 transition are reshaping Nexstar’s capacity: NextGen TV deployments reached roughly 210 U.S. markets and about 1,300 stations by mid-2025, opening datacasting and targeted B2B revenue paths while requiring stricter interference protections. Public safety priorities can force spectrum reallocation or technical limits, raising coordination costs during repacks and market reconfigurations. Strategic spectrum use—datacasting, localized 5G partnerships—could unlock new B2B services and incremental revenue streams.
- Market reach: ~210 markets, ~1,300 stations (mid-2025)
- Cost pressure: higher coordination during repacks and interference mitigation
- Opportunity: datacasting and B2B services from ATSC 3.0 spectrum
Trade, geopolitics, and supply chain
Sanctions, tariffs and geopolitical frictions (US tariffs on select Chinese goods remain up to 25% in 2024) can raise costs and delay procurement of transmission and studio equipment; currency and trade-policy shifts further affect imported component pricing and lead times. Political risk has delayed some U.S. network rollouts and facility upgrades; diversified suppliers and inventory buffers reduce this exposure.
- Tariffs up to 25% (2024)
- Currency/trade shifts → higher input costs
- Political delays risk rollout timelines
- Diversification + inventory buffers mitigate impact
FCC oversight, 199 stations reach ~111M; ATSC 3.0, ad-cycle volatility & tariff risk
FCC ownership, retrans rules and Congressional oversight shape Nexstar’s 199‑station reach to ~111M viewers and M&A levers; enforcement shifts change deal timelines. Political ad cycles (US political TV spend: ~$8.9B in 2020, ~$4.9B in 2022) drive revenue volatility. ATSC 3.0 (~210 markets, ~1,300 stations mid‑2025) and spectrum policy create B2B datacasting upside; tariffs (up to 25% in 2024) raise equipment cost risks.
| Metric | Value |
|---|---|
| Stations / Reach | 199 / ~111M viewers |
| Political ad spend | $8.9B (2020), $4.9B (2022) |
| ATSC 3.0 | ~210 markets, ~1,300 stations (mid‑2025) |
| Tariffs | Up to 25% (2024) |
What is included in the product
 Detailed Word Document
Explores how external macro-environmental factors uniquely affect Nexstar Media Group across Political, Economic, Social, Technological, Environmental and Legal dimensions, providing data-backed, forward-looking insights to help executives, consultants and investors identify threats, opportunities and strategic implications.

 Customizable Excel Spreadsheet
A concise, visually segmented PESTLE summary of Nexstar Media Group that distills regulatory, technological, economic and market risks into a single slide-ready page, editable for regional or business-line notes—ideal for quickly relieving research overload and aligning teams in meetings, presentations, or client reports.
Economic factors

Advertising spend cyclicality
Local and national ad budgets for Nexstar track US GDP and labor conditions—US real GDP grew about 2.5% in 2024 while unemployment averaged near 3.7%, supporting ad demand. Recessionary periods historically compress CPMs and lengthen sales cycles, often cutting rates by double digits and delaying buys. Political advertising (2024 political TV spend topped $10 billion) and major sports events can offset downturns but increase volatility. Growing digital revenue and distribution fees, now material for broadcasters, help stabilize cash flow.
Cord-cutting and distribution fees
Cord-cutting has eroded U.S. pay-TV reach—industry estimates put pay-TV households near 55–60 million in 2024—boosting retransmission fee sensitivity even as retrans fee growth remains a key revenue driver for Nexstar. vMVPDs and streaming bundles partially backfill reach but offer lower per-subscriber fees, constraining distributor willingness to accept fee hikes amid their margin pressure. Direct-to-consumer and FAST channels are expanding ad and subscription monetization, with CTV ad spend rising and offering incremental upside. Contract cadence and scheduled step-ups provide near-term visibility into retransmission revenue timing.

Interest rates and leverage
Higher rates (US federal funds target 5.25–5.50% in July 2025) raise borrowing costs, constraining buybacks, M&A and capex for Nexstar. Debt-service sensitivity is acute for a scaled station portfolio with sizable leverage, making refinancing windows and covenant headroom decisive for capital allocation. Disciplined deleveraging preserves equity value through cycles.

Content and sports rights inflation
Premium sports and marquee-programming rights have continued to inflate, with fees rising mid-to-high single digits year-over-year into 2023–24, squeezing local station margins and pushing Nexstar to prioritize high-yield inventory.
Affiliation terms with The CW and acquired sports packages directly influence schedule competitiveness and ad yield, prompting Nexstar to seek bundling and co-production to lower cash outlays.
Strict ROI discipline now guides programming mix across dayparts, favoring live sports and news that deliver premium CPMs and audience retention.
- rights-inflation: mid-to-high single-digit y/y
- mitigation: bundling & co-production to cut cash needs
- strategy: ROI-led daypart programming toward live sports/news
Local market dispersion
Local economic performance varies across DMAs, affecting automotive, retail, healthcare and political ad demand; top 50 DMAs capture roughly 75% of TV ad spend, so metro-level growth is uneven.
Nexstar’s portfolio of about 200 stations in ~115 markets and reach near 62% of US TV households cushions city-specific shocks.
Sales execution and dynamic pricing target high-growth metros to capture upside, while data-driven targeting and local digital inventory boost yield and CPMs.
- ~200 stations; ~115 markets; ~62% US TV households reach
- Top 50 DMAs ≈75% of TV ad spend
- Dynamic pricing + data targeting = higher local CPMs
FCC oversight, 199 stations reach ~111M; ATSC 3.0, ad-cycle volatility & tariff risk
US real GDP ~2.5% in 2024 and unemployment ~3.7% supported ad demand while political TV spend topped $10B; federal funds 5.25–5.50% (Jul 2025) raises borrowing costs for Nexstar. Cord‑cutting (pay‑TV households ~55–60M in 2024) increases retransmission fee sensitivity even as ~200 stations (~115 markets; ~62% reach) and top‑50 DMAs (~75% ad spend) concentrate revenue. Rights inflation mid‑to‑high single digits pressures margins; digital/CTV growth and retrans step‑ups stabilize cash flow.
| Metric | Latest |
|---|---|
| Stations/Markets/Reach | ~200 / ~115 / ~62% |
| Top‑50 DMA ad share | ~75% |
| Pay‑TV households (2024) | 55–60M |
| Political TV spend (2024) | >$10B |
| Fed funds (Jul 2025) | 5.25–5.50% |
Full Version Awaits
Nexstar Media Group PESTLE Analysis
The preview shown is the exact Nexstar Media Group PESTLE Analysis you’ll receive after purchase—fully formatted and ready to use. This file is the final, professionally structured document with no placeholders or teasers. After checkout you can download this exact report immediately.

Product Information
Product Information
Shipping & Returns
Shipping & Returns
Description
Your Competitive Advantage Starts with This Report
Discover how political regulation, shifting ad markets, and digital disruption are reshaping Nexstar Media Group’s outlook in our concise PESTLE snapshot; use these insights to refine strategy and anticipate risks. Purchase the full PESTLE for the complete, actionable breakdown and ready-to-use intelligence.
Political factors
FCC oversight and media policy
FCC rules on station ownership, licensing, content standards and public-interest obligations define Nexstar’s operating latitude; Nexstar owns 199 stations in ~115 markets reaching about 111 million viewers (~38% of US TV households). Changes to cross-ownership or localism mandates could reshape market structure and M&A options. Political shifts in the commission or Congress can alter enforcement priorities and review timelines. Proactive compliance and advocacy help preserve strategic flexibility.
Retransmission and must-carry debates
Policy outcomes on retransmission consent shape affiliate bargaining power and fee trajectories, with U.S. pay-TV subscriptions falling below 60 million in 2023, raising leverage for digital carriage; lawmaker hearings in 2023–24 over blackout harms have increased political pressure on negotiations and margins. As cable/satellite erosion elevates virtual MVPD carriage terms, Nexstar must balance consumer optics against fee-growth imperatives.
Political advertising cycles
Election-year TV ad surges—US political ad spend hit about $8.9B in 2020 and roughly $4.9B in 2022—are major revenue drivers for Nexstar and NewsNation, often spiking local station inventory allocation and CPMs. Campaign finance rules and ad access requirements shape pricing and blackout windows, while redistricting and ballot initiatives concentrate local spend; off-cycle years force Nexstar to diversify nonpolitical revenue to smooth volatility.
Spectrum and public safety priorities
National spectrum policy and the ATSC 3.0 transition are reshaping Nexstar’s capacity: NextGen TV deployments reached roughly 210 U.S. markets and about 1,300 stations by mid-2025, opening datacasting and targeted B2B revenue paths while requiring stricter interference protections. Public safety priorities can force spectrum reallocation or technical limits, raising coordination costs during repacks and market reconfigurations. Strategic spectrum use—datacasting, localized 5G partnerships—could unlock new B2B services and incremental revenue streams.
- Market reach: ~210 markets, ~1,300 stations (mid-2025)
- Cost pressure: higher coordination during repacks and interference mitigation
- Opportunity: datacasting and B2B services from ATSC 3.0 spectrum
Trade, geopolitics, and supply chain
Sanctions, tariffs and geopolitical frictions (US tariffs on select Chinese goods remain up to 25% in 2024) can raise costs and delay procurement of transmission and studio equipment; currency and trade-policy shifts further affect imported component pricing and lead times. Political risk has delayed some U.S. network rollouts and facility upgrades; diversified suppliers and inventory buffers reduce this exposure.
- Tariffs up to 25% (2024)
- Currency/trade shifts → higher input costs
- Political delays risk rollout timelines
- Diversification + inventory buffers mitigate impact
FCC oversight, 199 stations reach ~111M; ATSC 3.0, ad-cycle volatility & tariff risk
FCC ownership, retrans rules and Congressional oversight shape Nexstar’s 199‑station reach to ~111M viewers and M&A levers; enforcement shifts change deal timelines. Political ad cycles (US political TV spend: ~$8.9B in 2020, ~$4.9B in 2022) drive revenue volatility. ATSC 3.0 (~210 markets, ~1,300 stations mid‑2025) and spectrum policy create B2B datacasting upside; tariffs (up to 25% in 2024) raise equipment cost risks.
| Metric | Value |
|---|---|
| Stations / Reach | 199 / ~111M viewers |
| Political ad spend | $8.9B (2020), $4.9B (2022) |
| ATSC 3.0 | ~210 markets, ~1,300 stations (mid‑2025) |
| Tariffs | Up to 25% (2024) |
What is included in the product
Detailed Word Document
Explores how external macro-environmental factors uniquely affect Nexstar Media Group across Political, Economic, Social, Technological, Environmental and Legal dimensions, providing data-backed, forward-looking insights to help executives, consultants and investors identify threats, opportunities and strategic implications.
Customizable Excel Spreadsheet
A concise, visually segmented PESTLE summary of Nexstar Media Group that distills regulatory, technological, economic and market risks into a single slide-ready page, editable for regional or business-line notes—ideal for quickly relieving research overload and aligning teams in meetings, presentations, or client reports.
Economic factors
Advertising spend cyclicality
Local and national ad budgets for Nexstar track US GDP and labor conditions—US real GDP grew about 2.5% in 2024 while unemployment averaged near 3.7%, supporting ad demand. Recessionary periods historically compress CPMs and lengthen sales cycles, often cutting rates by double digits and delaying buys. Political advertising (2024 political TV spend topped $10 billion) and major sports events can offset downturns but increase volatility. Growing digital revenue and distribution fees, now material for broadcasters, help stabilize cash flow.
Cord-cutting and distribution fees
Cord-cutting has eroded U.S. pay-TV reach—industry estimates put pay-TV households near 55–60 million in 2024—boosting retransmission fee sensitivity even as retrans fee growth remains a key revenue driver for Nexstar. vMVPDs and streaming bundles partially backfill reach but offer lower per-subscriber fees, constraining distributor willingness to accept fee hikes amid their margin pressure. Direct-to-consumer and FAST channels are expanding ad and subscription monetization, with CTV ad spend rising and offering incremental upside. Contract cadence and scheduled step-ups provide near-term visibility into retransmission revenue timing.
Interest rates and leverage
Higher rates (US federal funds target 5.25–5.50% in July 2025) raise borrowing costs, constraining buybacks, M&A and capex for Nexstar. Debt-service sensitivity is acute for a scaled station portfolio with sizable leverage, making refinancing windows and covenant headroom decisive for capital allocation. Disciplined deleveraging preserves equity value through cycles.
Content and sports rights inflation
Premium sports and marquee-programming rights have continued to inflate, with fees rising mid-to-high single digits year-over-year into 2023–24, squeezing local station margins and pushing Nexstar to prioritize high-yield inventory.
Affiliation terms with The CW and acquired sports packages directly influence schedule competitiveness and ad yield, prompting Nexstar to seek bundling and co-production to lower cash outlays.
Strict ROI discipline now guides programming mix across dayparts, favoring live sports and news that deliver premium CPMs and audience retention.
- rights-inflation: mid-to-high single-digit y/y
- mitigation: bundling & co-production to cut cash needs
- strategy: ROI-led daypart programming toward live sports/news
Local market dispersion
Local economic performance varies across DMAs, affecting automotive, retail, healthcare and political ad demand; top 50 DMAs capture roughly 75% of TV ad spend, so metro-level growth is uneven.
Nexstar’s portfolio of about 200 stations in ~115 markets and reach near 62% of US TV households cushions city-specific shocks.
Sales execution and dynamic pricing target high-growth metros to capture upside, while data-driven targeting and local digital inventory boost yield and CPMs.
- ~200 stations; ~115 markets; ~62% US TV households reach
- Top 50 DMAs ≈75% of TV ad spend
- Dynamic pricing + data targeting = higher local CPMs
FCC oversight, 199 stations reach ~111M; ATSC 3.0, ad-cycle volatility & tariff risk
US real GDP ~2.5% in 2024 and unemployment ~3.7% supported ad demand while political TV spend topped $10B; federal funds 5.25–5.50% (Jul 2025) raises borrowing costs for Nexstar. Cord‑cutting (pay‑TV households ~55–60M in 2024) increases retransmission fee sensitivity even as ~200 stations (~115 markets; ~62% reach) and top‑50 DMAs (~75% ad spend) concentrate revenue. Rights inflation mid‑to‑high single digits pressures margins; digital/CTV growth and retrans step‑ups stabilize cash flow.
| Metric | Latest |
|---|---|
| Stations/Markets/Reach | ~200 / ~115 / ~62% |
| Top‑50 DMA ad share | ~75% |
| Pay‑TV households (2024) | 55–60M |
| Political TV spend (2024) | >$10B |
| Fed funds (Jul 2025) | 5.25–5.50% |
Full Version Awaits
Nexstar Media Group PESTLE Analysis
The preview shown is the exact Nexstar Media Group PESTLE Analysis you’ll receive after purchase—fully formatted and ready to use. This file is the final, professionally structured document with no placeholders or teasers. After checkout you can download this exact report immediately.











