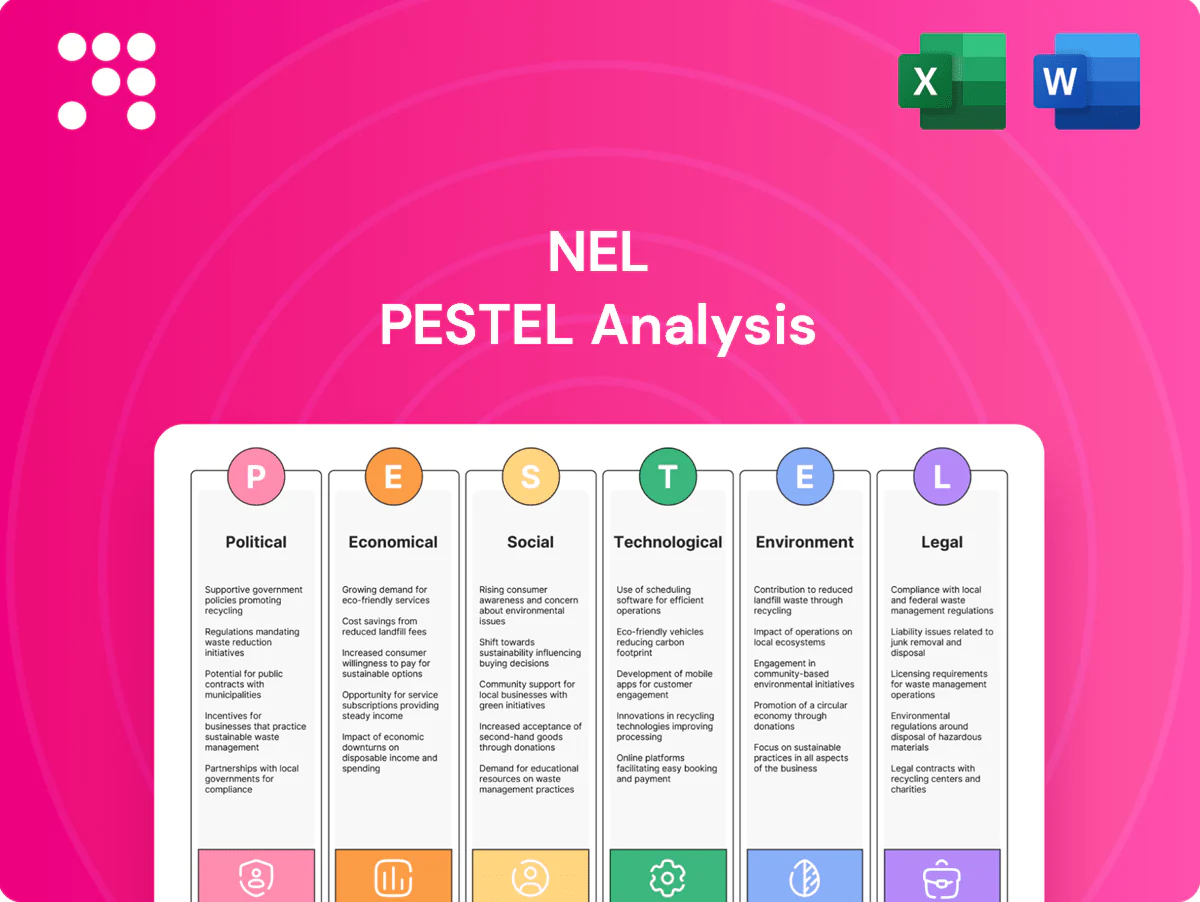
NEL PESTLE Analysis

Your Shortcut to Market Insight Starts Here
Unlock how macro forces—from regulations and subsidies to supply-chain shifts and green-tech advances—are shaping NEL's prospects in the hydrogen market. Our PESTLE highlights risks and opportunities investors and strategists need now. Purchase the full, editable analysis to get data-driven insights and actionable recommendations instantly.
Political factors

Hydrogen policy support
National hydrogen strategies dictate deployment pace and funding access for projects Nel targets, with the EU aiming for 10 million tonnes of renewable hydrogen by 2030. Stable multi-year incentives de-risk customer investments in electrolyzers and fueling, while the US Bipartisan Infrastructure Law committed about $8 billion to regional hydrogen hubs. Policy volatility or reversals can stall orders and strain backlogs, so monitoring EU, US and Asian policy pipelines is critical for forecasting.
Subsidies and public funding
Grants, tax credits and CfDs materially boost green hydrogen project IRRs—US 45V PTC offers up to $3/kg for low‑carbon H2 and EU IPCEI mobilised about €5.4bn, shifting payback favorably; eligibility rules push choices toward PEM or alkaline and local content requirements drive localization; tight competitive tender timetables reduce order visibility and delay revenue recognition; auction‑style procurement often compresses margins via aggressive price competition.

Geopolitics and energy security
Governments prioritize domestic hydrogen to reduce fuel import dependence, with the EU targeting 10 million tonnes of renewable hydrogen by 2030. Localization mandates and friend-shoring shape where Nel builds and sells, raising barriers for long cross-border supply chains. Supply disruptions or sanctions can constrain sourcing of electrolyzer components and slow project timelines. Energy-security narratives help unlock public procurement and clean-fuel incentives, reinforced by the US IRA hydrogen credit up to $3/kg for low‑carbon hydrogen.

Trade policy and tariffs
Import duties on key inputs or finished systems alter cost structures and pricing, with tariffs up to 25% in some markets (2024–25) raising unit capex; rules of origin under FTAs (local content thresholds commonly 40–60%) materially change cross-border project economics; divergent certification regimes act as non-tariff barriers that add compliance costs and delays; strategic responses include regional manufacturing and vendor diversification.
- Tariffs up to 25% (2024–25)
- Rules of origin: 40–60% local content
- Certification divergence → extra compliance time/cost
- Mitigations: regional manufacturing, vendor diversification
Public procurement and infrastructure planning
Government-backed fleets and corridor fueling networks can catalyze early demand; US Bipartisan Infrastructure Law dedicated 7.5 billion USD for EV chargers, showing scale potential. Long planning and political cycles (often 3–7 years) introduce timing risk for deployment and revenue realization. Compliance with public tenders adds admin overhead but secures large contracts; partnerships with state utilities and transit agencies anchor reference projects and de-risk financing.
- Government grants: 7.5 billion USD (BIL) for EV charging
- Planning horizon: 3–7 years
- Procurement: higher admin, larger scale
- Partnerships: anchor reference projects, improve financing
Policy-driven hydrogen boom: EU 10Mt by 2030, US $8bn hubs, tariffs and local-content risk
National hydrogen targets (EU 10 Mt by 2030) and US funding (≈$8bn hubs; IRA credit up to $3/kg) drive demand and subsidies, while policy reversals and 3–7 year political cycles create timing risk. Tariffs (to 25% in 2024–25) and 40–60% local‑content rules force localization and capex shifts.
| Metric | Value |
|---|---|
| EU target | 10 Mt H2 by 2030 |
| US funding | $8bn hubs; IRA up to $3/kg |
| Tariffs | up to 25% (2024–25) |
| Local content | 40–60% |
What is included in the product
 Detailed Word Document
Explores how Political, Economic, Social, Technological, Environmental and Legal forces uniquely affect NEL, with data-backed trends and forward-looking insights tailored to its region and industry to help executives, investors and strategists spot risks, opportunities and actionable scenarios for decision-making.

 Customizable Excel Spreadsheet
Concise, visually segmented NEL PESTLE that distills external risks and opportunities into a ready-to-share summary, editable for region or business-line specifics to speed decision-making and align teams.
Economic factors

Power prices and offtake economics
Levelized cost of hydrogen (LCOH) is dominated by electricity—electrolysers need 50–55 kWh/kg so a 30 €/MWh power price implies ~1.5–1.65 €/kg electricity cost, making electricity ~60–70% of LCOH. Access to dedicated PPAs and ability to absorb curtailed renewable output raise load factors toward 70–90% and materially cut LCOH. Long‑term industrial offtake contracts (10–15 years) are central to bankability for multi‑MW electrolyser projects. Unhedged power markets with day‑ahead swings >100 €/MWh can quickly erode margins, so price hedges are essential.
Capital intensity and financing
Large upfront capex for electrolysis plants often ranges from $200m–$600m for 100–300 MW projects, requiring project finance and creditworthy offtakers. Higher interest rates (policy rates ~4.5–5.5% in 2024–25) have pushed WACCs up 1–3 p.p., delaying FIDs. Vendor financing and EPC partnerships can cover 10–30% of capex to unlock deals. Scale manufacturing and learning rates (costs fell to ~$350–500/kW by 2024) cut unit costs and improve margins over time.

Supply chain costs and inflation
Input costs for membranes, catalysts, steel and power electronics make up a large share of electrolyzer BOM—industry estimates commonly place these at roughly 40–60% of system cost, with catalysts often 10–20% of stack cost.
Inflation pass-through varies by contract: fixed-price, index-linked and escalation clauses determine timing; many European purchasers used CPI or commodity-indexation in 2023–24 to pass through 2–5% annual cost moves.
Dual-sourcing and long-term supplier agreements (typical terms 3–7 years) materially reduce spot volatility and secure capacity amid 6–18 month lead times.
Inventory strategy balances those lead times against working capital—market practice targets roughly 60–120 days of inventory to avoid production stops while capping carrying costs.

Market demand across sectors
- 95 Mt H2/yr (IEA 2023)
- EU 10 Mt renewable H2 by 2030
- US 45V credit up to $3/kg
- Clustering lowers delivered cost
- Diversification reduces cyclicality
FX exposure and global footprint
Revenues and costs for NEL span NOK, EUR, USD and multiple Asian currencies, so exchange-rate swings materially affect reported results and price-competitiveness in export markets. Regional sourcing and pricing create natural hedges that offset currency mismatches across production sites. For large export orders NEL routinely applies financial hedges to limit P&L volatility and protect margins.
- FX exposure: NOK/EUR/USD/Asian
- Natural hedging via regional sourcing
- Financial hedges for large orders
Policy-driven hydrogen boom: EU 10Mt by 2030, US $8bn hubs, tariffs and local-content risk
Electricity drives LCOH (50–55 kWh/kg) so 30 €/MWh => ~1.5–1.65 €/kg, ~60–70% of LCOH; high load factors (70–90%) via PPAs/capture cut costs. 100–300 MW projects cost $200–600m; electrolyser module costs ~$350–500/kW (2024). WACC up 1–3 p.p. with policy rates ~4.5–5.5% (2024–25); long‑term offtakes and hedges are essential.
| Metric | Value |
|---|---|
| Power price (example) | 30 €/MWh (2024) |
| Electricity per kg | 50–55 kWh/kg |
| Capex 100–300MW | $200–600m |
| Electrolyser cost | $350–500/kW (2024) |
| Policy rates | ~4.5–5.5% (2024–25) |
Preview Before You Purchase
NEL PESTLE Analysis
The preview shown here is the exact NEL PESTLE Analysis document you’ll receive after purchase—fully formatted and ready to use. It includes political, economic, social, technological, legal and environmental assessments tailored to NEL, with clear headings and actionable insights. No placeholders or teasers—this is the final file available for immediate download.

Product Information
Product Information
Shipping & Returns
Shipping & Returns
Description
Your Shortcut to Market Insight Starts Here
Unlock how macro forces—from regulations and subsidies to supply-chain shifts and green-tech advances—are shaping NEL's prospects in the hydrogen market. Our PESTLE highlights risks and opportunities investors and strategists need now. Purchase the full, editable analysis to get data-driven insights and actionable recommendations instantly.
Political factors
Hydrogen policy support
National hydrogen strategies dictate deployment pace and funding access for projects Nel targets, with the EU aiming for 10 million tonnes of renewable hydrogen by 2030. Stable multi-year incentives de-risk customer investments in electrolyzers and fueling, while the US Bipartisan Infrastructure Law committed about $8 billion to regional hydrogen hubs. Policy volatility or reversals can stall orders and strain backlogs, so monitoring EU, US and Asian policy pipelines is critical for forecasting.
Subsidies and public funding
Grants, tax credits and CfDs materially boost green hydrogen project IRRs—US 45V PTC offers up to $3/kg for low‑carbon H2 and EU IPCEI mobilised about €5.4bn, shifting payback favorably; eligibility rules push choices toward PEM or alkaline and local content requirements drive localization; tight competitive tender timetables reduce order visibility and delay revenue recognition; auction‑style procurement often compresses margins via aggressive price competition.
Geopolitics and energy security
Governments prioritize domestic hydrogen to reduce fuel import dependence, with the EU targeting 10 million tonnes of renewable hydrogen by 2030. Localization mandates and friend-shoring shape where Nel builds and sells, raising barriers for long cross-border supply chains. Supply disruptions or sanctions can constrain sourcing of electrolyzer components and slow project timelines. Energy-security narratives help unlock public procurement and clean-fuel incentives, reinforced by the US IRA hydrogen credit up to $3/kg for low‑carbon hydrogen.
Trade policy and tariffs
Import duties on key inputs or finished systems alter cost structures and pricing, with tariffs up to 25% in some markets (2024–25) raising unit capex; rules of origin under FTAs (local content thresholds commonly 40–60%) materially change cross-border project economics; divergent certification regimes act as non-tariff barriers that add compliance costs and delays; strategic responses include regional manufacturing and vendor diversification.
- Tariffs up to 25% (2024–25)
- Rules of origin: 40–60% local content
- Certification divergence → extra compliance time/cost
- Mitigations: regional manufacturing, vendor diversification
Public procurement and infrastructure planning
Government-backed fleets and corridor fueling networks can catalyze early demand; US Bipartisan Infrastructure Law dedicated 7.5 billion USD for EV chargers, showing scale potential. Long planning and political cycles (often 3–7 years) introduce timing risk for deployment and revenue realization. Compliance with public tenders adds admin overhead but secures large contracts; partnerships with state utilities and transit agencies anchor reference projects and de-risk financing.
- Government grants: 7.5 billion USD (BIL) for EV charging
- Planning horizon: 3–7 years
- Procurement: higher admin, larger scale
- Partnerships: anchor reference projects, improve financing
Policy-driven hydrogen boom: EU 10Mt by 2030, US $8bn hubs, tariffs and local-content risk
National hydrogen targets (EU 10 Mt by 2030) and US funding (≈$8bn hubs; IRA credit up to $3/kg) drive demand and subsidies, while policy reversals and 3–7 year political cycles create timing risk. Tariffs (to 25% in 2024–25) and 40–60% local‑content rules force localization and capex shifts.
| Metric | Value |
|---|---|
| EU target | 10 Mt H2 by 2030 |
| US funding | $8bn hubs; IRA up to $3/kg |
| Tariffs | up to 25% (2024–25) |
| Local content | 40–60% |
What is included in the product
Detailed Word Document
Explores how Political, Economic, Social, Technological, Environmental and Legal forces uniquely affect NEL, with data-backed trends and forward-looking insights tailored to its region and industry to help executives, investors and strategists spot risks, opportunities and actionable scenarios for decision-making.
Customizable Excel Spreadsheet
Concise, visually segmented NEL PESTLE that distills external risks and opportunities into a ready-to-share summary, editable for region or business-line specifics to speed decision-making and align teams.
Economic factors
Power prices and offtake economics
Levelized cost of hydrogen (LCOH) is dominated by electricity—electrolysers need 50–55 kWh/kg so a 30 €/MWh power price implies ~1.5–1.65 €/kg electricity cost, making electricity ~60–70% of LCOH. Access to dedicated PPAs and ability to absorb curtailed renewable output raise load factors toward 70–90% and materially cut LCOH. Long‑term industrial offtake contracts (10–15 years) are central to bankability for multi‑MW electrolyser projects. Unhedged power markets with day‑ahead swings >100 €/MWh can quickly erode margins, so price hedges are essential.
Capital intensity and financing
Large upfront capex for electrolysis plants often ranges from $200m–$600m for 100–300 MW projects, requiring project finance and creditworthy offtakers. Higher interest rates (policy rates ~4.5–5.5% in 2024–25) have pushed WACCs up 1–3 p.p., delaying FIDs. Vendor financing and EPC partnerships can cover 10–30% of capex to unlock deals. Scale manufacturing and learning rates (costs fell to ~$350–500/kW by 2024) cut unit costs and improve margins over time.
Supply chain costs and inflation
Input costs for membranes, catalysts, steel and power electronics make up a large share of electrolyzer BOM—industry estimates commonly place these at roughly 40–60% of system cost, with catalysts often 10–20% of stack cost.
Inflation pass-through varies by contract: fixed-price, index-linked and escalation clauses determine timing; many European purchasers used CPI or commodity-indexation in 2023–24 to pass through 2–5% annual cost moves.
Dual-sourcing and long-term supplier agreements (typical terms 3–7 years) materially reduce spot volatility and secure capacity amid 6–18 month lead times.
Inventory strategy balances those lead times against working capital—market practice targets roughly 60–120 days of inventory to avoid production stops while capping carrying costs.
Market demand across sectors
- 95 Mt H2/yr (IEA 2023)
- EU 10 Mt renewable H2 by 2030
- US 45V credit up to $3/kg
- Clustering lowers delivered cost
- Diversification reduces cyclicality
FX exposure and global footprint
Revenues and costs for NEL span NOK, EUR, USD and multiple Asian currencies, so exchange-rate swings materially affect reported results and price-competitiveness in export markets. Regional sourcing and pricing create natural hedges that offset currency mismatches across production sites. For large export orders NEL routinely applies financial hedges to limit P&L volatility and protect margins.
- FX exposure: NOK/EUR/USD/Asian
- Natural hedging via regional sourcing
- Financial hedges for large orders
Policy-driven hydrogen boom: EU 10Mt by 2030, US $8bn hubs, tariffs and local-content risk
Electricity drives LCOH (50–55 kWh/kg) so 30 €/MWh => ~1.5–1.65 €/kg, ~60–70% of LCOH; high load factors (70–90%) via PPAs/capture cut costs. 100–300 MW projects cost $200–600m; electrolyser module costs ~$350–500/kW (2024). WACC up 1–3 p.p. with policy rates ~4.5–5.5% (2024–25); long‑term offtakes and hedges are essential.
| Metric | Value |
|---|---|
| Power price (example) | 30 €/MWh (2024) |
| Electricity per kg | 50–55 kWh/kg |
| Capex 100–300MW | $200–600m |
| Electrolyser cost | $350–500/kW (2024) |
| Policy rates | ~4.5–5.5% (2024–25) |
Preview Before You Purchase
NEL PESTLE Analysis
The preview shown here is the exact NEL PESTLE Analysis document you’ll receive after purchase—fully formatted and ready to use. It includes political, economic, social, technological, legal and environmental assessments tailored to NEL, with clear headings and actionable insights. No placeholders or teasers—this is the final file available for immediate download.











