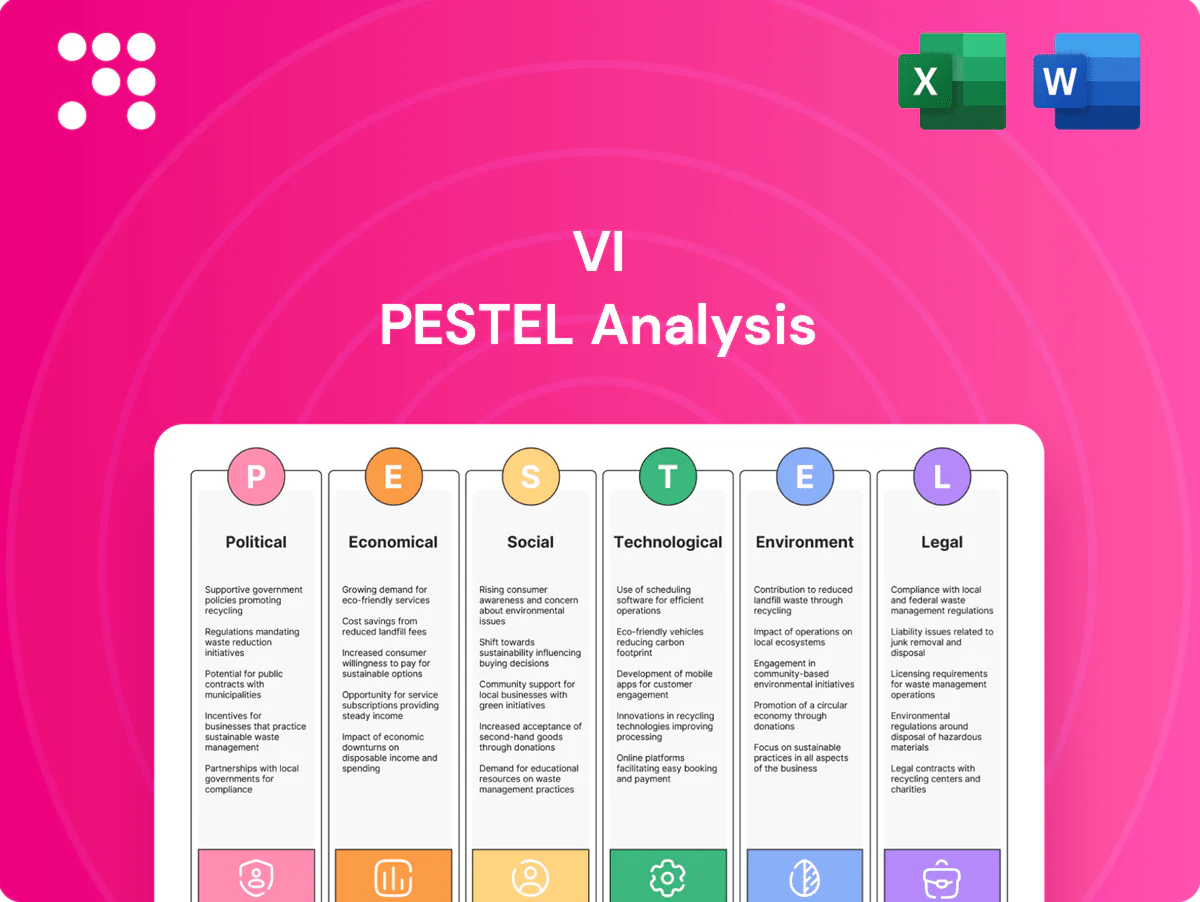
VI PESTLE Analysis

Skip the Research. Get the Strategy.
Unlock how political, economic, social, technological, legal and environmental forces are reshaping VI’s outlook. Our concise PESTLE pinpoints the key risks and growth levers investors and strategists need. Purchase the full analysis to access detailed, actionable intelligence now.
Political factors

Spectrum policy & auctions
Government spectrum pricing, payment terms and renewal rules directly shape Vi’s capex and rollout timing, with India's 2022 spectrum auction raising about Rs 77,815 crore and setting high benchmarks for reserve pricing. Longer moratoriums and favorable auction design ease cash-flow strain and support phased 5G investment, while high reserve prices or fragmented holdings delay rollouts. Clear refarming and harmonization policies improve spectral efficiency and lower unit cost per MHz.
Telecom reforms & support
Reforms on AGR definition, moratoriums and options to convert dues to equity directly shape operator viability and capital structure. Production-linked incentives like the Rs 12,195 crore PLI for telecom gear and Rs 76,000 crore electronics PLI can lower network costs. Government digital public infrastructure (Aadhaar ~1.3 billion IDs) boosts subscriber and service demand. Delays or policy reversals increase sector uncertainty.

Public investments & BharatNet
Public rural broadband programs like BharatNet, which targets connecting over 250,000 gram panchayats, expand addressable markets but hinge on coordinated Right-of-Way approvals across states. Targeted subsidies for last-mile connections have been shown to lift household adoption rates materially, reducing upfront rollout costs by an estimated 30–40% in pilot projects. Partnerships with PSUs such as BSNL and RailTel accelerate fiberization, yet execution gaps and delays in ROW permissions can materially slow commercial benefits and ROI timelines.

Geopolitics & vendor choices
Restrictions on vendors (eg, Huawei added to the US Entity List in 2019 and expanded export controls on advanced chips in 2022–2023) force buyers to re-source equipment, often increasing procurement costs and compliance overhead. Diversifying to approved suppliers or building dual sourcing can raise near-term capex and integration costs. Geopolitical tensions lengthen lead times and disrupt logistics, while localization policies and onshoring requirements reduce foreign-vendor exposure.
- 2019 Entity List; 2022–23 chip controls
- US tariffs up to 25% raise import costs
- Localization/onshoring reduces vendor risk
State-level permits & RoW
Diverse state regulations drive variability in rollout speed and cost, with U.S. small-cell permitting governed by FCC shot clocks (60–90 days for collocations, 90–150 for new deployments). Simplified single-window clearances have halved approval times in many jurisdictions, accelerating 5G builds. High municipal fees and siting delays can add tens of thousands to site CAPEX; harmonized rules improve predictability.
- Regulatory variability: large impact on timelines
- Shot clocks: 60–150 days (FCC)
- Fees/delays: add tens of thousands per site
Spectrum AGR PLI shift telco capex; BharatNet/Aadhaar boost reach; vendor rules raise costs
Government spectrum pricing, auction design and AGR reforms (India 2022 auction Rs 77,815 crore) materially affect Vi’s capex timing and leverage; PLI schemes (telecom Rs 12,195 crore; electronics Rs 76,000 crore) lower network costs. BharatNet (250,000+ gram panchayats) and Aadhaar (≈1.3 bn IDs) expand markets; vendor restrictions (2019 Entity List; 2022–23 chip controls) raise procurement costs and lead times.
| Factor | Key metric |
|---|---|
| Spectrum auction | Rs 77,815 cr (2022) |
| PLI | Rs 12,195 cr / Rs 76,000 cr |
| BharatNet | 250,000+ panchayats |
| Aadhaar | ≈1.3 bn IDs |
| Vendor controls | 2019 Entity List; 2022–23 chip rules |
What is included in the product
 Detailed Word Document
Explores how macro-environmental factors affect the VI across Political, Economic, Social, Technological, Environmental and Legal dimensions, with data-backed trends and forward-looking insights to identify risks and opportunities for executives, investors, and entrepreneurs; formatted for direct insertion into plans, decks, or reports.

 Customizable Excel Spreadsheet
VI PESTLE Analysis condenses external factors into a clean, visually segmented summary for quick interpretation and sharing across teams or presentations, with editable notes to tailor insights to your region, business line, or client reports.
Economic factors

ARPU & pricing power
Sustainable tariff hikes are critical to fund 5G buildouts as operators typically allocate 15–20% of revenue to CapEx; US postpaid ARPU averaged about USD 65–70 in 2024, underpinning cash generation. Intense competition in saturated markets caps pricing headroom, while bundled digital services (video, cloud, fintech) can lift ARPU mix by 5–15%. Macroeconomic stress and real wage declines weaken price elasticity and churn tolerance.
Capex intensity & funding
5G spectrum purchases (US C‑band raised $81bn in 2021), radios and accelerated fiberization drive heavy multiyear capex, with global telecom capex running around $240–260bn annually in recent years. Access to debt and equity at reasonable cost determines rollout pace; vendor financing and network‑sharing deals (mast sharing, MVNO/JV models) materially reduce cash needs. Tight balance sheets can delay coverage expansion and slow 5G/fiber targets.

Macrogrowth & data demand
IMF WEO 2024 GDP growth of 3.1% fuels formalization and MSME digitization, expanding enterprise data needs. GSMA reports 5.4 billion mobile internet users in 2024; remote work and OTT (streaming revenue >$100B in 2024) sustain high consumption. Slowdowns often defer upgrades to premium plans, while urban incomes—typically 2–3x rural—directly shape segment and pricing strategy.

Inflation & FX exposure
Imported equipment exposes VI to currency volatility as INR moves against USD; RBI inflation target is 4% ±2% and CPI averaged ~5.7% in FY2023-24, raising energy, tower rentals and wage costs and compressing margins.
- Hedge: manage FX mismatch via forwards
- Local sourcing: reduce import share to limit pass-through
- Pricing: persistent inflation forces tariff review to protect ARPU
Industry structure & consolidation
A stable three-player market supports rational pricing, with American Tower reporting ~221,000 sites at end-2024 while Crown Castle and SBA Communications report roughly 40,000 and 33,000 towers respectively, concentrating pricing power. Any disruptive entry or distressed exit can quickly shift share dynamics and vacancy rates. Tower and fiber consolidation has tightened lease-rate negotiation; recent M&A and JV activity often seeks synergies but can provoke competitive retaliation.
- Market concentration: top players hold majority of sites (2024)
- Disruption risk: entries/exits change share quickly
- Lease impact: consolidation raises bargaining power
- M&A: potential synergies vs. retaliation
Spectrum AGR PLI shift telco capex; BharatNet/Aadhaar boost reach; vendor rules raise costs
Sustainable tariff hikes needed as operators spend 15–20% revenue on CapEx; US postpaid ARPU USD65–70 (2024) supports cashflow. Global telecom capex ~USD240–260bn p.a.; C‑band 2021 sale USD81bn. IMF WEO 2024 GDP growth 3.1% and CPI ~5.7% (FY23‑24) shape demand and cost pass‑through; FX risk from INR/USD affects imported gear costs.
| Metric | Value (2024) |
|---|---|
| Postpaid ARPU (US) | USD65–70 |
| Global telecom CapEx | USD240–260bn |
| IMF GDP growth | 3.1% |
| CPI India | ~5.7% |
What You See Is What You Get
VI PESTLE Analysis
The preview shown is the exact VI PESTLE Analysis document you’ll receive after purchase—fully formatted, professionally structured, and ready to use. No placeholders or teasers; the content and layout match the downloadable file. After checkout you’ll instantly get this same final document.

Original: $10.00
-65%$10.00
$3.50Product Information
Product Information
Shipping & Returns
Shipping & Returns
Description
Skip the Research. Get the Strategy.
Unlock how political, economic, social, technological, legal and environmental forces are reshaping VI’s outlook. Our concise PESTLE pinpoints the key risks and growth levers investors and strategists need. Purchase the full analysis to access detailed, actionable intelligence now.
Political factors
Spectrum policy & auctions
Government spectrum pricing, payment terms and renewal rules directly shape Vi’s capex and rollout timing, with India's 2022 spectrum auction raising about Rs 77,815 crore and setting high benchmarks for reserve pricing. Longer moratoriums and favorable auction design ease cash-flow strain and support phased 5G investment, while high reserve prices or fragmented holdings delay rollouts. Clear refarming and harmonization policies improve spectral efficiency and lower unit cost per MHz.
Telecom reforms & support
Reforms on AGR definition, moratoriums and options to convert dues to equity directly shape operator viability and capital structure. Production-linked incentives like the Rs 12,195 crore PLI for telecom gear and Rs 76,000 crore electronics PLI can lower network costs. Government digital public infrastructure (Aadhaar ~1.3 billion IDs) boosts subscriber and service demand. Delays or policy reversals increase sector uncertainty.
Public investments & BharatNet
Public rural broadband programs like BharatNet, which targets connecting over 250,000 gram panchayats, expand addressable markets but hinge on coordinated Right-of-Way approvals across states. Targeted subsidies for last-mile connections have been shown to lift household adoption rates materially, reducing upfront rollout costs by an estimated 30–40% in pilot projects. Partnerships with PSUs such as BSNL and RailTel accelerate fiberization, yet execution gaps and delays in ROW permissions can materially slow commercial benefits and ROI timelines.
Geopolitics & vendor choices
Restrictions on vendors (eg, Huawei added to the US Entity List in 2019 and expanded export controls on advanced chips in 2022–2023) force buyers to re-source equipment, often increasing procurement costs and compliance overhead. Diversifying to approved suppliers or building dual sourcing can raise near-term capex and integration costs. Geopolitical tensions lengthen lead times and disrupt logistics, while localization policies and onshoring requirements reduce foreign-vendor exposure.
- 2019 Entity List; 2022–23 chip controls
- US tariffs up to 25% raise import costs
- Localization/onshoring reduces vendor risk
State-level permits & RoW
Diverse state regulations drive variability in rollout speed and cost, with U.S. small-cell permitting governed by FCC shot clocks (60–90 days for collocations, 90–150 for new deployments). Simplified single-window clearances have halved approval times in many jurisdictions, accelerating 5G builds. High municipal fees and siting delays can add tens of thousands to site CAPEX; harmonized rules improve predictability.
- Regulatory variability: large impact on timelines
- Shot clocks: 60–150 days (FCC)
- Fees/delays: add tens of thousands per site
Spectrum AGR PLI shift telco capex; BharatNet/Aadhaar boost reach; vendor rules raise costs
Government spectrum pricing, auction design and AGR reforms (India 2022 auction Rs 77,815 crore) materially affect Vi’s capex timing and leverage; PLI schemes (telecom Rs 12,195 crore; electronics Rs 76,000 crore) lower network costs. BharatNet (250,000+ gram panchayats) and Aadhaar (≈1.3 bn IDs) expand markets; vendor restrictions (2019 Entity List; 2022–23 chip controls) raise procurement costs and lead times.
| Factor | Key metric |
|---|---|
| Spectrum auction | Rs 77,815 cr (2022) |
| PLI | Rs 12,195 cr / Rs 76,000 cr |
| BharatNet | 250,000+ panchayats |
| Aadhaar | ≈1.3 bn IDs |
| Vendor controls | 2019 Entity List; 2022–23 chip rules |
What is included in the product
Detailed Word Document
Explores how macro-environmental factors affect the VI across Political, Economic, Social, Technological, Environmental and Legal dimensions, with data-backed trends and forward-looking insights to identify risks and opportunities for executives, investors, and entrepreneurs; formatted for direct insertion into plans, decks, or reports.
Customizable Excel Spreadsheet
VI PESTLE Analysis condenses external factors into a clean, visually segmented summary for quick interpretation and sharing across teams or presentations, with editable notes to tailor insights to your region, business line, or client reports.
Economic factors
ARPU & pricing power
Sustainable tariff hikes are critical to fund 5G buildouts as operators typically allocate 15–20% of revenue to CapEx; US postpaid ARPU averaged about USD 65–70 in 2024, underpinning cash generation. Intense competition in saturated markets caps pricing headroom, while bundled digital services (video, cloud, fintech) can lift ARPU mix by 5–15%. Macroeconomic stress and real wage declines weaken price elasticity and churn tolerance.
Capex intensity & funding
5G spectrum purchases (US C‑band raised $81bn in 2021), radios and accelerated fiberization drive heavy multiyear capex, with global telecom capex running around $240–260bn annually in recent years. Access to debt and equity at reasonable cost determines rollout pace; vendor financing and network‑sharing deals (mast sharing, MVNO/JV models) materially reduce cash needs. Tight balance sheets can delay coverage expansion and slow 5G/fiber targets.
Macrogrowth & data demand
IMF WEO 2024 GDP growth of 3.1% fuels formalization and MSME digitization, expanding enterprise data needs. GSMA reports 5.4 billion mobile internet users in 2024; remote work and OTT (streaming revenue >$100B in 2024) sustain high consumption. Slowdowns often defer upgrades to premium plans, while urban incomes—typically 2–3x rural—directly shape segment and pricing strategy.
Inflation & FX exposure
Imported equipment exposes VI to currency volatility as INR moves against USD; RBI inflation target is 4% ±2% and CPI averaged ~5.7% in FY2023-24, raising energy, tower rentals and wage costs and compressing margins.
- Hedge: manage FX mismatch via forwards
- Local sourcing: reduce import share to limit pass-through
- Pricing: persistent inflation forces tariff review to protect ARPU
Industry structure & consolidation
A stable three-player market supports rational pricing, with American Tower reporting ~221,000 sites at end-2024 while Crown Castle and SBA Communications report roughly 40,000 and 33,000 towers respectively, concentrating pricing power. Any disruptive entry or distressed exit can quickly shift share dynamics and vacancy rates. Tower and fiber consolidation has tightened lease-rate negotiation; recent M&A and JV activity often seeks synergies but can provoke competitive retaliation.
- Market concentration: top players hold majority of sites (2024)
- Disruption risk: entries/exits change share quickly
- Lease impact: consolidation raises bargaining power
- M&A: potential synergies vs. retaliation
Spectrum AGR PLI shift telco capex; BharatNet/Aadhaar boost reach; vendor rules raise costs
Sustainable tariff hikes needed as operators spend 15–20% revenue on CapEx; US postpaid ARPU USD65–70 (2024) supports cashflow. Global telecom capex ~USD240–260bn p.a.; C‑band 2021 sale USD81bn. IMF WEO 2024 GDP growth 3.1% and CPI ~5.7% (FY23‑24) shape demand and cost pass‑through; FX risk from INR/USD affects imported gear costs.
| Metric | Value (2024) |
|---|---|
| Postpaid ARPU (US) | USD65–70 |
| Global telecom CapEx | USD240–260bn |
| IMF GDP growth | 3.1% |
| CPI India | ~5.7% |
What You See Is What You Get
VI PESTLE Analysis
The preview shown is the exact VI PESTLE Analysis document you’ll receive after purchase—fully formatted, professionally structured, and ready to use. No placeholders or teasers; the content and layout match the downloadable file. After checkout you’ll instantly get this same final document.











