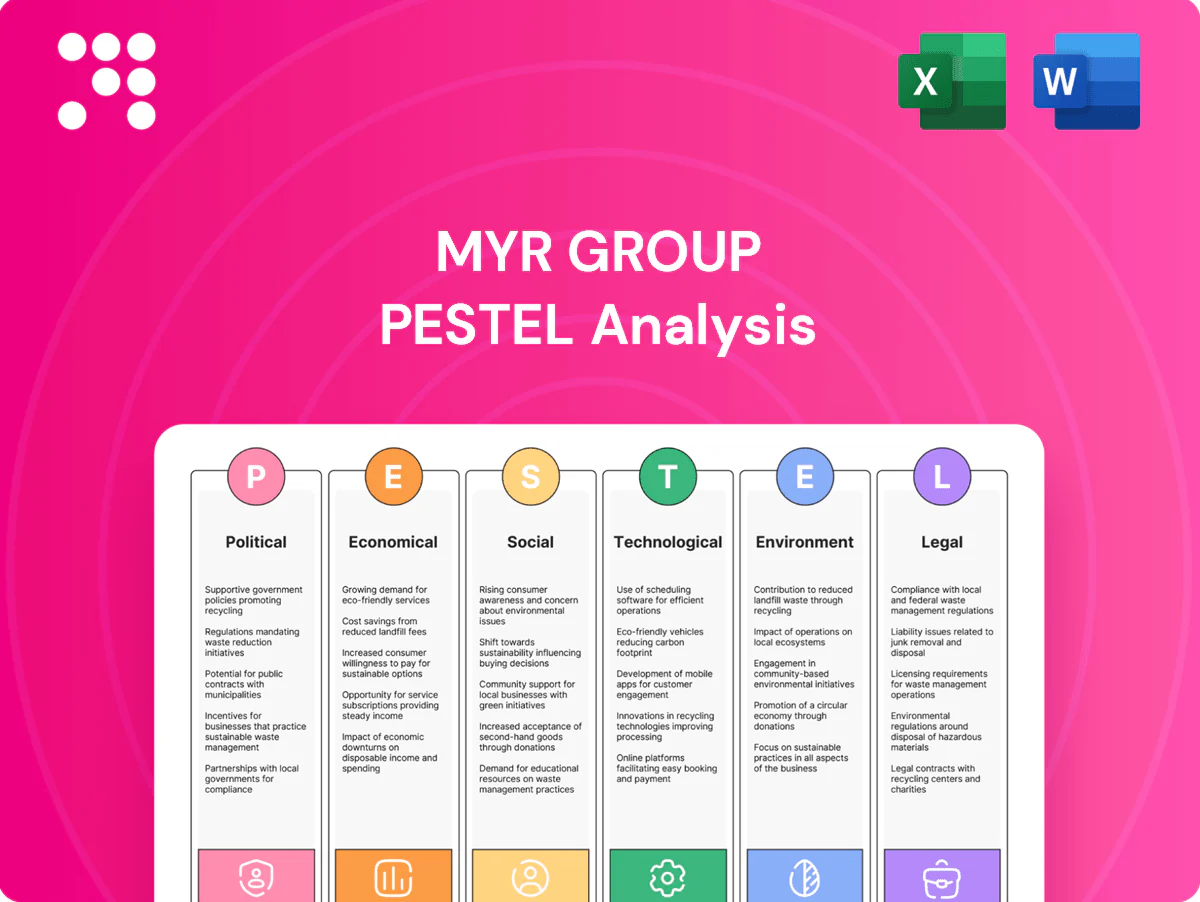
MYR Group PESTLE Analysis

Plan Smarter. Present Sharper. Compete Stronger.
Gain a strategic advantage with our PESTLE Analysis of MYR Group — uncover political, economic, social, technological, legal and environmental forces shaping its future. Ideal for investors and strategists, this ready-made report is fully editable and actionable. Purchase the full version now to access detailed insights and forecasts.
Political factors

Federal infrastructure funding
Shifts in federal budgets and infrastructure bills directly influence the utility capex pipelines MYR bids on. The Bipartisan Infrastructure Law (IIJA) committed $1.2 trillion total, including $550 billion in new federal investments, improving multi-year backlog visibility for contractors. Funding delays push starts to the right, election cycles shift timing and priorities across transmission and resiliency programs, and maintaining eligibility for federally funded projects is strategically critical.
State energy policies
Public utility commission directives and state RPS targets (30 states plus DC) drive grid expansion and substation upgrades, boosting T&D demand. Variability across states alters bid volume, compresses margins in competitive markets and shifts project mix toward resilience work. Governors prioritizing reliability and wildfire mitigation increase targeted T&D workloads. Regional politics complicate right-of-way coordination and interconnection queues now exceeding 1,200 GW.

Permitting and siting reform
NEPA reviews, where a final EIS averages about 3 years per GAO, and state siting boards often add additional months to years of delay and cost for transmission builds.
Policy moves to streamline permitting—such as recent federal efforts to expedite reviews—could accelerate MYR Group’s revenue conversion by shortening project ramp-up timelines.
Conversely, heightened land‑use or tribal consultation scrutiny can extend timelines, and federal/state political will ultimately determines approval cadence.

Trade and tariff dynamics
Tariffs such as the US Section 232 levies—25% on steel and 10% on aluminum—raise MYR Group project input costs and can erode bid competitiveness; Section 301 China tariffs of up to 25% on electrical equipment remain relevant to 2024–25 procurement pricing.
Import policies for transformers and switchgear drive lead times (typical transformer lead times 20–40 weeks) and procurement risk, while geopolitical tensions (US–China trade tensions, 2023–24) have previously disrupted component flows; MYR must model tariff scenarios in pricing and contingency planning.
- Tariffs: 25% steel, 10% aluminum
- Transformer lead times: 20–40 weeks
- China tariffs: Section 301 up to 25%
- Action: embed tariff scenarios in bids and contingencies
Labor and union relations
Prevailing wage rules such as Davis-Bacon on federal work and project labor agreements influenced by political leadership raise labor costs but underpin safety and retention; IIJA’s $1.2 trillion pipeline increases exposure to these mandates. Pro-labor policies and apprenticeship expansions help stability amid a 2024 AGC finding that 86% of contractors report hiring difficulties; immigration limits further tighten crew availability. Local official engagement eases permitting and workforce expectations.
- Davis-Bacon/PLAs increase costs but improve safety
- IIJA $1.2T expands covered projects
- 86% of contractors reported 2024 hiring challenges (AGC)
- Immigration/apprenticeship policy affects crew supply
IIJA $550B boosts multi-year T&D pipelines; NEPA ~3-year delays, tariffs raise costs
Federal funding (IIJA $1.2T; $550B new) boosts multi-year T&D pipelines but election cycles and permitting cadence (NEPA ~3 years) shift starts and margins. State RPS, PUC mandates and >1,200 GW interconnection queue drive regional bid mix and resilience work. Tariffs (steel 25%, aluminum 10%, Section 301 up to 25%) plus 20–40 week transformer lead times raise input costs and procurement risk.
| Factor | Key metric |
|---|---|
| IIJA | $1.2T total; $550B new |
| NEPA delay | ~3 years (GAO) |
| Interconnection | >1,200 GW queue |
| Tariffs & lead times | Steel 25%; Al 10%; transformers 20–40 wks |
What is included in the product
 Detailed Word Document
Explores how Political, Economic, Social, Technological, Environmental, and Legal factors uniquely affect MYR Group, with data-driven, region- and industry-specific insights to identify risks and opportunities for executives, investors, and strategists, and includes forward-looking implications ready for reports and decks.

 Customizable Excel Spreadsheet
A concise, visually segmented PESTLE summary of MYR Group that’s easily shareable and drop‑in ready for presentations, helping teams quickly align on external risks, regulatory and market drivers, and actionable priorities during planning sessions.
Economic factors

Utility capex cycles
Transmission, distribution and substation capex plans from IOUs and munis underpin MYR Group revenue visibility, with lifecycle contracts tied to multi-year T&D budgets. Grid modernization, reliability programs and wildfire hardening drive sustained spend; EEI reported IOU electric capex near $95 billion in 2023. Any pullback or deferral reduces backlog burn and utilization, while geographic and client diversification smooths project cyclicality.
Interest rates and financing
Higher policy rates near 5.25–5.50% in mid-2025 lift utilities’ WACC, tightening IRR thresholds and slowing approvals/timing for capital-intensive T&D projects; MYR may see C&I customers delay expansions as bank lending standards tighten and commercial loan spreads widen. A resilient Treasury market with 10-year yields around 4.2–4.5% supports financing for large T&D programs, while active hedging and disciplined bidding mitigate rising cost-of-capital pressure on margins.

Input cost volatility
Copper, aluminum and steel prices have shown high volatility, with commodity swings and tariff-driven moves causing up to ~25% annual variation; transformer pricing and long lead times (industry-reported 30–52 weeks) amplify scheduling and margin risk. Escalation clauses and hedging programs are essential to protect margins, while supplier diversification and early procurement materially reduce exposure.

Labor availability and wages
Skilled linemen and high-voltage technicians remain scarce, elevating wages and operational costs for MYR; BLS data (May 2023) shows median annual pay for electrical power-line installers and repairers at 79,230, highlighting labor-driven margin pressure. Tight labor markets can constrain growth and compress margins via higher overtime and bid premiums. Training pipelines and retention programs reduce churn and overtime reliance, while geographic crew mobility forces more selective, higher-cost bidding.
- Scarcity: raises hiring difficulty and bid risk
- Wage pressure: BLS median 79,230 (May 2023)
- Mitigation: training/retention cut overtime costs
- Mobility: increases selective bids and travel expenses
Macro demand in C&I
Industrial reshoring plus booming data center and EV manufacturing projects are lifting electrical C&I demand; announced U.S. EV/battery investments surpassed $100B by 2024. Recessions or sector slowdowns compress discretionary C&I work while MYR’s roughly 60/40 utility-to-C&I mix (FY2024 revenue) cushions volatility and regional health drives backlog quality and pricing power.
- Reshoring: stronger industrial starts
- Data centers: continued colocations demand
- EVs/batteries: >$100B announced investments by 2024
- MYR mix: ~60/40 utility/C&I buffers risk
IIJA $550B boosts multi-year T&D pipelines; NEPA ~3-year delays, tariffs raise costs
IOU/muni T&D capex (EEI ~$95B 2023) and multi-year grid programs underpin MYR backlog, while higher policy rates (5.25–5.50% mid-2025) and 10yr yields ~4.3% tighten WACC and slow approvals. Commodity swings (~±25% annual) and 30–52 week transformer lead times stress margins; skilled labor scarcity (BLS median $79,230 May 2023) raises costs. MYR’s ~60/40 utility/C&I mix and >$100B announced EV/battery investments (2024) buffer cyclicality.
| Metric | Value |
|---|---|
| IOU electric capex | $95B (2023) |
| Policy rate | 5.25–5.50% (mid-2025) |
| 10yr Treasury | ~4.3% |
| Commodity volatility | ~25% |
| Transformer lead | 30–52 weeks |
| Labor median pay | $79,230 (May 2023) |
| EV/battery investments | >$100B (2024) |
| Revenue mix | ~60/40 utility/C&I (FY2024) |
Preview the Actual Deliverable
MYR Group PESTLE Analysis
The MYR Group PESTLE Analysis preview shown here is the exact, fully formatted document you’ll receive after purchase, offering political, economic, social, technological, legal, and environmental insights tailored to MYR Group. This is the real file—no placeholders or teasers. You’ll be able to download this finished document immediately after payment.

Product Information
Product Information
Shipping & Returns
Shipping & Returns
Description
Plan Smarter. Present Sharper. Compete Stronger.
Gain a strategic advantage with our PESTLE Analysis of MYR Group — uncover political, economic, social, technological, legal and environmental forces shaping its future. Ideal for investors and strategists, this ready-made report is fully editable and actionable. Purchase the full version now to access detailed insights and forecasts.
Political factors
Federal infrastructure funding
Shifts in federal budgets and infrastructure bills directly influence the utility capex pipelines MYR bids on. The Bipartisan Infrastructure Law (IIJA) committed $1.2 trillion total, including $550 billion in new federal investments, improving multi-year backlog visibility for contractors. Funding delays push starts to the right, election cycles shift timing and priorities across transmission and resiliency programs, and maintaining eligibility for federally funded projects is strategically critical.
State energy policies
Public utility commission directives and state RPS targets (30 states plus DC) drive grid expansion and substation upgrades, boosting T&D demand. Variability across states alters bid volume, compresses margins in competitive markets and shifts project mix toward resilience work. Governors prioritizing reliability and wildfire mitigation increase targeted T&D workloads. Regional politics complicate right-of-way coordination and interconnection queues now exceeding 1,200 GW.
Permitting and siting reform
NEPA reviews, where a final EIS averages about 3 years per GAO, and state siting boards often add additional months to years of delay and cost for transmission builds.
Policy moves to streamline permitting—such as recent federal efforts to expedite reviews—could accelerate MYR Group’s revenue conversion by shortening project ramp-up timelines.
Conversely, heightened land‑use or tribal consultation scrutiny can extend timelines, and federal/state political will ultimately determines approval cadence.
Trade and tariff dynamics
Tariffs such as the US Section 232 levies—25% on steel and 10% on aluminum—raise MYR Group project input costs and can erode bid competitiveness; Section 301 China tariffs of up to 25% on electrical equipment remain relevant to 2024–25 procurement pricing.
Import policies for transformers and switchgear drive lead times (typical transformer lead times 20–40 weeks) and procurement risk, while geopolitical tensions (US–China trade tensions, 2023–24) have previously disrupted component flows; MYR must model tariff scenarios in pricing and contingency planning.
- Tariffs: 25% steel, 10% aluminum
- Transformer lead times: 20–40 weeks
- China tariffs: Section 301 up to 25%
- Action: embed tariff scenarios in bids and contingencies
Labor and union relations
Prevailing wage rules such as Davis-Bacon on federal work and project labor agreements influenced by political leadership raise labor costs but underpin safety and retention; IIJA’s $1.2 trillion pipeline increases exposure to these mandates. Pro-labor policies and apprenticeship expansions help stability amid a 2024 AGC finding that 86% of contractors report hiring difficulties; immigration limits further tighten crew availability. Local official engagement eases permitting and workforce expectations.
- Davis-Bacon/PLAs increase costs but improve safety
- IIJA $1.2T expands covered projects
- 86% of contractors reported 2024 hiring challenges (AGC)
- Immigration/apprenticeship policy affects crew supply
IIJA $550B boosts multi-year T&D pipelines; NEPA ~3-year delays, tariffs raise costs
Federal funding (IIJA $1.2T; $550B new) boosts multi-year T&D pipelines but election cycles and permitting cadence (NEPA ~3 years) shift starts and margins. State RPS, PUC mandates and >1,200 GW interconnection queue drive regional bid mix and resilience work. Tariffs (steel 25%, aluminum 10%, Section 301 up to 25%) plus 20–40 week transformer lead times raise input costs and procurement risk.
| Factor | Key metric |
|---|---|
| IIJA | $1.2T total; $550B new |
| NEPA delay | ~3 years (GAO) |
| Interconnection | >1,200 GW queue |
| Tariffs & lead times | Steel 25%; Al 10%; transformers 20–40 wks |
What is included in the product
Detailed Word Document
Explores how Political, Economic, Social, Technological, Environmental, and Legal factors uniquely affect MYR Group, with data-driven, region- and industry-specific insights to identify risks and opportunities for executives, investors, and strategists, and includes forward-looking implications ready for reports and decks.
Customizable Excel Spreadsheet
A concise, visually segmented PESTLE summary of MYR Group that’s easily shareable and drop‑in ready for presentations, helping teams quickly align on external risks, regulatory and market drivers, and actionable priorities during planning sessions.
Economic factors
Utility capex cycles
Transmission, distribution and substation capex plans from IOUs and munis underpin MYR Group revenue visibility, with lifecycle contracts tied to multi-year T&D budgets. Grid modernization, reliability programs and wildfire hardening drive sustained spend; EEI reported IOU electric capex near $95 billion in 2023. Any pullback or deferral reduces backlog burn and utilization, while geographic and client diversification smooths project cyclicality.
Interest rates and financing
Higher policy rates near 5.25–5.50% in mid-2025 lift utilities’ WACC, tightening IRR thresholds and slowing approvals/timing for capital-intensive T&D projects; MYR may see C&I customers delay expansions as bank lending standards tighten and commercial loan spreads widen. A resilient Treasury market with 10-year yields around 4.2–4.5% supports financing for large T&D programs, while active hedging and disciplined bidding mitigate rising cost-of-capital pressure on margins.
Input cost volatility
Copper, aluminum and steel prices have shown high volatility, with commodity swings and tariff-driven moves causing up to ~25% annual variation; transformer pricing and long lead times (industry-reported 30–52 weeks) amplify scheduling and margin risk. Escalation clauses and hedging programs are essential to protect margins, while supplier diversification and early procurement materially reduce exposure.
Labor availability and wages
Skilled linemen and high-voltage technicians remain scarce, elevating wages and operational costs for MYR; BLS data (May 2023) shows median annual pay for electrical power-line installers and repairers at 79,230, highlighting labor-driven margin pressure. Tight labor markets can constrain growth and compress margins via higher overtime and bid premiums. Training pipelines and retention programs reduce churn and overtime reliance, while geographic crew mobility forces more selective, higher-cost bidding.
- Scarcity: raises hiring difficulty and bid risk
- Wage pressure: BLS median 79,230 (May 2023)
- Mitigation: training/retention cut overtime costs
- Mobility: increases selective bids and travel expenses
Macro demand in C&I
Industrial reshoring plus booming data center and EV manufacturing projects are lifting electrical C&I demand; announced U.S. EV/battery investments surpassed $100B by 2024. Recessions or sector slowdowns compress discretionary C&I work while MYR’s roughly 60/40 utility-to-C&I mix (FY2024 revenue) cushions volatility and regional health drives backlog quality and pricing power.
- Reshoring: stronger industrial starts
- Data centers: continued colocations demand
- EVs/batteries: >$100B announced investments by 2024
- MYR mix: ~60/40 utility/C&I buffers risk
IIJA $550B boosts multi-year T&D pipelines; NEPA ~3-year delays, tariffs raise costs
IOU/muni T&D capex (EEI ~$95B 2023) and multi-year grid programs underpin MYR backlog, while higher policy rates (5.25–5.50% mid-2025) and 10yr yields ~4.3% tighten WACC and slow approvals. Commodity swings (~±25% annual) and 30–52 week transformer lead times stress margins; skilled labor scarcity (BLS median $79,230 May 2023) raises costs. MYR’s ~60/40 utility/C&I mix and >$100B announced EV/battery investments (2024) buffer cyclicality.
| Metric | Value |
|---|---|
| IOU electric capex | $95B (2023) |
| Policy rate | 5.25–5.50% (mid-2025) |
| 10yr Treasury | ~4.3% |
| Commodity volatility | ~25% |
| Transformer lead | 30–52 weeks |
| Labor median pay | $79,230 (May 2023) |
| EV/battery investments | >$100B (2024) |
| Revenue mix | ~60/40 utility/C&I (FY2024) |
Preview the Actual Deliverable
MYR Group PESTLE Analysis
The MYR Group PESTLE Analysis preview shown here is the exact, fully formatted document you’ll receive after purchase, offering political, economic, social, technological, legal, and environmental insights tailored to MYR Group. This is the real file—no placeholders or teasers. You’ll be able to download this finished document immediately after payment.











