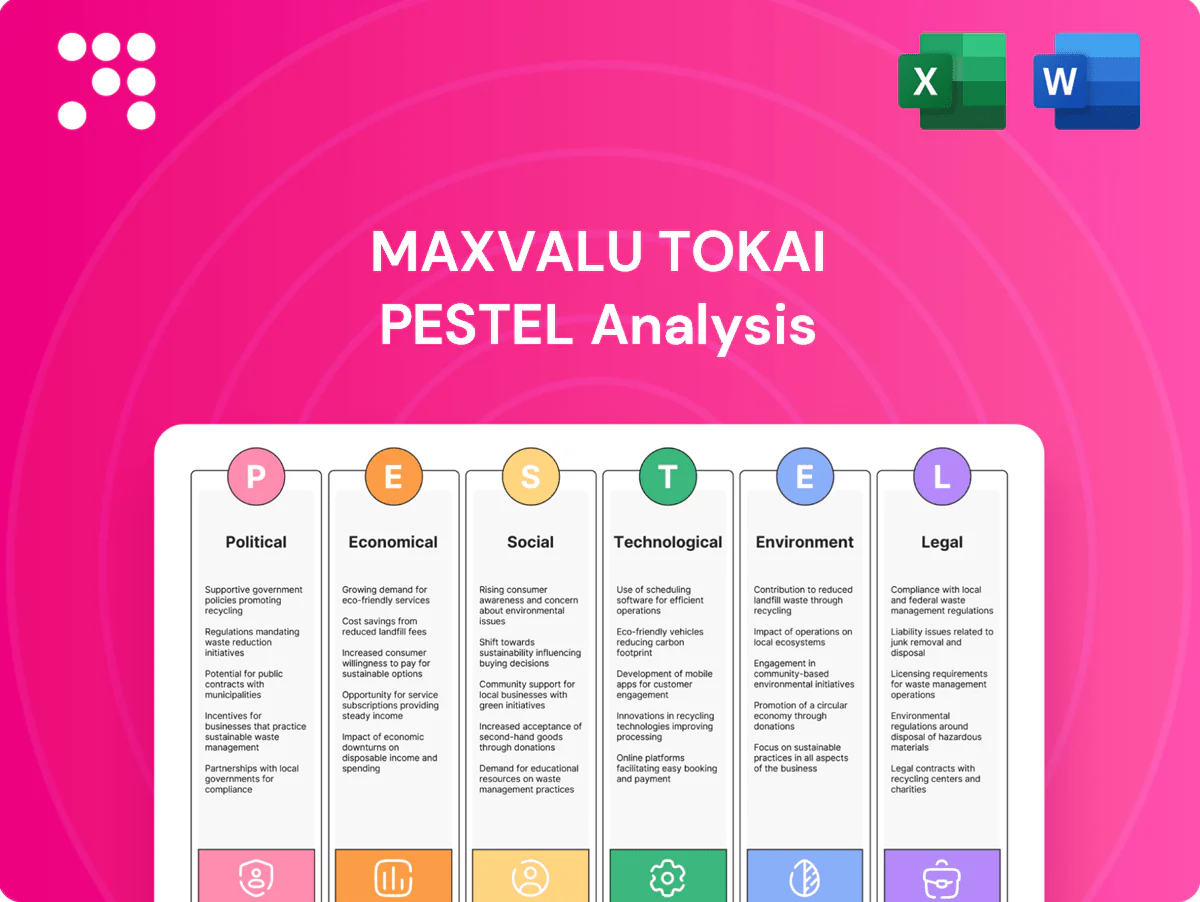
Maxvalu Tokai PESTLE Analysis

Plan Smarter. Present Sharper. Compete Stronger.
Unlock strategic clarity with our PESTLE Analysis of Maxvalu Tokai—three to five expert-reviewed sections that map political, economic, social, technological, legal, and environmental forces shaping its future. Ideal for investors, consultants, and managers, this concise briefing reveals risks and growth levers. Purchase the full report to access detailed insights, data sources, and actionable recommendations ready for immediate use.
Political factors

Local policy and permits
Coordination with prefectural and municipal governments determines store openings, operating hours and zoning across the Tokai region (population approx. 15 million in 2024), directly shaping Maxvalu Tokai expansion plans. Streamlined permits accelerate remodels and installation of fresh-food prep areas. Shifts in neighborhood development or traffic policy can materially alter footfall. Proactive stakeholder engagement reduces approval risk and delays.
Food security initiatives
National and prefectural food security programs shape Maxvalu Tokai sourcing and pricing decisions, aiming to boost domestic supply as Japan's food self-sufficiency ratio hovers around 37% (calorie basis). Subsidies and public procurement frameworks often prioritize local produce, strengthening freshness claims. Participation secures more stable peak-season supply. Compliance and reporting requirements increase administrative burden and costs.

Consumption tax changes
Japan's consumption tax has been 10% since October 1, 2019 with a reduced 8% rate for food and non-alcoholic drinks, so any adjustments force Maxvalu Tokai to relabel shelf prices and update POS logic across stores. Even a 1 percentage-point change requires system patches and customer communication, and margin management must compensate for rounding effects in yen pricing. Transparent pricing preserves customer trust and compliance.

Disaster preparedness policy
Government disaster-resilience mandates matter in earthquake- and typhoon-prone Tokai, a region officially designated high-risk by Japanese authorities; Japan averages about 2–3 typhoon landfalls per year, reinforcing stringent standards. Legal requirements for emergency stockpiles and seismic facility upgrades raise operating and capital costs for Maxvalu Tokai. Active participation in community relief programs builds measurable brand goodwill. National and prefectural grants and subsidies can co-fund resiliency upgrades.
- Mandates increase CAPEX/OPEX for stockpiles and retrofits
- Tokai: official high-risk earthquake designation; ~2–3 typhoon landfalls/yr
- Community relief participation boosts brand goodwill
- National/prefectural grants available to co-fund upgrades
Trade and import policy
Rules on imported meat, seafood and produce directly affect Maxvalu Tokai's assortment and cost base; Japan's food self-sufficiency was 37% (calorie basis, MAFF 2022), increasing import reliance. Tariff or sanitary barriers tightened supply in shocks (COVID-19 2020, ASF 2019). Diversified sourcing and strict inspection compliance reduce volatility; clear origin labeling boosts consumer confidence.
- Import rules raise costs
- Sanitary barriers tighten supply in shocks
- Diverse sourcing + inspections lower risk
- Origin labeling supports sales
Gov policy, taxes and typhoon risk steer Tokai store expansion and sourcing
Coordination with prefectural/municipal governments (Tokai pop ~15 million in 2024) directs store openings, zoning and operating hours, affecting expansion timing. National food-security rules and subsidies (Japan food self-sufficiency ~37% MAFF 2022) shape sourcing and pricing. Consumption tax (standard 10%, reduced 8% for food) forces POS and labeling updates. Disaster mandates (2–3 typhoon landfalls/yr; high seismic risk) raise CAPEX/OPEX but qualify for grants.
| Factor | Key metric | Impact |
|---|---|---|
| Gov coordination | Tokai pop ~15M (2024) | Controls openings/zoning |
| Food policy | Self-sufficiency 37% (2022) | Subsidies, sourcing rules |
| Tax | 10%/8% (food) | POS/price relabeling |
| Disaster rules | 2–3 typhoons/yr | CAPEX/OPEX, grants |
What is included in the product
 Detailed Word Document
Provides a concise, data-backed PESTLE evaluation of Maxvalu Tokai—covering Political, Economic, Social, Technological, Environmental, and Legal forces—with region-specific trends, forward-looking insights, and clear implications to help executives and investors spot risks, opportunities, and strategic actions.

 Customizable Excel Spreadsheet
A concise, visually segmented PESTLE summary of Maxvalu Tokai for quick reference in meetings and presentations. Editable notes and a shareable, slide-ready format streamline cross-team alignment, risk discussions, and strategic planning.
Economic factors

Yen volatility
Yen volatility—with USD/JPY trading roughly in the 150–160 range through 2024–mid‑2025—raises costs for imported food and packaging, squeezing margins as input prices climb. Pass-through to consumers is limited by price-sensitive shoppers and tight retail margins. Active FX hedging and tougher supplier negotiations are crucial to defend margins, while accelerating private-label expansion can offset cost creep.
Wage and labor costs
Tight labor markets in Japan (unemployment ~2.5% in 2024) pushed retail hourly pay up roughly 4% YoY, elevating store-staff wages and benefits for Maxvalu Tokai. Advanced scheduling and productivity tools are required to sustain service levels and limit overtime. Checkout and backroom automation can cut unit labor hours by ~10–15%. Better retention lowers recurring hiring and training costs.

Inflation and basket mix
With food CPI in Japan running near 5% YoY in 2024, MaxValu Tokai is shifting assortment toward value packs, private labels and targeted promotions to protect volume. Basket optimization using category elasticities guides mix and tactical pricing to protect margins. Fresh categories demand tight shrink control and data-led promo ROI monitoring to keep profitability intact.

Regional demographics
Aging and depopulation across parts of Tokai shift volume growth dynamics: Japan's 65+ share reached 29.1% in 2024 and average household size fell to about 2.33, favoring convenience and ready-to-eat purchases, smaller baskets but higher visit frequency, and rising demand for delivery and compact stores.
- Smaller baskets, higher visit frequency
- Home delivery and micro-stores capture demand
- Localized assortments increase relevance
Competition landscape
Competition from convenience stores, drugstores and rising e-commerce (grocery share ~6% in 2024) is eroding supermarket traffic and forcing price wars on staples that compress margins; major convenience-sector sales exceeded 10 trillion yen in 2024, intensifying proximity-based competition. Maxvalu Tokai must differentiate on fresh quality, prepared foods and loyalty programs while using strategic site selection to avoid cannibalization.
- Pressure: convenience/drugstore proximity
- e-commerce: ~6% grocery share (2024)
- Margins: staples price wars
- Differentiation: fresh/prepared/loyalty
- Real estate: strategic site selection
Gov policy, taxes and typhoon risk steer Tokai store expansion and sourcing
Yen at 150–160 (2024–mid‑2025) raises import costs and squeezes margins; limited pass‑through due to price sensitivity. Unemployment ~2.5% and retail pay +4% YoY lift labor costs; automation can cut unit hours 10–15%. Food CPI ~5% (2024) forces private‑label and value assortments. Aging pop 65+ 29.1% and household size 2.33 shift demand to convenience, delivery and smaller baskets.
| Metric | Value (2024/2025) |
|---|---|
| USD/JPY | 150–160 |
| Unemployment | ~2.5% |
| Retail pay change | +4% YoY |
| Food CPI | ~5% YoY |
| 65+ population | 29.1% |
| Avg household size | 2.33 |
| Grocery e‑commerce share | ~6% |
| Convenience sector sales | >10 trillion yen |
What You See Is What You Get
Maxvalu Tokai PESTLE Analysis
The preview shown here is the exact Maxvalu Tokai PESTLE Analysis document you’ll receive after purchase—fully formatted and ready to use. This is the real file with complete content and structure, delivered exactly as shown. No placeholders or surprises; download instantly after payment.

Product Information
Product Information
Shipping & Returns
Shipping & Returns
Description
Plan Smarter. Present Sharper. Compete Stronger.
Unlock strategic clarity with our PESTLE Analysis of Maxvalu Tokai—three to five expert-reviewed sections that map political, economic, social, technological, legal, and environmental forces shaping its future. Ideal for investors, consultants, and managers, this concise briefing reveals risks and growth levers. Purchase the full report to access detailed insights, data sources, and actionable recommendations ready for immediate use.
Political factors
Local policy and permits
Coordination with prefectural and municipal governments determines store openings, operating hours and zoning across the Tokai region (population approx. 15 million in 2024), directly shaping Maxvalu Tokai expansion plans. Streamlined permits accelerate remodels and installation of fresh-food prep areas. Shifts in neighborhood development or traffic policy can materially alter footfall. Proactive stakeholder engagement reduces approval risk and delays.
Food security initiatives
National and prefectural food security programs shape Maxvalu Tokai sourcing and pricing decisions, aiming to boost domestic supply as Japan's food self-sufficiency ratio hovers around 37% (calorie basis). Subsidies and public procurement frameworks often prioritize local produce, strengthening freshness claims. Participation secures more stable peak-season supply. Compliance and reporting requirements increase administrative burden and costs.
Consumption tax changes
Japan's consumption tax has been 10% since October 1, 2019 with a reduced 8% rate for food and non-alcoholic drinks, so any adjustments force Maxvalu Tokai to relabel shelf prices and update POS logic across stores. Even a 1 percentage-point change requires system patches and customer communication, and margin management must compensate for rounding effects in yen pricing. Transparent pricing preserves customer trust and compliance.
Disaster preparedness policy
Government disaster-resilience mandates matter in earthquake- and typhoon-prone Tokai, a region officially designated high-risk by Japanese authorities; Japan averages about 2–3 typhoon landfalls per year, reinforcing stringent standards. Legal requirements for emergency stockpiles and seismic facility upgrades raise operating and capital costs for Maxvalu Tokai. Active participation in community relief programs builds measurable brand goodwill. National and prefectural grants and subsidies can co-fund resiliency upgrades.
- Mandates increase CAPEX/OPEX for stockpiles and retrofits
- Tokai: official high-risk earthquake designation; ~2–3 typhoon landfalls/yr
- Community relief participation boosts brand goodwill
- National/prefectural grants available to co-fund upgrades
Trade and import policy
Rules on imported meat, seafood and produce directly affect Maxvalu Tokai's assortment and cost base; Japan's food self-sufficiency was 37% (calorie basis, MAFF 2022), increasing import reliance. Tariff or sanitary barriers tightened supply in shocks (COVID-19 2020, ASF 2019). Diversified sourcing and strict inspection compliance reduce volatility; clear origin labeling boosts consumer confidence.
- Import rules raise costs
- Sanitary barriers tighten supply in shocks
- Diverse sourcing + inspections lower risk
- Origin labeling supports sales
Gov policy, taxes and typhoon risk steer Tokai store expansion and sourcing
Coordination with prefectural/municipal governments (Tokai pop ~15 million in 2024) directs store openings, zoning and operating hours, affecting expansion timing. National food-security rules and subsidies (Japan food self-sufficiency ~37% MAFF 2022) shape sourcing and pricing. Consumption tax (standard 10%, reduced 8% for food) forces POS and labeling updates. Disaster mandates (2–3 typhoon landfalls/yr; high seismic risk) raise CAPEX/OPEX but qualify for grants.
| Factor | Key metric | Impact |
|---|---|---|
| Gov coordination | Tokai pop ~15M (2024) | Controls openings/zoning |
| Food policy | Self-sufficiency 37% (2022) | Subsidies, sourcing rules |
| Tax | 10%/8% (food) | POS/price relabeling |
| Disaster rules | 2–3 typhoons/yr | CAPEX/OPEX, grants |
What is included in the product
Detailed Word Document
Provides a concise, data-backed PESTLE evaluation of Maxvalu Tokai—covering Political, Economic, Social, Technological, Environmental, and Legal forces—with region-specific trends, forward-looking insights, and clear implications to help executives and investors spot risks, opportunities, and strategic actions.
Customizable Excel Spreadsheet
A concise, visually segmented PESTLE summary of Maxvalu Tokai for quick reference in meetings and presentations. Editable notes and a shareable, slide-ready format streamline cross-team alignment, risk discussions, and strategic planning.
Economic factors
Yen volatility
Yen volatility—with USD/JPY trading roughly in the 150–160 range through 2024–mid‑2025—raises costs for imported food and packaging, squeezing margins as input prices climb. Pass-through to consumers is limited by price-sensitive shoppers and tight retail margins. Active FX hedging and tougher supplier negotiations are crucial to defend margins, while accelerating private-label expansion can offset cost creep.
Wage and labor costs
Tight labor markets in Japan (unemployment ~2.5% in 2024) pushed retail hourly pay up roughly 4% YoY, elevating store-staff wages and benefits for Maxvalu Tokai. Advanced scheduling and productivity tools are required to sustain service levels and limit overtime. Checkout and backroom automation can cut unit labor hours by ~10–15%. Better retention lowers recurring hiring and training costs.
Inflation and basket mix
With food CPI in Japan running near 5% YoY in 2024, MaxValu Tokai is shifting assortment toward value packs, private labels and targeted promotions to protect volume. Basket optimization using category elasticities guides mix and tactical pricing to protect margins. Fresh categories demand tight shrink control and data-led promo ROI monitoring to keep profitability intact.
Regional demographics
Aging and depopulation across parts of Tokai shift volume growth dynamics: Japan's 65+ share reached 29.1% in 2024 and average household size fell to about 2.33, favoring convenience and ready-to-eat purchases, smaller baskets but higher visit frequency, and rising demand for delivery and compact stores.
- Smaller baskets, higher visit frequency
- Home delivery and micro-stores capture demand
- Localized assortments increase relevance
Competition landscape
Competition from convenience stores, drugstores and rising e-commerce (grocery share ~6% in 2024) is eroding supermarket traffic and forcing price wars on staples that compress margins; major convenience-sector sales exceeded 10 trillion yen in 2024, intensifying proximity-based competition. Maxvalu Tokai must differentiate on fresh quality, prepared foods and loyalty programs while using strategic site selection to avoid cannibalization.
- Pressure: convenience/drugstore proximity
- e-commerce: ~6% grocery share (2024)
- Margins: staples price wars
- Differentiation: fresh/prepared/loyalty
- Real estate: strategic site selection
Gov policy, taxes and typhoon risk steer Tokai store expansion and sourcing
Yen at 150–160 (2024–mid‑2025) raises import costs and squeezes margins; limited pass‑through due to price sensitivity. Unemployment ~2.5% and retail pay +4% YoY lift labor costs; automation can cut unit hours 10–15%. Food CPI ~5% (2024) forces private‑label and value assortments. Aging pop 65+ 29.1% and household size 2.33 shift demand to convenience, delivery and smaller baskets.
| Metric | Value (2024/2025) |
|---|---|
| USD/JPY | 150–160 |
| Unemployment | ~2.5% |
| Retail pay change | +4% YoY |
| Food CPI | ~5% YoY |
| 65+ population | 29.1% |
| Avg household size | 2.33 |
| Grocery e‑commerce share | ~6% |
| Convenience sector sales | >10 trillion yen |
What You See Is What You Get
Maxvalu Tokai PESTLE Analysis
The preview shown here is the exact Maxvalu Tokai PESTLE Analysis document you’ll receive after purchase—fully formatted and ready to use. This is the real file with complete content and structure, delivered exactly as shown. No placeholders or surprises; download instantly after payment.











