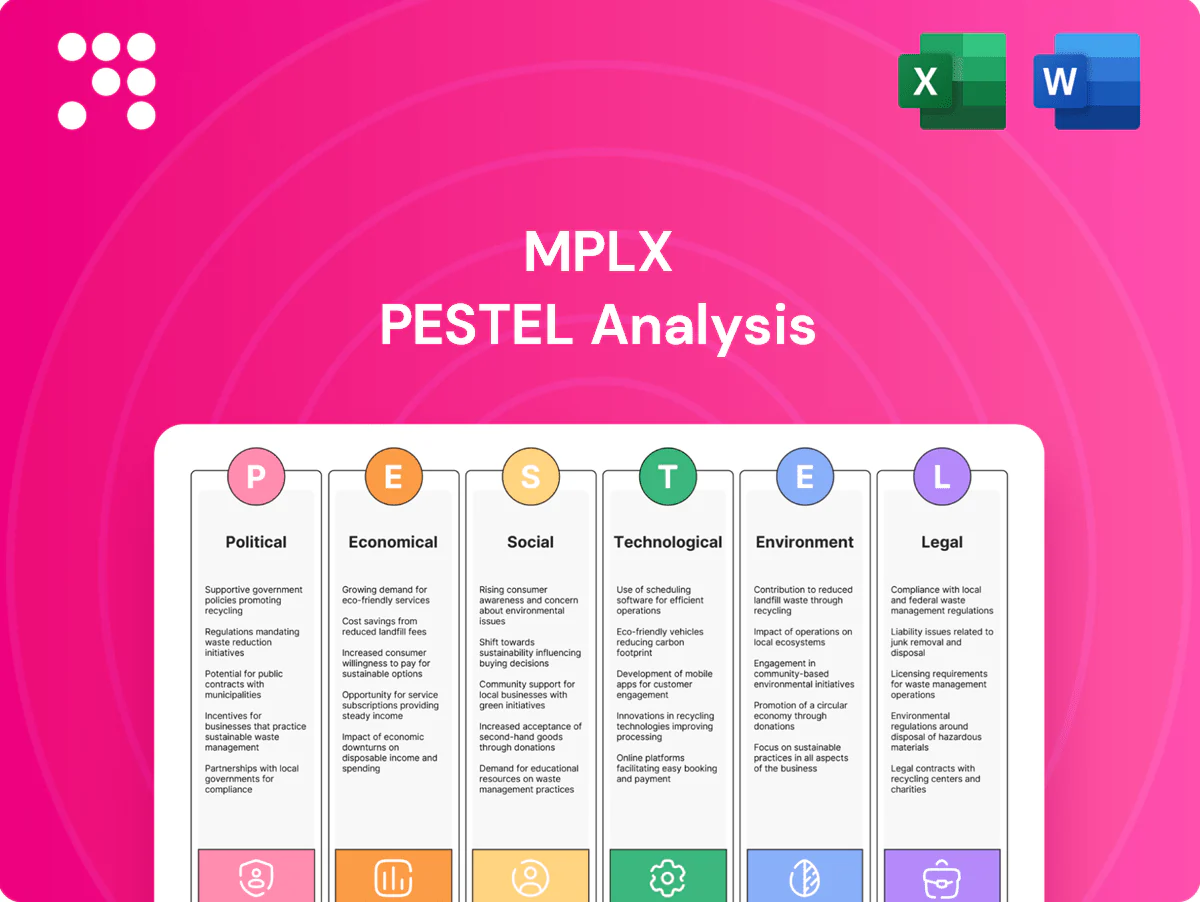
MPLX PESTLE Analysis

Your Competitive Advantage Starts with This Report
Discover how political shifts, energy markets, and environmental regulations are reshaping MPLX’s strategy and risk profile in our concise PESTLE overview—perfect for investors and strategists. Purchase the full PESTLE to access detailed, actionable insights and ready-to-use analysis for decision-making.
Political factors

Federal energy policy direction
Federal energy policy shifts—from the Inflation Reduction Act’s $369 billion energy/climate package to permitting stances—directly affect pipeline approvals, LNG export rules and midstream investment incentives; U.S. LNG capacity reached about 12.7 Bcf/d by 2024. Pro-infrastructure administrations can cut project timelines and boost volumes, while aggressive decarbonization can limit new assets. MPLX must hedge strategy across election cycles and agency leadership changes.
Permitting and infrastructure siting
NEPA reviews and interstate coordination routinely lengthen MPLX project lead times; CEQ metrics in 2024 showed average complex EIS timelines of roughly 3–5 years, increasing permitting costs. Streamlining initiatives (CEQ reforms 2020–24) have shortened some cycles, while tightened environmental reviews add mitigation and timeline risk. Local and tribal consultations add political negotiation that has delayed projects months to years. Delays can defer cash flows and compress returns on sanctioned projects.

Geopolitics and energy security
Global supply disruptions and export-policy debates—with U.S. crude exports near 4.5 million barrels per day in 2024 according to EIA—raise domestic flow and storage needs, boosting demand for midstream capacity. Policies prioritizing U.S. energy independence support utilization and expansion of pipelines and terminals, while sanctions and trade tensions shift crude slates and product balances. MPLX benefits from stable regulatory rules that prioritize infrastructure reliability, underpinning fee-based cash flows.

State-level regulatory divergence
State-level regulatory divergence shapes MPLX project routing and cost as pro-development energy states support build-outs while others enforce stricter methane rules, setbacks and eminent domain limits; political shifts in key states in 2024 repriced project risk for midstream developers.
- Regulatory variance increases permitting time and capex risk
- Setbacks and methane rules raise mitigation costs
- Jurisdictional portfolio reduces single-state exposure
Incentives for low-carbon infrastructure
- 45Q: $85/ton CO2
- Hydrogen PTC: up to $3/kg
- Methane target: 30% by 2030
- EPA/MERP funding: ~$1.55B
Midstream risk-reward: IRA incentives, permitting delays (EIS 3-5 yrs) and CCUS credits
MPLX faces federal policy swings—IRA incentives, permitting shifts and election cycles—that alter pipeline approvals and midstream CAPEX; U.S. LNG ~12.7 Bcf/d (2024) and crude exports ~4.5 mb/d (2024) support demand. State methane rules, setbacks and NEPA EIS delays (3–5 yrs for complex EIS) raise costs and timing risk. Tax credits (45Q $85/t, H2 PTC $3/kg) and ~$1.55B EPA funds create CCUS/hydrogen lanes.
| Metric | 2024 |
|---|---|
| U.S. LNG | 12.7 Bcf/d |
| Crude exports | 4.5 mb/d |
| 45Q | $85/ton |
What is included in the product
 Detailed Word Document
Explores how external macro-environmental factors uniquely affect MPLX across Political, Economic, Social, Technological, Environmental and Legal dimensions; each section is data-backed, region- and industry-specific, and provides forward-looking insights to help executives, investors and strategists identify risks, opportunities and scenario plans.

 Customizable Excel Spreadsheet
A concise, PESTLE-organized summary of MPLX's external risks and opportunities, ideal for drop-in slides or quick team alignment during strategy sessions.
Economic factors

Throughput tied to production cycles
Throughput for MPLX is closely tied to upstream cycles: EIA data show U.S. crude production topped 13 million barrels per day in 2023–24, which lifts gathering and processing volumes when commodity prices and local differentials tighten. Downturns compress drilling activity and reduce volumes while weakening tariff escalators. MPLX’s long-term contracts, disclosed in its filings, mitigate but do not eliminate this volume risk.
Interest rates and cost of capital
MLP valuations and project hurdle rates are highly rate-sensitive: with the US 10-year Treasury around 4.2% and policy rates near 5.25–5.50% in 2024–25, rising yields push MPLX financing costs higher and can compress distribution coverage. Lower rates enable accretive expansions and refinancing, improving payout flexibility. Access to capital and target leverage (roughly 3.5–4.0x net debt/EBITDA) dictate MPLX’s growth cadence.

Inflation and tariff indexation
Inflation raises MPLX operating and construction costs—steel, labor and services—while US CPI rose 3.4% in 2024, pressuring capex and maintenance budgets. FERC indexation and CPI-linked tariff escalators permit partial pass-through but timing mismatches during price spikes compress margins. Effective procurement, long-term contracts and hedges are critical to preserve returns.

Basin differentials and arbitrage
Basin differentials and arbitrage drive pipeline and storage economics: price spreads between producing basins and consuming markets create toll and storage optionality, with typical U.S. crude spreads moving between roughly 0–10 USD/bbl in normal cycles. Tight takeaway capacity historically pushes spreads above 10 USD/bbl, justifying expansions; overbuild can compress spreads toward single-digit or sub-2 USD/bbl levels, cutting fee revenue. MPLX’s asset footprint and connectivity determine its exposure to these basin-cycle swings.
- spreads range: ~0–10 USD/bbl
- tight capacity: spreads often >10 USD/bbl
- overbuild: spreads can compress <2 USD/bbl
- MPLX exposure depends on network positioning
Counterparty credit and consolidation
Shipper health directly affects MPLX volume stability and receivables risk; U.S. refinery throughput averaged about 17.5 million b/d in 2024 (EIA), so demand shocks among large shippers can dent volumes and increase DSO exposure. Ongoing industry consolidation tends to raise credit quality of remaining counterparties but boosts their bargaining power on fees and terms. Contract rollovers may reset rates in shifting markets, while a diversified counterparty mix smooths cash flows and reduces concentration risk.
- Shipper concentration: exposure to large refiners
- Industry consolidation: stronger counterparties, greater bargaining power
- Contract rollovers: potential rate resets
- Diversification: stabilizes cash flows, lowers receivables risk
Midstream risk-reward: IRA incentives, permitting delays (EIS 3-5 yrs) and CCUS credits
Throughput ties to upstream cycles (US crude >13 mb/d in 2023–24) so volumes and tariffs fall in downturns; long‑term contracts partially cushion risk. Higher rates (US 10y ~4.2%, policy 5.25–5.50% in 2024–25) raise cost of capital and press distribution coverage vs target leverage ~3.5–4.0x. Inflation (CPI 3.4% in 2024) and basin spreads drive capex returns and fee optionality.
| Metric | 2024–25 | Impact |
|---|---|---|
| US crude prod | >13 mb/d | ↑ volumes |
| 10y/Policy | 4.2% / 5.25–5.50% | ↑ financing cost |
| CPI | 3.4% | ↑ Opex/capex |
| Refinery thruput | 17.5 mb/d | shipper demand |
What You See Is What You Get
MPLX PESTLE Analysis
The MPLX PESTLE Analysis delivers concise insights into political, economic, social, technological, legal, and environmental factors affecting the company. It highlights key risks and strategic implications for investors and managers. The file you’re seeing now is the final version—ready to download right after purchase. Use it as a plug-and-play reference for decision-making.

Original: $10.00
-65%$10.00
$3.50Product Information
Product Information
Shipping & Returns
Shipping & Returns
Description
Your Competitive Advantage Starts with This Report
Discover how political shifts, energy markets, and environmental regulations are reshaping MPLX’s strategy and risk profile in our concise PESTLE overview—perfect for investors and strategists. Purchase the full PESTLE to access detailed, actionable insights and ready-to-use analysis for decision-making.
Political factors
Federal energy policy direction
Federal energy policy shifts—from the Inflation Reduction Act’s $369 billion energy/climate package to permitting stances—directly affect pipeline approvals, LNG export rules and midstream investment incentives; U.S. LNG capacity reached about 12.7 Bcf/d by 2024. Pro-infrastructure administrations can cut project timelines and boost volumes, while aggressive decarbonization can limit new assets. MPLX must hedge strategy across election cycles and agency leadership changes.
Permitting and infrastructure siting
NEPA reviews and interstate coordination routinely lengthen MPLX project lead times; CEQ metrics in 2024 showed average complex EIS timelines of roughly 3–5 years, increasing permitting costs. Streamlining initiatives (CEQ reforms 2020–24) have shortened some cycles, while tightened environmental reviews add mitigation and timeline risk. Local and tribal consultations add political negotiation that has delayed projects months to years. Delays can defer cash flows and compress returns on sanctioned projects.
Geopolitics and energy security
Global supply disruptions and export-policy debates—with U.S. crude exports near 4.5 million barrels per day in 2024 according to EIA—raise domestic flow and storage needs, boosting demand for midstream capacity. Policies prioritizing U.S. energy independence support utilization and expansion of pipelines and terminals, while sanctions and trade tensions shift crude slates and product balances. MPLX benefits from stable regulatory rules that prioritize infrastructure reliability, underpinning fee-based cash flows.
State-level regulatory divergence
State-level regulatory divergence shapes MPLX project routing and cost as pro-development energy states support build-outs while others enforce stricter methane rules, setbacks and eminent domain limits; political shifts in key states in 2024 repriced project risk for midstream developers.
- Regulatory variance increases permitting time and capex risk
- Setbacks and methane rules raise mitigation costs
- Jurisdictional portfolio reduces single-state exposure
Incentives for low-carbon infrastructure
- 45Q: $85/ton CO2
- Hydrogen PTC: up to $3/kg
- Methane target: 30% by 2030
- EPA/MERP funding: ~$1.55B
Midstream risk-reward: IRA incentives, permitting delays (EIS 3-5 yrs) and CCUS credits
MPLX faces federal policy swings—IRA incentives, permitting shifts and election cycles—that alter pipeline approvals and midstream CAPEX; U.S. LNG ~12.7 Bcf/d (2024) and crude exports ~4.5 mb/d (2024) support demand. State methane rules, setbacks and NEPA EIS delays (3–5 yrs for complex EIS) raise costs and timing risk. Tax credits (45Q $85/t, H2 PTC $3/kg) and ~$1.55B EPA funds create CCUS/hydrogen lanes.
| Metric | 2024 |
|---|---|
| U.S. LNG | 12.7 Bcf/d |
| Crude exports | 4.5 mb/d |
| 45Q | $85/ton |
What is included in the product
Detailed Word Document
Explores how external macro-environmental factors uniquely affect MPLX across Political, Economic, Social, Technological, Environmental and Legal dimensions; each section is data-backed, region- and industry-specific, and provides forward-looking insights to help executives, investors and strategists identify risks, opportunities and scenario plans.
Customizable Excel Spreadsheet
A concise, PESTLE-organized summary of MPLX's external risks and opportunities, ideal for drop-in slides or quick team alignment during strategy sessions.
Economic factors
Throughput tied to production cycles
Throughput for MPLX is closely tied to upstream cycles: EIA data show U.S. crude production topped 13 million barrels per day in 2023–24, which lifts gathering and processing volumes when commodity prices and local differentials tighten. Downturns compress drilling activity and reduce volumes while weakening tariff escalators. MPLX’s long-term contracts, disclosed in its filings, mitigate but do not eliminate this volume risk.
Interest rates and cost of capital
MLP valuations and project hurdle rates are highly rate-sensitive: with the US 10-year Treasury around 4.2% and policy rates near 5.25–5.50% in 2024–25, rising yields push MPLX financing costs higher and can compress distribution coverage. Lower rates enable accretive expansions and refinancing, improving payout flexibility. Access to capital and target leverage (roughly 3.5–4.0x net debt/EBITDA) dictate MPLX’s growth cadence.
Inflation and tariff indexation
Inflation raises MPLX operating and construction costs—steel, labor and services—while US CPI rose 3.4% in 2024, pressuring capex and maintenance budgets. FERC indexation and CPI-linked tariff escalators permit partial pass-through but timing mismatches during price spikes compress margins. Effective procurement, long-term contracts and hedges are critical to preserve returns.
Basin differentials and arbitrage
Basin differentials and arbitrage drive pipeline and storage economics: price spreads between producing basins and consuming markets create toll and storage optionality, with typical U.S. crude spreads moving between roughly 0–10 USD/bbl in normal cycles. Tight takeaway capacity historically pushes spreads above 10 USD/bbl, justifying expansions; overbuild can compress spreads toward single-digit or sub-2 USD/bbl levels, cutting fee revenue. MPLX’s asset footprint and connectivity determine its exposure to these basin-cycle swings.
- spreads range: ~0–10 USD/bbl
- tight capacity: spreads often >10 USD/bbl
- overbuild: spreads can compress <2 USD/bbl
- MPLX exposure depends on network positioning
Counterparty credit and consolidation
Shipper health directly affects MPLX volume stability and receivables risk; U.S. refinery throughput averaged about 17.5 million b/d in 2024 (EIA), so demand shocks among large shippers can dent volumes and increase DSO exposure. Ongoing industry consolidation tends to raise credit quality of remaining counterparties but boosts their bargaining power on fees and terms. Contract rollovers may reset rates in shifting markets, while a diversified counterparty mix smooths cash flows and reduces concentration risk.
- Shipper concentration: exposure to large refiners
- Industry consolidation: stronger counterparties, greater bargaining power
- Contract rollovers: potential rate resets
- Diversification: stabilizes cash flows, lowers receivables risk
Midstream risk-reward: IRA incentives, permitting delays (EIS 3-5 yrs) and CCUS credits
Throughput ties to upstream cycles (US crude >13 mb/d in 2023–24) so volumes and tariffs fall in downturns; long‑term contracts partially cushion risk. Higher rates (US 10y ~4.2%, policy 5.25–5.50% in 2024–25) raise cost of capital and press distribution coverage vs target leverage ~3.5–4.0x. Inflation (CPI 3.4% in 2024) and basin spreads drive capex returns and fee optionality.
| Metric | 2024–25 | Impact |
|---|---|---|
| US crude prod | >13 mb/d | ↑ volumes |
| 10y/Policy | 4.2% / 5.25–5.50% | ↑ financing cost |
| CPI | 3.4% | ↑ Opex/capex |
| Refinery thruput | 17.5 mb/d | shipper demand |
What You See Is What You Get
MPLX PESTLE Analysis
The MPLX PESTLE Analysis delivers concise insights into political, economic, social, technological, legal, and environmental factors affecting the company. It highlights key risks and strategic implications for investors and managers. The file you’re seeing now is the final version—ready to download right after purchase. Use it as a plug-and-play reference for decision-making.











