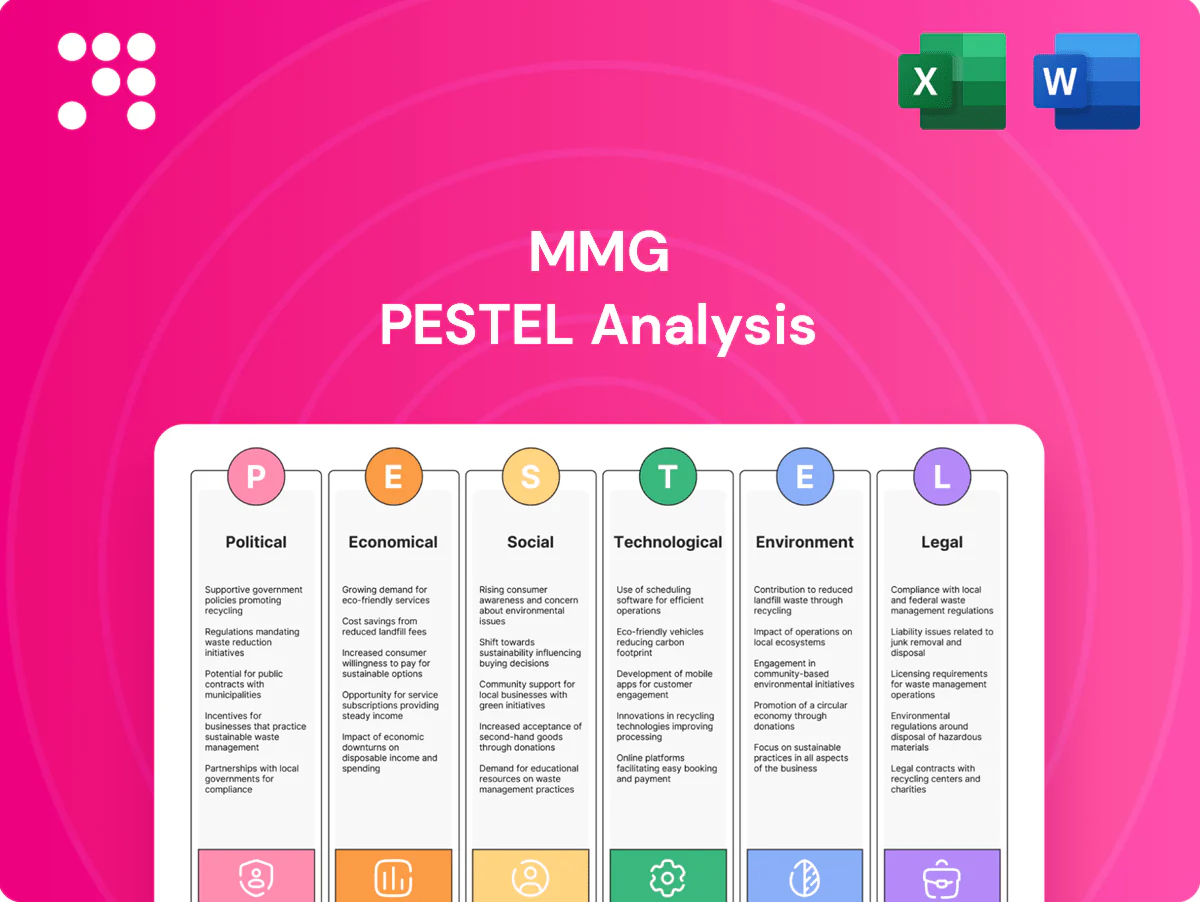
MMG PESTLE Analysis

Skip the Research. Get the Strategy.
Discover how political shifts, economic cycles, and environmental policies are shaping MMG’s strategic outlook in our concise PESTLE briefing—ideal for investors and strategists seeking clarity fast. This analysis highlights key external risks and opportunities with actionable takeaways. Purchase the full PESTLE for the complete, editable report and immediate insights you can use.
Political factors

Resource nationalism
Host governments in Africa and South America may increase taxes, royalties or demand greater state participation, materially altering project economics and mine lives; Peru’s mining sector was about 9% of GDP in 2023, underscoring fiscal leverage. Active stakeholder engagement and benefit-sharing lower expropriation risk, and scenario planning must model abrupt fiscal or ownership changes.
Permits and approvals
Mine permits depend on national, provincial and local authorities with timelines ranging from months to over five years; cumulative permitting delays often add 6–24 months to project schedules. Political turnover in jurisdictions where MMG operates can slow or reverse approvals, raising schedule risk and potential costs. Early regulator alignment and transparent impact disclosure de-risk timelines. Maintaining real-time compliance dashboards prevents inadvertent breaches and costly suspensions.

Geopolitics and trade
Copper and zinc supply chains face sanctions, export controls and chokepoints that can interrupt shipments and spare‑parts flows; China accounted for roughly 50–52% of global refined copper consumption in 2024, concentrating demand risk. Trade tensions have already shifted customer access and equipment sourcing, raising lead times and premium sourcing costs. Diversifying routes and suppliers (including alternate ports and equipment vendors) strengthens resilience. Active hedging and flexible contract terms reduce disruption costs and price volatility exposure.

Community and indigenous relations
Local political actors and traditional authorities shape MMG’s social licence, with land access, resettlement and benefit distribution remaining highly sensitive; MMG reported US$20.2 million in community investment in 2023 to support local programs. Structured FPIC processes and documented benefit-sharing frameworks improve project stability and lower litigation risk. Continuous consultation and grievance mechanisms reduce protest-related downtime and operational disruption.
- Local influence: traditional authorities drive acceptance
- Political sensitivities: land, resettlement, benefits
- FPIC: formal processes increase stability
- Consultation: continuous dialogue lowers protest/downtime risk
Security and stability
Certain jurisdictions where MMG operates, notably Las Bambas in Peru and Kinsevere in the DRC, have experienced community blockades and security incidents that interrupted shipments and operations, for example the 2021 Las Bambas blockades that halted concentrate transport.
Political instability increases insurance premiums and operating costs and can materially delay cash flow; robust security protocols and stakeholder mapping reduce exposure.
Contingency plans, evacuation procedures and alternative logistics routes preserve workforce safety and production continuity during disruptions.
- Risk: community blockades and crime
- Impact: higher insurance and operating costs
- Mitigation: security protocols, stakeholder mapping
- Resilience: contingency plans and alternate logistics
Permitting delays, fiscal shifts and China demand concentration heighten copper project risk
Host states may raise taxes/royalties or seek greater ownership — Peru mining ~9% of GDP in 2023 — while permitting delays typically add 6–24 months to schedules. Supply-chain choke points persist as China consumed ~51% of refined copper in 2024, concentrating demand risk. MMG reported US$20.2m community investment in 2023; structured FPIC, stakeholder mapping and alternate logistics cut disruption risk.
| Issue | 2023–24 stat | Impact | Mitigation |
|---|---|---|---|
| Fiscal/ownership | Peru 9% GDP (2023) | Higher costs, shorter mine life | Scenario planning, benefit-sharing |
| Permitting | +6–24 months | Schedule/cost risk | Regulator alignment |
| Supply chains | China ~51% copper (2024) | Lead-time, price risk | Diversify routes/suppliers |
What is included in the product
 Detailed Word Document
Explores how external macro-environmental factors uniquely affect MMG across Political, Economic, Social, Technological, Environmental and Legal dimensions, using data-backed trends and region/industry relevance. Designed for executives and investors, it offers detailed sub-points, forward-looking insights and clean formatting ready for business plans, scenario planning and funding pitches.

 Customizable Excel Spreadsheet
A clean, summarized MMG PESTLE that’s visually segmented by category for quick interpretation and meeting-ready—editable for local context and easily dropped into presentations or shared across teams.
Economic factors

Commodity price cycles
MMG revenues closely track copper and zinc price volatility, with LME averages in 2024 near US$9,200/tonne for copper and US$3,100/tonne for zinc, reflecting swings in global growth, electrification-driven demand and inventory levels. MMG preserves margins through cycles via flexible capex and rigorous cost control, adjusting spend to market signals. Price hedging is used to smooth cash flows and support covenant compliance.
Cost inflation
Energy, reagents, explosives and labour have experienced sustained above-trend inflation across MMG operations, increasing input cost pressure and narrowing margins.
Remote site locations amplify freight and specialised services costs, raising delivered input prices and logistics complexity.
Long-term supply contracts and local sourcing have dampened short-term volatility, while continuous improvement and automation programs are reducing unit costs and offsetting some inflationary impact.

FX and interest rates
Revenues are primarily USD while operating costs are in AUD and various African and Latin American currencies, so USD/AUD moves (around 1.60 in mid‑2025) and regional FX swings materially affect margins and project NPVs. Prudent treasury hedging and alignment of debt to USD reduce currency exposure. Higher interest rates (US policy rate ~5.25–5.50% in mid‑2025) raise refinancing costs and compress expansion economics.

Demand from China
China remains the dominant buyer of copper and zinc concentrates, accounting for roughly half of global refined copper demand; strong construction, grid upgrades and about 8.8 million EVs sold in 2023 drive offtake and upward pressure on treatment charges.
MMG mitigates single-market risk via customer diversification and flexible sales terms, while actively monitoring smelter TC/RC movements to optimize concentrate netbacks.
- China ≈50% of global refined copper demand
- EV sales ~8.8 million (2023)
- Diversified customers + flexible contracts
- Track TC/RC shifts to protect netbacks
Logistics and infrastructure
Logistics and infrastructure determine MMG delivered economics: port capacity limits and rail reliability drive landed cost while trucking rates and fuel surcharges push margins; UNCTAD reported 11.3 billion tonnes seaborne trade in 2023, underscoring port pressure into 2024–25. Weather and strikes have intermittently halted concentrate flows at Las Bambas and other hubs in 2024. Multi-route options and inventory buffers preserve shipments; strategic infrastructure partnerships reduce bottleneck risk and variable costs.
- Port capacity pressure: 11.3 bn t seaborne trade (UNCTAD 2023)
- Rail/reliability: delays amplify delivered cost
- Trucking costs: fuel/surcharges drive margin volatility
- Mitigants: multi-route + inventory buffers + infrastructure partnerships
Permitting delays, fiscal shifts and China demand concentration heighten copper project risk
MMG earnings track metal prices (copper ~US$9,200/t, zinc ~US$3,100/t in 2024), while inflation in energy, reagents and labour plus remote-site logistics compress margins; USD/AUD ~1.60 (mid‑2025) and US policy rate ~5.25–5.50% raise funding costs; China (~50% refined copper demand) and 2023 seaborne trade 11.3bn t drive offtake and port pressure.
| Metric | Value |
|---|---|
| LME copper (2024) | ~US$9,200/t |
| LME zinc (2024) | ~US$3,100/t |
| USD/AUD (mid‑2025) | ~1.60 |
| US policy rate (mid‑2025) | 5.25–5.50% |
| China share | ~50% refined copper demand |
| Seaborne trade (2023) | 11.3bn t |
Preview Before You Purchase
MMG PESTLE Analysis
The preview shown here is the exact MMG PESTLE Analysis you’ll receive after purchase—fully formatted and ready to use. It contains complete political, economic, social, technological, legal and environmental sections as displayed. No placeholders or surprises; you’ll download this final file instantly after checkout.

Original: $10.00
-65%$10.00
$3.50Product Information
Product Information
Shipping & Returns
Shipping & Returns
Description
Skip the Research. Get the Strategy.
Discover how political shifts, economic cycles, and environmental policies are shaping MMG’s strategic outlook in our concise PESTLE briefing—ideal for investors and strategists seeking clarity fast. This analysis highlights key external risks and opportunities with actionable takeaways. Purchase the full PESTLE for the complete, editable report and immediate insights you can use.
Political factors
Resource nationalism
Host governments in Africa and South America may increase taxes, royalties or demand greater state participation, materially altering project economics and mine lives; Peru’s mining sector was about 9% of GDP in 2023, underscoring fiscal leverage. Active stakeholder engagement and benefit-sharing lower expropriation risk, and scenario planning must model abrupt fiscal or ownership changes.
Permits and approvals
Mine permits depend on national, provincial and local authorities with timelines ranging from months to over five years; cumulative permitting delays often add 6–24 months to project schedules. Political turnover in jurisdictions where MMG operates can slow or reverse approvals, raising schedule risk and potential costs. Early regulator alignment and transparent impact disclosure de-risk timelines. Maintaining real-time compliance dashboards prevents inadvertent breaches and costly suspensions.
Geopolitics and trade
Copper and zinc supply chains face sanctions, export controls and chokepoints that can interrupt shipments and spare‑parts flows; China accounted for roughly 50–52% of global refined copper consumption in 2024, concentrating demand risk. Trade tensions have already shifted customer access and equipment sourcing, raising lead times and premium sourcing costs. Diversifying routes and suppliers (including alternate ports and equipment vendors) strengthens resilience. Active hedging and flexible contract terms reduce disruption costs and price volatility exposure.
Community and indigenous relations
Local political actors and traditional authorities shape MMG’s social licence, with land access, resettlement and benefit distribution remaining highly sensitive; MMG reported US$20.2 million in community investment in 2023 to support local programs. Structured FPIC processes and documented benefit-sharing frameworks improve project stability and lower litigation risk. Continuous consultation and grievance mechanisms reduce protest-related downtime and operational disruption.
- Local influence: traditional authorities drive acceptance
- Political sensitivities: land, resettlement, benefits
- FPIC: formal processes increase stability
- Consultation: continuous dialogue lowers protest/downtime risk
Security and stability
Certain jurisdictions where MMG operates, notably Las Bambas in Peru and Kinsevere in the DRC, have experienced community blockades and security incidents that interrupted shipments and operations, for example the 2021 Las Bambas blockades that halted concentrate transport.
Political instability increases insurance premiums and operating costs and can materially delay cash flow; robust security protocols and stakeholder mapping reduce exposure.
Contingency plans, evacuation procedures and alternative logistics routes preserve workforce safety and production continuity during disruptions.
- Risk: community blockades and crime
- Impact: higher insurance and operating costs
- Mitigation: security protocols, stakeholder mapping
- Resilience: contingency plans and alternate logistics
Permitting delays, fiscal shifts and China demand concentration heighten copper project risk
Host states may raise taxes/royalties or seek greater ownership — Peru mining ~9% of GDP in 2023 — while permitting delays typically add 6–24 months to schedules. Supply-chain choke points persist as China consumed ~51% of refined copper in 2024, concentrating demand risk. MMG reported US$20.2m community investment in 2023; structured FPIC, stakeholder mapping and alternate logistics cut disruption risk.
| Issue | 2023–24 stat | Impact | Mitigation |
|---|---|---|---|
| Fiscal/ownership | Peru 9% GDP (2023) | Higher costs, shorter mine life | Scenario planning, benefit-sharing |
| Permitting | +6–24 months | Schedule/cost risk | Regulator alignment |
| Supply chains | China ~51% copper (2024) | Lead-time, price risk | Diversify routes/suppliers |
What is included in the product
Detailed Word Document
Explores how external macro-environmental factors uniquely affect MMG across Political, Economic, Social, Technological, Environmental and Legal dimensions, using data-backed trends and region/industry relevance. Designed for executives and investors, it offers detailed sub-points, forward-looking insights and clean formatting ready for business plans, scenario planning and funding pitches.
Customizable Excel Spreadsheet
A clean, summarized MMG PESTLE that’s visually segmented by category for quick interpretation and meeting-ready—editable for local context and easily dropped into presentations or shared across teams.
Economic factors
Commodity price cycles
MMG revenues closely track copper and zinc price volatility, with LME averages in 2024 near US$9,200/tonne for copper and US$3,100/tonne for zinc, reflecting swings in global growth, electrification-driven demand and inventory levels. MMG preserves margins through cycles via flexible capex and rigorous cost control, adjusting spend to market signals. Price hedging is used to smooth cash flows and support covenant compliance.
Cost inflation
Energy, reagents, explosives and labour have experienced sustained above-trend inflation across MMG operations, increasing input cost pressure and narrowing margins.
Remote site locations amplify freight and specialised services costs, raising delivered input prices and logistics complexity.
Long-term supply contracts and local sourcing have dampened short-term volatility, while continuous improvement and automation programs are reducing unit costs and offsetting some inflationary impact.
FX and interest rates
Revenues are primarily USD while operating costs are in AUD and various African and Latin American currencies, so USD/AUD moves (around 1.60 in mid‑2025) and regional FX swings materially affect margins and project NPVs. Prudent treasury hedging and alignment of debt to USD reduce currency exposure. Higher interest rates (US policy rate ~5.25–5.50% in mid‑2025) raise refinancing costs and compress expansion economics.
Demand from China
China remains the dominant buyer of copper and zinc concentrates, accounting for roughly half of global refined copper demand; strong construction, grid upgrades and about 8.8 million EVs sold in 2023 drive offtake and upward pressure on treatment charges.
MMG mitigates single-market risk via customer diversification and flexible sales terms, while actively monitoring smelter TC/RC movements to optimize concentrate netbacks.
- China ≈50% of global refined copper demand
- EV sales ~8.8 million (2023)
- Diversified customers + flexible contracts
- Track TC/RC shifts to protect netbacks
Logistics and infrastructure
Logistics and infrastructure determine MMG delivered economics: port capacity limits and rail reliability drive landed cost while trucking rates and fuel surcharges push margins; UNCTAD reported 11.3 billion tonnes seaborne trade in 2023, underscoring port pressure into 2024–25. Weather and strikes have intermittently halted concentrate flows at Las Bambas and other hubs in 2024. Multi-route options and inventory buffers preserve shipments; strategic infrastructure partnerships reduce bottleneck risk and variable costs.
- Port capacity pressure: 11.3 bn t seaborne trade (UNCTAD 2023)
- Rail/reliability: delays amplify delivered cost
- Trucking costs: fuel/surcharges drive margin volatility
- Mitigants: multi-route + inventory buffers + infrastructure partnerships
Permitting delays, fiscal shifts and China demand concentration heighten copper project risk
MMG earnings track metal prices (copper ~US$9,200/t, zinc ~US$3,100/t in 2024), while inflation in energy, reagents and labour plus remote-site logistics compress margins; USD/AUD ~1.60 (mid‑2025) and US policy rate ~5.25–5.50% raise funding costs; China (~50% refined copper demand) and 2023 seaborne trade 11.3bn t drive offtake and port pressure.
| Metric | Value |
|---|---|
| LME copper (2024) | ~US$9,200/t |
| LME zinc (2024) | ~US$3,100/t |
| USD/AUD (mid‑2025) | ~1.60 |
| US policy rate (mid‑2025) | 5.25–5.50% |
| China share | ~50% refined copper demand |
| Seaborne trade (2023) | 11.3bn t |
Preview Before You Purchase
MMG PESTLE Analysis
The preview shown here is the exact MMG PESTLE Analysis you’ll receive after purchase—fully formatted and ready to use. It contains complete political, economic, social, technological, legal and environmental sections as displayed. No placeholders or surprises; you’ll download this final file instantly after checkout.











