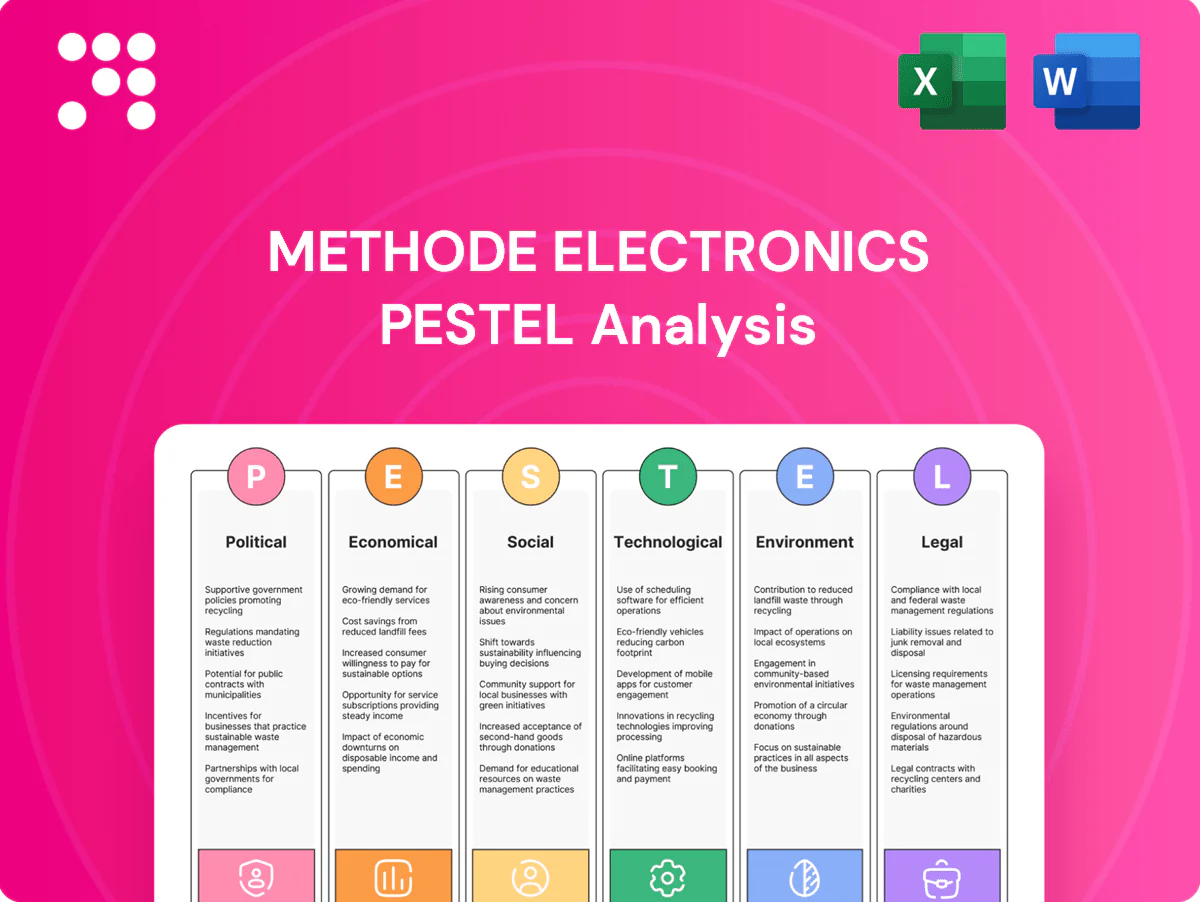
Methode Electronics PESTLE Analysis

Make Smarter Strategic Decisions with a Complete PESTEL View
Unlock strategic clarity with our concise PESTLE Analysis of Methode Electronics—three-sentence insights into political, economic, social, technological, legal, and environmental forces shaping its future. Use these findings to sharpen investment and strategy decisions. Purchase the full report for the complete, actionable breakdown now.
Political factors

Trade policy and tariffs
US Section 301 tariffs covering roughly $370 billion of Chinese goods (rates up to 25%) and EU/China retaliatory measures push up component costs and force rerouting; sensors, connectors and subassemblies crossing borders face direct tariff exposure and complex origin rules. Methode can mitigate via USMCA/other FTAs, duty-drawback and nearshoring to Mexico/US; higher input tariffs drive pricing pressure and longer lead times for automotive and cloud customers.
Industrial policy incentives
CHIPS and Science Act directs about $52.7 billion for semiconductor incentives while the Inflation Reduction Act contains roughly $369 billion for clean energy and manufacturing support; EU IPCEI offers member-state co‑funding for strategic electronics projects (amounts vary by project). Capital grants, tax credits and workforce training subsidies lower upfront capex and operating costs; CHIPS grants and IRA credits require US/North American final assembly and recurring compliance reporting with localization thresholds, shaping plant siting and long‑term unit cost curves.

Geopolitical supply chain risk
Conflicts, sanctions and chokepoints (Suez Ever Given estimated ~$9.6B/day; Strait of Hormuz ~20% of seaborne oil) threaten metals, resins and semis concentrated in East Asia, where Taiwan/SK supply ~60–70% of advanced foundry capacity. Methode faces multi-tier supplier concentration in China/Taiwan; nearshore options in Mexico and Eastern Europe are growing. Mitigation includes insurance, buffer stock and dual-sourcing; expediting premiums have surged historically up to 3–10x, with single-week downtime often costing manufacturers millions in lost output and rush logistics.

Government standards and procurement
Public-sector specs for transport, defense and infrastructure (e.g., US $1.2 trillion Bipartisan Infrastructure Law) force Methode to design for interoperability, cybersecurity and certified safety standards; bids require MIL-STD/EN, cybersecurity compliance and formal safety certifications. Country homologation often runs 6–24 months, so aligning product roadmaps with mandates like NIS2 (implementation by Oct 2024) secures long-cycle contracts.
- Interoperability
- Cybersecurity (NIS2)
- Safety certifications (MIL-STD/EN)
- Homologation 6–24 months
- Align roadmap to mandates
Labor and immigration policies
Visa regimes like the US H-1B cap (85,000) and local work-permit rules in Mexico and China directly constrain Methode Electronics access to engineers and technicians, raising reliance on local hires or relocation costs; right-to-work US states offer more hiring flexibility versus stricter jurisdictions with higher union presence (US union density ~10% in 2024) and wage floors that can lift plant labor costs.
- H-1B cap: 85,000
- US mfg wage ~$25/hr (2024)
- Union density ~10% (2024)
- Plan: recruit/training + targeted automation to stabilize throughput
Tariffs, foundry concentration and labor caps accelerate US nearshoring and automation push
Methode faces US Section 301 tariffs on ~$370B of Chinese goods and supply concentration in Taiwan/SK (~60–70% advanced foundry), raising input costs and lead times. CHIPS ($52.7B) and IRA (~$369B) incentives favor US/North American localization but add compliance/local-assembly rules. Labor constraints (H-1B cap 85,000; US union density ~10%; avg US mfg wage ~$25/hr) push nearshoring and automation.
| Tag | Value | Impact |
|---|---|---|
| Tariffs | $370B | ↑ Costs |
| CHIPS/IRA | $52.7B / $369B | Localization |
| Foundry conc. | 60–70% | Supply risk |
| H-1B | 85,000 | Talent cap |
What is included in the product
 Detailed Word Document
Explores how Political, Economic, Social, Technological, Environmental and Legal forces specifically impact Methode Electronics, combining data-driven trends and region-specific regulatory context to identify risks and opportunities; designed for executives and advisors, the analysis is forward-looking, actionable, and formatted for direct use in reports, decks, and strategic planning.

 Customizable Excel Spreadsheet
A concise, shareable PESTLE summary for Methode Electronics, visually segmented by category for quick interpretation and meeting-ready use; editable notes let teams tailor insights to regions or product lines, easing alignment and external risk discussions.
Economic factors

Cyclical demand across end-markets
Revenue is highly correlated with automotive build rates (global light-vehicle production ~82M units in 2024) and with cloud capex and consumer-electronics refresh cycles; order volatility and backlog health (book-to-bill and months of backlog) are primary leading indicators. Scenario plans should contrast soft-landing demand dips vs. recessionary 10–20% automotive declines, and calibrate inventory and capacity flexibly across sectors.
Interest rates and capital intensity
Rising benchmark rates (US federal funds 5.25–5.50% in mid‑2025) increase borrowing costs for plant expansions, tooling and automation, lengthening payback periods and lowering project NPV; customers with capital‑intensive EV/ADAS and data‑center projects face higher WACC, slowing spend. Under rate uncertainty, evaluate lease versus buy using updated IRR hurdles and stress tests; maintain liquidity buffers equal to 3–6 months of operating cash burn for downturn resilience.

FX volatility and translation risk
USD is the reporting currency with major transactional and translation exposure to EUR, CNY and MXN; these pairs drive revenues in EMEA, China and Mexico and affect imported input costs and local margins.
Methode discloses use of forwards and currency swaps for hedging transactional risk and relies on local sourcing and local-currency pricing to naturally offset CNY/MXN exposures.
Management reports FX translation and transaction moves historically shift operating margin ~0.15–0.25 percentage points per 1% movement in major pairs; sensitivity is monitored monthly.
Transfer pricing policies and contract pricing clauses are aligned to pass through material currency moves to customers and protect EBIT, per disclosures in the 2024 Form 10-K.

Input costs and availability
Input-cost pressure is acute: copper averaged about $9,200/t in H1 2025, NdPr rare-earths rose ~22% in 2024, silicon-wafer prices were ~+10% y/y and petrochemical resins ~+8% in 2024; MCU lead times remain 20–28 weeks with elevated allocation risk for power devices. Methode should deploy VAVE, redesigns and long-term supply agreements to stabilize COGS while monitoring supplier liquidity to preempt disruptions.
- Monitor: copper, NdPr, wafers, resins
- Map: MCU/power device lead times 20–28w
- Mitigate: VAVE, redesign, LTAs
- Track: supplier financial health, insolvencies +12% in 2024
Reshoring and cost-to-serve
Assess total cost of ownership when reshoring—include labor productivity and yield curve impacts, inland/logistics and duty differentials, and available incentives such as the CHIPS Act ($52 billion) and IRA (~$369 billion) when quantifying resilience premiums; compare regional SKUs versus global platforms to balance scale economies and complexity, and update pricing to reflect higher domestic footprint and altered cost-to-serve.
- Tag: TCO
- Tag: Labor productivity
- Tag: Yield & logistics
- Tag: SKU vs platform
- Tag: Pricing update
Tariffs, foundry concentration and labor caps accelerate US nearshoring and automation push
Revenue tracks automotive builds (~82M LV units in 2024) and electronics capex; order/backlog metrics are leading indicators. Higher rates (US fed funds 5.25–5.50% mid‑2025) raise project WACC and lengthen paybacks. FX (USD vs EUR/CNY/MXN) shifts margin ~0.15–0.25ppt per 1% move; copper ~$9,200/t, NdPr +22% in 2024, MCU lead times 20–28w stress COGS.
What You See Is What You Get
Methode Electronics PESTLE Analysis
The Methode Electronics PESTLE Analysis preview shown here is the exact document you’ll receive after purchase—fully formatted, professionally structured, and ready to use. It contains the complete political, economic, social, technological, legal, and environmental assessment as displayed, with no placeholders or surprises.

Original: $10.00
-65%$10.00
$3.50Product Information
Product Information
Shipping & Returns
Shipping & Returns
Description
Make Smarter Strategic Decisions with a Complete PESTEL View
Unlock strategic clarity with our concise PESTLE Analysis of Methode Electronics—three-sentence insights into political, economic, social, technological, legal, and environmental forces shaping its future. Use these findings to sharpen investment and strategy decisions. Purchase the full report for the complete, actionable breakdown now.
Political factors
Trade policy and tariffs
US Section 301 tariffs covering roughly $370 billion of Chinese goods (rates up to 25%) and EU/China retaliatory measures push up component costs and force rerouting; sensors, connectors and subassemblies crossing borders face direct tariff exposure and complex origin rules. Methode can mitigate via USMCA/other FTAs, duty-drawback and nearshoring to Mexico/US; higher input tariffs drive pricing pressure and longer lead times for automotive and cloud customers.
Industrial policy incentives
CHIPS and Science Act directs about $52.7 billion for semiconductor incentives while the Inflation Reduction Act contains roughly $369 billion for clean energy and manufacturing support; EU IPCEI offers member-state co‑funding for strategic electronics projects (amounts vary by project). Capital grants, tax credits and workforce training subsidies lower upfront capex and operating costs; CHIPS grants and IRA credits require US/North American final assembly and recurring compliance reporting with localization thresholds, shaping plant siting and long‑term unit cost curves.
Geopolitical supply chain risk
Conflicts, sanctions and chokepoints (Suez Ever Given estimated ~$9.6B/day; Strait of Hormuz ~20% of seaborne oil) threaten metals, resins and semis concentrated in East Asia, where Taiwan/SK supply ~60–70% of advanced foundry capacity. Methode faces multi-tier supplier concentration in China/Taiwan; nearshore options in Mexico and Eastern Europe are growing. Mitigation includes insurance, buffer stock and dual-sourcing; expediting premiums have surged historically up to 3–10x, with single-week downtime often costing manufacturers millions in lost output and rush logistics.
Government standards and procurement
Public-sector specs for transport, defense and infrastructure (e.g., US $1.2 trillion Bipartisan Infrastructure Law) force Methode to design for interoperability, cybersecurity and certified safety standards; bids require MIL-STD/EN, cybersecurity compliance and formal safety certifications. Country homologation often runs 6–24 months, so aligning product roadmaps with mandates like NIS2 (implementation by Oct 2024) secures long-cycle contracts.
- Interoperability
- Cybersecurity (NIS2)
- Safety certifications (MIL-STD/EN)
- Homologation 6–24 months
- Align roadmap to mandates
Labor and immigration policies
Visa regimes like the US H-1B cap (85,000) and local work-permit rules in Mexico and China directly constrain Methode Electronics access to engineers and technicians, raising reliance on local hires or relocation costs; right-to-work US states offer more hiring flexibility versus stricter jurisdictions with higher union presence (US union density ~10% in 2024) and wage floors that can lift plant labor costs.
- H-1B cap: 85,000
- US mfg wage ~$25/hr (2024)
- Union density ~10% (2024)
- Plan: recruit/training + targeted automation to stabilize throughput
Tariffs, foundry concentration and labor caps accelerate US nearshoring and automation push
Methode faces US Section 301 tariffs on ~$370B of Chinese goods and supply concentration in Taiwan/SK (~60–70% advanced foundry), raising input costs and lead times. CHIPS ($52.7B) and IRA (~$369B) incentives favor US/North American localization but add compliance/local-assembly rules. Labor constraints (H-1B cap 85,000; US union density ~10%; avg US mfg wage ~$25/hr) push nearshoring and automation.
| Tag | Value | Impact |
|---|---|---|
| Tariffs | $370B | ↑ Costs |
| CHIPS/IRA | $52.7B / $369B | Localization |
| Foundry conc. | 60–70% | Supply risk |
| H-1B | 85,000 | Talent cap |
What is included in the product
Detailed Word Document
Explores how Political, Economic, Social, Technological, Environmental and Legal forces specifically impact Methode Electronics, combining data-driven trends and region-specific regulatory context to identify risks and opportunities; designed for executives and advisors, the analysis is forward-looking, actionable, and formatted for direct use in reports, decks, and strategic planning.
Customizable Excel Spreadsheet
A concise, shareable PESTLE summary for Methode Electronics, visually segmented by category for quick interpretation and meeting-ready use; editable notes let teams tailor insights to regions or product lines, easing alignment and external risk discussions.
Economic factors
Cyclical demand across end-markets
Revenue is highly correlated with automotive build rates (global light-vehicle production ~82M units in 2024) and with cloud capex and consumer-electronics refresh cycles; order volatility and backlog health (book-to-bill and months of backlog) are primary leading indicators. Scenario plans should contrast soft-landing demand dips vs. recessionary 10–20% automotive declines, and calibrate inventory and capacity flexibly across sectors.
Interest rates and capital intensity
Rising benchmark rates (US federal funds 5.25–5.50% in mid‑2025) increase borrowing costs for plant expansions, tooling and automation, lengthening payback periods and lowering project NPV; customers with capital‑intensive EV/ADAS and data‑center projects face higher WACC, slowing spend. Under rate uncertainty, evaluate lease versus buy using updated IRR hurdles and stress tests; maintain liquidity buffers equal to 3–6 months of operating cash burn for downturn resilience.
FX volatility and translation risk
USD is the reporting currency with major transactional and translation exposure to EUR, CNY and MXN; these pairs drive revenues in EMEA, China and Mexico and affect imported input costs and local margins.
Methode discloses use of forwards and currency swaps for hedging transactional risk and relies on local sourcing and local-currency pricing to naturally offset CNY/MXN exposures.
Management reports FX translation and transaction moves historically shift operating margin ~0.15–0.25 percentage points per 1% movement in major pairs; sensitivity is monitored monthly.
Transfer pricing policies and contract pricing clauses are aligned to pass through material currency moves to customers and protect EBIT, per disclosures in the 2024 Form 10-K.
Input costs and availability
Input-cost pressure is acute: copper averaged about $9,200/t in H1 2025, NdPr rare-earths rose ~22% in 2024, silicon-wafer prices were ~+10% y/y and petrochemical resins ~+8% in 2024; MCU lead times remain 20–28 weeks with elevated allocation risk for power devices. Methode should deploy VAVE, redesigns and long-term supply agreements to stabilize COGS while monitoring supplier liquidity to preempt disruptions.
- Monitor: copper, NdPr, wafers, resins
- Map: MCU/power device lead times 20–28w
- Mitigate: VAVE, redesign, LTAs
- Track: supplier financial health, insolvencies +12% in 2024
Reshoring and cost-to-serve
Assess total cost of ownership when reshoring—include labor productivity and yield curve impacts, inland/logistics and duty differentials, and available incentives such as the CHIPS Act ($52 billion) and IRA (~$369 billion) when quantifying resilience premiums; compare regional SKUs versus global platforms to balance scale economies and complexity, and update pricing to reflect higher domestic footprint and altered cost-to-serve.
- Tag: TCO
- Tag: Labor productivity
- Tag: Yield & logistics
- Tag: SKU vs platform
- Tag: Pricing update
Tariffs, foundry concentration and labor caps accelerate US nearshoring and automation push
Revenue tracks automotive builds (~82M LV units in 2024) and electronics capex; order/backlog metrics are leading indicators. Higher rates (US fed funds 5.25–5.50% mid‑2025) raise project WACC and lengthen paybacks. FX (USD vs EUR/CNY/MXN) shifts margin ~0.15–0.25ppt per 1% move; copper ~$9,200/t, NdPr +22% in 2024, MCU lead times 20–28w stress COGS.
What You See Is What You Get
Methode Electronics PESTLE Analysis
The Methode Electronics PESTLE Analysis preview shown here is the exact document you’ll receive after purchase—fully formatted, professionally structured, and ready to use. It contains the complete political, economic, social, technological, legal, and environmental assessment as displayed, with no placeholders or surprises.











