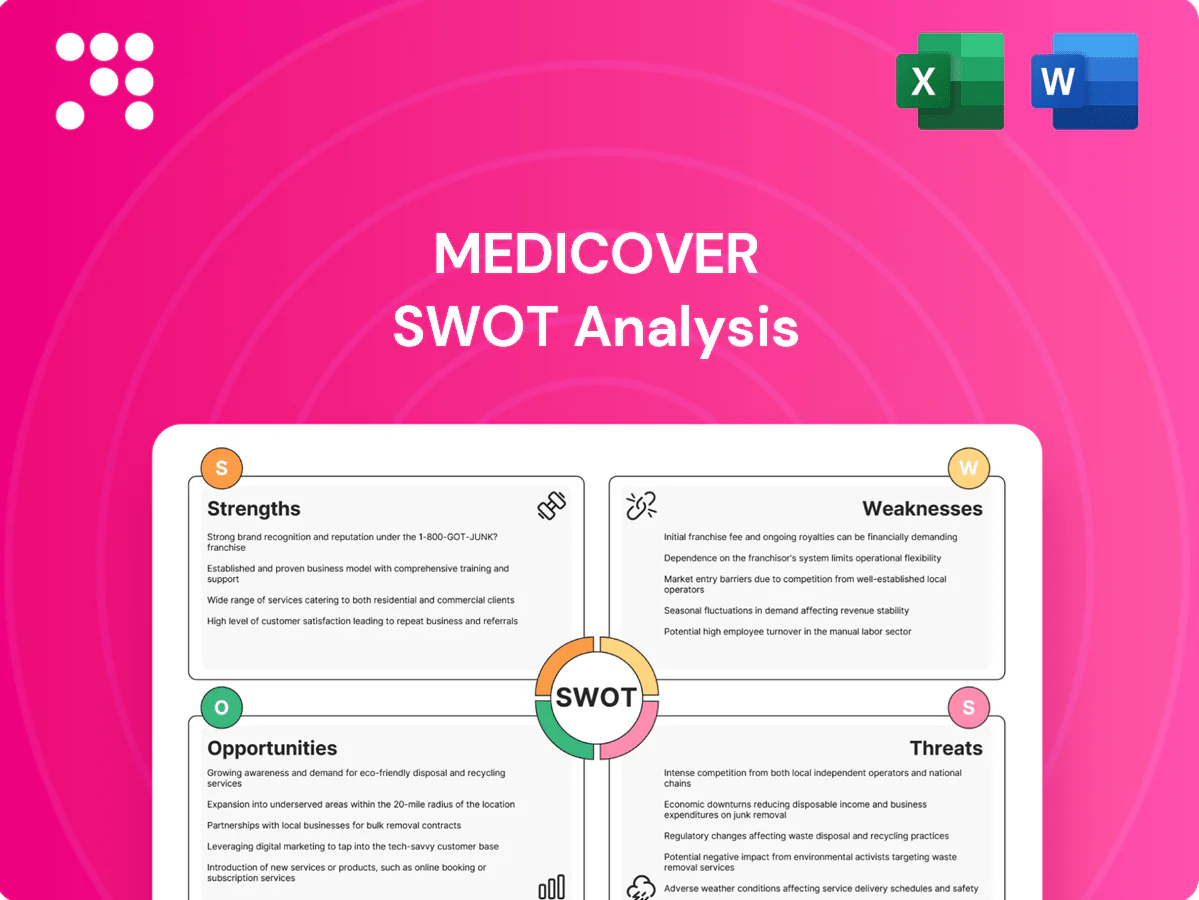
Medicover SWOT Analysis

Elevate Your Analysis with the Complete SWOT Report
Medicover’s integrated care model, strong brand in Central and Eastern Europe, and expanding diagnostics network underpin its competitive edge, while regulatory shifts, margin pressure, and regional competition pose clear risks. Our full SWOT unpacks these strengths, weaknesses, opportunities, and threats with financial context and strategic recommendations. Purchase the complete, editable Word + Excel report to plan, pitch, or invest with confidence.
Strengths

Integrated care ecosystem
Medicover’s clinics, hospitals and labs create a seamless patient journey across prevention, diagnosis and treatment, enabling faster referrals and coordinated care plans. This integrated model, deployed across 10 countries with roughly 20,000 employees (2024), improves patient outcomes and experience through continuity of care. It also boosts cross-selling and retention by capturing care across the value chain.
Diversified service portfolio
Diversified service portfolio spanning outpatient, inpatient, diagnostics and specialty care reduces revenue volatility by smoothing demand across acute, chronic and elective streams. Mixed modalities balance high-volume, low-margin services with higher-margin specialized treatments, attracting varied patient segments and payers. The breadth enables bundled care pathways and value-based pilots with payers, supporting margin stability and growth.

Quality and brand trust
Medicover’s focus on high-quality care reinforces its reputation with patients, employers and payers, driving repeat utilization and contract wins.
Trusted brand recognition supports pricing power and customer loyalty, reducing churn and enabling premium service offerings.
Consistent clinical standards and accreditation across its network underpin better outcomes and operational reliability.
Strong NPS strengthens referrals and accelerates network effects across sites and corporate contracts.

Preventive healthcare focus
Medicover's preventive healthcare focus creates recurring touchpoints and enables earlier interventions, improving patient retention and clinical outcomes. Preventive programs reduce downstream costs for payers and employers by lowering hospital admissions and chronic disease progression. Screening data drives targeted care pathways and aligns services with payer and corporate wellness priorities.
- Recurring touchpoints
- Lower downstream costs
- Payer and corporate alignment
- Data-driven care pathways
Operational scale and data
Medicover’s broad operational scale—spanning hundreds of clinics and labs across multiple countries—raises procurement efficiency, increases test throughput and utilization, and standardizes care pathways to boost reliability and cost per case. Its consolidated clinical and billing data pools support benchmarking and evidence-based decisions across millions of annual patient interactions, strengthening negotiating leverage with suppliers and payers.
- Scale: hundreds of sites across multiple countries
- Data: millions of annual patient interactions for benchmarking
- Procurement: stronger supplier and payer negotiation leverage
Integrated care in 10 countries, 20,000 staff
Integrated clinics, hospitals and labs across 10 countries with roughly 20,000 employees (2024) enable seamless care, faster referrals and higher retention. Diversified outpatient, inpatient and diagnostics mix smooths revenue and supports higher-margin specialties. Scale—hundreds of sites and millions of annual patient interactions—drives procurement savings, data-led pathways and stronger payer negotiating leverage.
| Metric | Value (2024/est) |
|---|---|
| Countries | 10 |
| Employees | ~20,000 |
| Sites | hundreds |
| Annual patient interactions | millions |
What is included in the product
 Detailed Word Document
Delivers a strategic overview of Medicover’s internal and external business factors, outlining strengths, weaknesses, opportunities, and threats to assess its competitive position, growth drivers, operational gaps, and market risks.

 Customizable Excel Spreadsheet
Provides a focused Medicover SWOT matrix for swift strategy alignment and stakeholder-ready summaries, enabling quick prioritization of clinical, operational, and market risks for faster decision-making.
Weaknesses

Capital-intensive footprint
Medicover, listed on Nasdaq Stockholm, faces a capital-intensive footprint as hospitals and labs demand continuous capex for diagnostic equipment and regulatory compliance. High fixed costs amplify occupancy risk, making margins highly volume-sensitive. Expansion can strain cash flows in downturns, with payback periods often extending several years and hinging on rapid volume ramp-up.
Complexity of integration
Coordinating multi-site, multi-service operations across Medicover's c.10-country footprint is operationally demanding and strains centralized oversight. Variability in workflows and legacy IT platforms hampers scalability, contributing to reported integration delays that elevate per-patient costs and can erode NPS. Continuous change management consumes significant resources; Medicover's 2023 revenue of c. EUR 1.1bn underscores scale but also integration complexity.

Margin pressure in diagnostics
Diagnostic prices face commoditization and intensified tender pressure, squeezing unit margins across Medicover’s lab network. High-volume routine tests are increasingly subject to reimbursement reductions, eroding per-test profitability. A shift in test mix toward lower-margin assays compresses overall margins, while capacity underutilization quickly magnifies fixed-cost leverage and margin erosion.

Talent dependency
Reliance on clinicians and skilled technicians creates staffing risk for Medicover; shortages drive wage inflation and higher agency costs, squeezing margins.
Clinician burnout elevates error risk, lowers service quality and accelerates turnover, increasing recruitment and temporary staffing spend.
Training pipelines may lag growth, constraining capacity to scale in high-demand markets.
- Staffing risk
- Wage inflation & agency costs
- Burnout → quality & retention
- Training pipeline lag
Regulatory exposure
Regulatory exposure raises Medicover's operating rigidity as healthcare rules, licensing and quality audits drive higher compliance costs and slower rollouts; GDPR breach fines can reach up to 4% of global turnover, illustrating financial risk. Abrupt shifts in reimbursement models can compress margins quickly, while compliance failures carry both reputational damage and direct penalties. Cross-border regulatory differences complicate centralized governance and increase administrative burden.
- Higher compliance costs and slower expansion
- GDPR fines up to 4% of turnover
- Reimbursement changes can abruptly reduce revenue
- Cross-border rules raise governance complexity
Capital-heavy hospital and lab network: high fixed costs, margin squeeze, GDPR risk
Medicover's capital-intensive hospitals and labs (2023 revenue c. EUR 1.1bn) create high fixed-cost leverage and long payback periods, magnifying volume risk. Multi-country (c.10) operations and legacy IT slow integrations and raise per-patient costs. Commoditizing diagnostics and reimbursement pressure compress margins, while clinician shortages drive wage inflation and agency spend. Regulatory complexity (GDPR fines up to 4% turnover) increases compliance costs.
| Metric | Value |
|---|---|
| Revenue (2023) | c. EUR 1.1bn |
| Countries | c.10 |
| GDPR fine | Up to 4% of turnover |
Preview the Actual Deliverable
Medicover SWOT Analysis
This is the actual Medicover SWOT analysis document you’ll receive upon purchase—no surprises, just professional quality. The preview below is taken directly from the full report and reflects the same structured, editable file available after checkout. Buy now to unlock the complete, in-depth version.

Original: $10.00
-65%$10.00
$3.50Product Information
Product Information
Shipping & Returns
Shipping & Returns
Description
Elevate Your Analysis with the Complete SWOT Report
Medicover’s integrated care model, strong brand in Central and Eastern Europe, and expanding diagnostics network underpin its competitive edge, while regulatory shifts, margin pressure, and regional competition pose clear risks. Our full SWOT unpacks these strengths, weaknesses, opportunities, and threats with financial context and strategic recommendations. Purchase the complete, editable Word + Excel report to plan, pitch, or invest with confidence.
Strengths
Integrated care ecosystem
Medicover’s clinics, hospitals and labs create a seamless patient journey across prevention, diagnosis and treatment, enabling faster referrals and coordinated care plans. This integrated model, deployed across 10 countries with roughly 20,000 employees (2024), improves patient outcomes and experience through continuity of care. It also boosts cross-selling and retention by capturing care across the value chain.
Diversified service portfolio
Diversified service portfolio spanning outpatient, inpatient, diagnostics and specialty care reduces revenue volatility by smoothing demand across acute, chronic and elective streams. Mixed modalities balance high-volume, low-margin services with higher-margin specialized treatments, attracting varied patient segments and payers. The breadth enables bundled care pathways and value-based pilots with payers, supporting margin stability and growth.
Quality and brand trust
Medicover’s focus on high-quality care reinforces its reputation with patients, employers and payers, driving repeat utilization and contract wins.
Trusted brand recognition supports pricing power and customer loyalty, reducing churn and enabling premium service offerings.
Consistent clinical standards and accreditation across its network underpin better outcomes and operational reliability.
Strong NPS strengthens referrals and accelerates network effects across sites and corporate contracts.
Preventive healthcare focus
Medicover's preventive healthcare focus creates recurring touchpoints and enables earlier interventions, improving patient retention and clinical outcomes. Preventive programs reduce downstream costs for payers and employers by lowering hospital admissions and chronic disease progression. Screening data drives targeted care pathways and aligns services with payer and corporate wellness priorities.
- Recurring touchpoints
- Lower downstream costs
- Payer and corporate alignment
- Data-driven care pathways
Operational scale and data
Medicover’s broad operational scale—spanning hundreds of clinics and labs across multiple countries—raises procurement efficiency, increases test throughput and utilization, and standardizes care pathways to boost reliability and cost per case. Its consolidated clinical and billing data pools support benchmarking and evidence-based decisions across millions of annual patient interactions, strengthening negotiating leverage with suppliers and payers.
- Scale: hundreds of sites across multiple countries
- Data: millions of annual patient interactions for benchmarking
- Procurement: stronger supplier and payer negotiation leverage
Integrated care in 10 countries, 20,000 staff
Integrated clinics, hospitals and labs across 10 countries with roughly 20,000 employees (2024) enable seamless care, faster referrals and higher retention. Diversified outpatient, inpatient and diagnostics mix smooths revenue and supports higher-margin specialties. Scale—hundreds of sites and millions of annual patient interactions—drives procurement savings, data-led pathways and stronger payer negotiating leverage.
| Metric | Value (2024/est) |
|---|---|
| Countries | 10 |
| Employees | ~20,000 |
| Sites | hundreds |
| Annual patient interactions | millions |
What is included in the product
Detailed Word Document
Delivers a strategic overview of Medicover’s internal and external business factors, outlining strengths, weaknesses, opportunities, and threats to assess its competitive position, growth drivers, operational gaps, and market risks.
Customizable Excel Spreadsheet
Provides a focused Medicover SWOT matrix for swift strategy alignment and stakeholder-ready summaries, enabling quick prioritization of clinical, operational, and market risks for faster decision-making.
Weaknesses
Capital-intensive footprint
Medicover, listed on Nasdaq Stockholm, faces a capital-intensive footprint as hospitals and labs demand continuous capex for diagnostic equipment and regulatory compliance. High fixed costs amplify occupancy risk, making margins highly volume-sensitive. Expansion can strain cash flows in downturns, with payback periods often extending several years and hinging on rapid volume ramp-up.
Complexity of integration
Coordinating multi-site, multi-service operations across Medicover's c.10-country footprint is operationally demanding and strains centralized oversight. Variability in workflows and legacy IT platforms hampers scalability, contributing to reported integration delays that elevate per-patient costs and can erode NPS. Continuous change management consumes significant resources; Medicover's 2023 revenue of c. EUR 1.1bn underscores scale but also integration complexity.
Margin pressure in diagnostics
Diagnostic prices face commoditization and intensified tender pressure, squeezing unit margins across Medicover’s lab network. High-volume routine tests are increasingly subject to reimbursement reductions, eroding per-test profitability. A shift in test mix toward lower-margin assays compresses overall margins, while capacity underutilization quickly magnifies fixed-cost leverage and margin erosion.
Talent dependency
Reliance on clinicians and skilled technicians creates staffing risk for Medicover; shortages drive wage inflation and higher agency costs, squeezing margins.
Clinician burnout elevates error risk, lowers service quality and accelerates turnover, increasing recruitment and temporary staffing spend.
Training pipelines may lag growth, constraining capacity to scale in high-demand markets.
- Staffing risk
- Wage inflation & agency costs
- Burnout → quality & retention
- Training pipeline lag
Regulatory exposure
Regulatory exposure raises Medicover's operating rigidity as healthcare rules, licensing and quality audits drive higher compliance costs and slower rollouts; GDPR breach fines can reach up to 4% of global turnover, illustrating financial risk. Abrupt shifts in reimbursement models can compress margins quickly, while compliance failures carry both reputational damage and direct penalties. Cross-border regulatory differences complicate centralized governance and increase administrative burden.
- Higher compliance costs and slower expansion
- GDPR fines up to 4% of turnover
- Reimbursement changes can abruptly reduce revenue
- Cross-border rules raise governance complexity
Capital-heavy hospital and lab network: high fixed costs, margin squeeze, GDPR risk
Medicover's capital-intensive hospitals and labs (2023 revenue c. EUR 1.1bn) create high fixed-cost leverage and long payback periods, magnifying volume risk. Multi-country (c.10) operations and legacy IT slow integrations and raise per-patient costs. Commoditizing diagnostics and reimbursement pressure compress margins, while clinician shortages drive wage inflation and agency spend. Regulatory complexity (GDPR fines up to 4% turnover) increases compliance costs.
| Metric | Value |
|---|---|
| Revenue (2023) | c. EUR 1.1bn |
| Countries | c.10 |
| GDPR fine | Up to 4% of turnover |
Preview the Actual Deliverable
Medicover SWOT Analysis
This is the actual Medicover SWOT analysis document you’ll receive upon purchase—no surprises, just professional quality. The preview below is taken directly from the full report and reflects the same structured, editable file available after checkout. Buy now to unlock the complete, in-depth version.











