Medicover PESTLE Analysis

Skip the Research. Get the Strategy.
Unlock strategic clarity with our focused PESTLE analysis of Medicover, revealing how political, economic, social, technological, legal and environmental forces shape its trajectory. This concise briefing highlights regulatory risks, market opportunities and tech-driven shifts investors and strategists must know. Purchase the full, editable report to access the complete deep-dive and actionable recommendations instantly.
Political factors

Healthcare policy stability
Government priorities on universal coverage, reimbursement levels, and privatization drive patient volumes and pricing power; EU countries spend around 10% of GDP on health (Eurostat), influencing public versus private demand. Stable policy enables long-term investment in clinics, hospitals and labs, supporting multi-year capex cycles. Policy shifts can quickly redirect demand between public and private providers, so Medicover must align its service mix with evolving national health strategies.
Public reimbursement and tariffs
National health funds and insurer tariffs drive revenue predictability for diagnostics and treatment, with public payers covering roughly 70% of health spending in many European markets in 2024 (OECD-average range). Changes to DRG schedules, test tariffs and co-pay rules directly compress or expand margins by altering unit reimbursement. Negotiation power differs by country and regional authority, affecting contract terms and pricing. Diversifying payer mix mitigates risk from single-system shocks.

PPP and tender dynamics
Access to public contracts for screenings, lab services and hospital ops hinges on transparent tendering; PPP frameworks have helped Medicover and peers scale rapidly, with PPP-backed projects accounting for an estimated 30–40% of new network expansions in Central and Eastern Europe in 2023–24. Bid criteria now prioritize scale, clinical quality metrics and digital capabilities (telehealth/EHR integration), and a strong compliance record materially increases award success rates.

Geopolitical and regulatory fragmentation
Operating across over 10 countries exposes Medicover to sanctions, cross-border licensing and supply-chain redirection; 2024 trade restrictions tied to the Russia–Ukraine conflict forced re-routing of some European medical imports. Divergent national clinical guidelines complicate standardization and raise compliance costs. Political risk also disrupts staffing mobility and capital flows; scenario planning and stress-testing of networks buffers volatility.
- Exposure: over 10 markets
- Supply shock: rerouting due to 2024 Russia–Ukraine disruptions
- Compliance: divergent clinical guidelines raise costs
- Mitigation: scenario planning, stress tests
Healthcare workforce policy
- Immigration rules
- Training subsidies
- Wage floors/caps
- Residency & credential recognition
- Policy engagement
Tenders and policy reshuffle EU care; spend ~10% GDP, public ~70%
Government coverage, reimbursement and privatization shape volumes and pricing, with EU health spend ~10% of GDP (Eurostat 2024) and public payers ~70% of health spending (OECD 2024). Policy shifts and tenders (PPPs 30–40% of network expansion 2023–24) reallocate demand rapidly; cross-border rules and 2024 Russia–Ukraine trade disruptions raise supply and staffing risks.
| Metric | Value | Source/Year |
|---|---|---|
| EU health spend | ~10% GDP | Eurostat 2024 |
| Public payer share | ~70% | OECD 2024 |
| Physicians/nurses per 1k | 3.9 / 8.5 | OECD 2022 |
| PPP expansion | 30–40% | Market 2023–24 |
| Markets | 10+ | Medicover |
What is included in the product
 Detailed Word Document
Explores how external macro-environmental factors uniquely affect Medicover across Political, Economic, Social, Technological, Environmental and Legal dimensions, with region- and industry-specific examples. Each section is backed by current data and forward-looking insights to support executives, investors and strategists in identifying threats, opportunities and scenario planning.

 Customizable Excel Spreadsheet
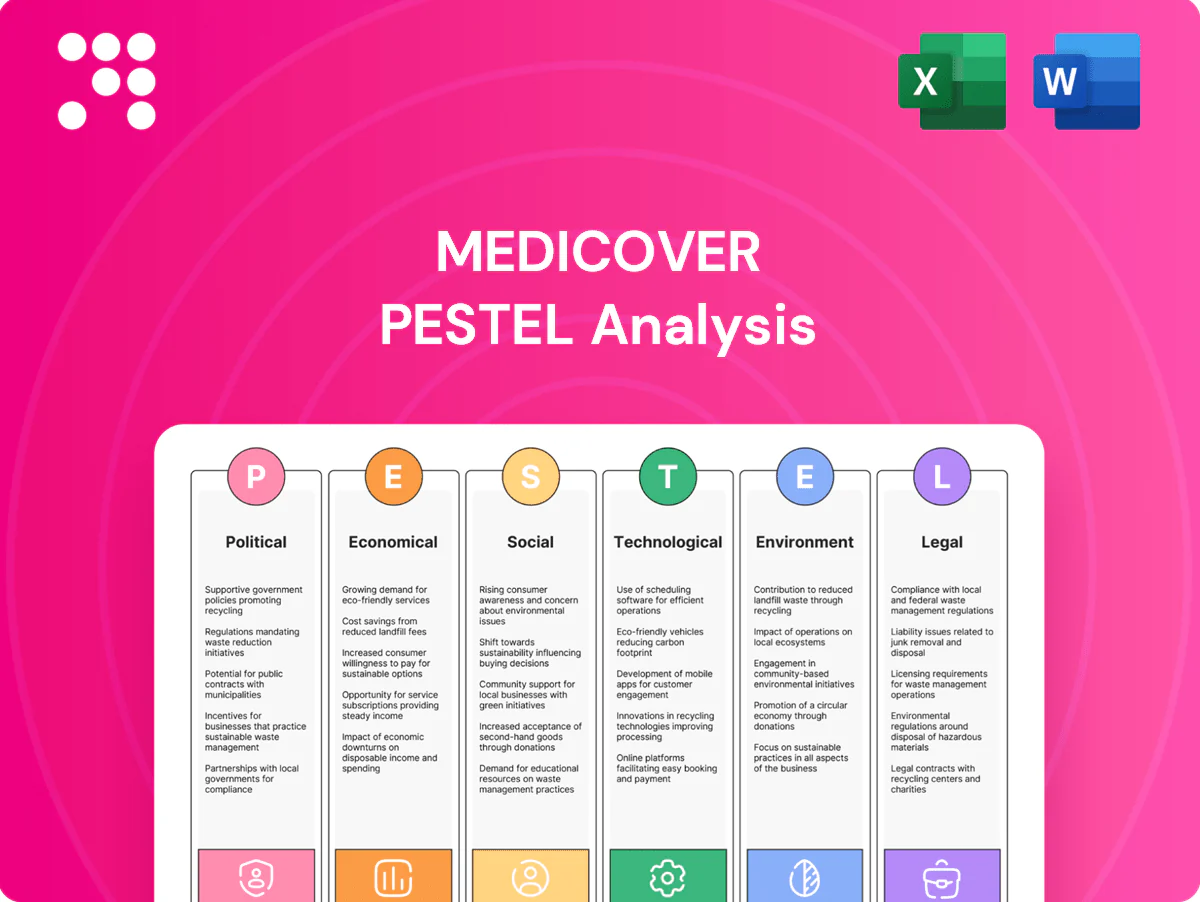
Concise, visually segmented Medicover PESTLE summary that streamlines external risk assessment for meetings and presentations, easily editable for local context and shareable across teams to speed decision-making and strategic alignment.
Economic factors

Macroeconomic cycles and demand
Healthcare is relatively resilient but not immune to GDP slowdowns: IMF projected global growth at 3.1% in 2024, and elective procedures often dip when discretionary household income tightens. Preventive and diagnostic volumes shift with incomes and employer benefits, impacting private-pay segments. Counter-cyclical public spending—boosted across Europe after COVID—helps stabilize demand, and Medicover’s balanced portfolio across hospitals, diagnostics and corporate care reduces overall cyclicality.
Inflation and cost pressures
Rising energy, consumables and medical-supplies prices have compressed Medicover’s margins as cost bases increase; wage inflation for clinical roles remains structurally elevated, driven by staffing shortages and sector competition. Indexation clauses in service contracts and dynamic pricing models partially offset input cost shocks. Procurement scale and increased lab automation improve unit costs and throughput, supporting margin resilience.

Payer mix and affordability
Payer mix varies widely across Medicover markets: EU household out-of-pocket share averaged about 15% in 2022 (Eurostat), forcing market-specific pricing between public, insured and cash patients. Rising private insurance penetration in Central and Eastern Europe and global health-insurance premium growth (~3–4% in 2023) support uptake of premium services. Economic stress raises price sensitivity and bad-debt risk, so tiered, flexible product offerings protect volumes and revenue.

Currency and cross-border exposure
Medicover's multi-country footprint across Central and Eastern Europe and India creates both FX translation and transaction risks as revenues in PL, RO, INR and other currencies are consolidated into reporting currency; imported diagnostic equipment and reagents increase currency sensitivity. Natural hedges from local revenue-cost matching limit volatility, while formal hedging policies and pricing services in local currencies enhance cash-flow predictability.
- Operations: CEE + India exposure
- Imported consumables: raises FX pass-through risk
- Natural hedging: local revenue vs costs
- Mitigants: hedging policies, local-currency pricing
Capital intensity and ROI
Clinics, hospitals and labs demand sustained capex for diagnostic equipment and digital platforms, increasing payback periods; higher policy rates (ECB main rate ~4.00% in Jul 2024) lift WACC and project hurdle rates. Asset-light partnerships and managed services can boost ROI by reducing upfront spend, while rigorous site selection and utilization management shorten payback and improve margins.
- Capex intensity: high
- Interest rates: ECB ~4.00% (Jul 2024)
- Strategy: asset-light partnerships
- Operations: site selection + utilization focus
Tenders and policy reshuffle EU care; spend ~10% GDP, public ~70%
Medicover faces moderate demand resilience with IMF 2024 global growth ~3.1% and EU out-of-pocket ~15% (2022), while private insurance growth ~3–4% (2023) supports premium services. Input inflation (energy, reagents) and wage pressure compress margins; procurement scale and automation partly offset. FX from PL, RO, INR adds volatility; hedging and local pricing mitigate.
| Metric | Value |
|---|---|
| IMF global growth 2024 | 3.1% |
| EU OOP 2022 | ~15% |
| Insurance premium growth 2023 | 3–4% |
| ECB rate Jul 2024 | ~4.00% |
Full Version Awaits
Medicover PESTLE Analysis
The Medicover PESTLE Analysis preview shown here is the exact document you’ll receive after purchase—fully formatted and ready to use. The content, structure, and layout visible are identical to the downloadable file, with no placeholders or surprises. After payment you’ll instantly get this finished, professionally structured report.

Original: $10.00
-65%$10.00
$3.50Product Information
Product Information
Shipping & Returns
Shipping & Returns
Description
Skip the Research. Get the Strategy.
Unlock strategic clarity with our focused PESTLE analysis of Medicover, revealing how political, economic, social, technological, legal and environmental forces shape its trajectory. This concise briefing highlights regulatory risks, market opportunities and tech-driven shifts investors and strategists must know. Purchase the full, editable report to access the complete deep-dive and actionable recommendations instantly.
Political factors
Healthcare policy stability
Government priorities on universal coverage, reimbursement levels, and privatization drive patient volumes and pricing power; EU countries spend around 10% of GDP on health (Eurostat), influencing public versus private demand. Stable policy enables long-term investment in clinics, hospitals and labs, supporting multi-year capex cycles. Policy shifts can quickly redirect demand between public and private providers, so Medicover must align its service mix with evolving national health strategies.
Public reimbursement and tariffs
National health funds and insurer tariffs drive revenue predictability for diagnostics and treatment, with public payers covering roughly 70% of health spending in many European markets in 2024 (OECD-average range). Changes to DRG schedules, test tariffs and co-pay rules directly compress or expand margins by altering unit reimbursement. Negotiation power differs by country and regional authority, affecting contract terms and pricing. Diversifying payer mix mitigates risk from single-system shocks.
PPP and tender dynamics
Access to public contracts for screenings, lab services and hospital ops hinges on transparent tendering; PPP frameworks have helped Medicover and peers scale rapidly, with PPP-backed projects accounting for an estimated 30–40% of new network expansions in Central and Eastern Europe in 2023–24. Bid criteria now prioritize scale, clinical quality metrics and digital capabilities (telehealth/EHR integration), and a strong compliance record materially increases award success rates.
Geopolitical and regulatory fragmentation
Operating across over 10 countries exposes Medicover to sanctions, cross-border licensing and supply-chain redirection; 2024 trade restrictions tied to the Russia–Ukraine conflict forced re-routing of some European medical imports. Divergent national clinical guidelines complicate standardization and raise compliance costs. Political risk also disrupts staffing mobility and capital flows; scenario planning and stress-testing of networks buffers volatility.
- Exposure: over 10 markets
- Supply shock: rerouting due to 2024 Russia–Ukraine disruptions
- Compliance: divergent clinical guidelines raise costs
- Mitigation: scenario planning, stress tests
Healthcare workforce policy
- Immigration rules
- Training subsidies
- Wage floors/caps
- Residency & credential recognition
- Policy engagement
Tenders and policy reshuffle EU care; spend ~10% GDP, public ~70%
Government coverage, reimbursement and privatization shape volumes and pricing, with EU health spend ~10% of GDP (Eurostat 2024) and public payers ~70% of health spending (OECD 2024). Policy shifts and tenders (PPPs 30–40% of network expansion 2023–24) reallocate demand rapidly; cross-border rules and 2024 Russia–Ukraine trade disruptions raise supply and staffing risks.
| Metric | Value | Source/Year |
|---|---|---|
| EU health spend | ~10% GDP | Eurostat 2024 |
| Public payer share | ~70% | OECD 2024 |
| Physicians/nurses per 1k | 3.9 / 8.5 | OECD 2022 |
| PPP expansion | 30–40% | Market 2023–24 |
| Markets | 10+ | Medicover |
What is included in the product
Detailed Word Document
Explores how external macro-environmental factors uniquely affect Medicover across Political, Economic, Social, Technological, Environmental and Legal dimensions, with region- and industry-specific examples. Each section is backed by current data and forward-looking insights to support executives, investors and strategists in identifying threats, opportunities and scenario planning.
Customizable Excel Spreadsheet
Concise, visually segmented Medicover PESTLE summary that streamlines external risk assessment for meetings and presentations, easily editable for local context and shareable across teams to speed decision-making and strategic alignment.
Economic factors
Macroeconomic cycles and demand
Healthcare is relatively resilient but not immune to GDP slowdowns: IMF projected global growth at 3.1% in 2024, and elective procedures often dip when discretionary household income tightens. Preventive and diagnostic volumes shift with incomes and employer benefits, impacting private-pay segments. Counter-cyclical public spending—boosted across Europe after COVID—helps stabilize demand, and Medicover’s balanced portfolio across hospitals, diagnostics and corporate care reduces overall cyclicality.
Inflation and cost pressures
Rising energy, consumables and medical-supplies prices have compressed Medicover’s margins as cost bases increase; wage inflation for clinical roles remains structurally elevated, driven by staffing shortages and sector competition. Indexation clauses in service contracts and dynamic pricing models partially offset input cost shocks. Procurement scale and increased lab automation improve unit costs and throughput, supporting margin resilience.
Payer mix and affordability
Payer mix varies widely across Medicover markets: EU household out-of-pocket share averaged about 15% in 2022 (Eurostat), forcing market-specific pricing between public, insured and cash patients. Rising private insurance penetration in Central and Eastern Europe and global health-insurance premium growth (~3–4% in 2023) support uptake of premium services. Economic stress raises price sensitivity and bad-debt risk, so tiered, flexible product offerings protect volumes and revenue.
Currency and cross-border exposure
Medicover's multi-country footprint across Central and Eastern Europe and India creates both FX translation and transaction risks as revenues in PL, RO, INR and other currencies are consolidated into reporting currency; imported diagnostic equipment and reagents increase currency sensitivity. Natural hedges from local revenue-cost matching limit volatility, while formal hedging policies and pricing services in local currencies enhance cash-flow predictability.
- Operations: CEE + India exposure
- Imported consumables: raises FX pass-through risk
- Natural hedging: local revenue vs costs
- Mitigants: hedging policies, local-currency pricing
Capital intensity and ROI
Clinics, hospitals and labs demand sustained capex for diagnostic equipment and digital platforms, increasing payback periods; higher policy rates (ECB main rate ~4.00% in Jul 2024) lift WACC and project hurdle rates. Asset-light partnerships and managed services can boost ROI by reducing upfront spend, while rigorous site selection and utilization management shorten payback and improve margins.
- Capex intensity: high
- Interest rates: ECB ~4.00% (Jul 2024)
- Strategy: asset-light partnerships
- Operations: site selection + utilization focus
Tenders and policy reshuffle EU care; spend ~10% GDP, public ~70%
Medicover faces moderate demand resilience with IMF 2024 global growth ~3.1% and EU out-of-pocket ~15% (2022), while private insurance growth ~3–4% (2023) supports premium services. Input inflation (energy, reagents) and wage pressure compress margins; procurement scale and automation partly offset. FX from PL, RO, INR adds volatility; hedging and local pricing mitigate.
| Metric | Value |
|---|---|
| IMF global growth 2024 | 3.1% |
| EU OOP 2022 | ~15% |
| Insurance premium growth 2023 | 3–4% |
| ECB rate Jul 2024 | ~4.00% |
Full Version Awaits
Medicover PESTLE Analysis
The Medicover PESTLE Analysis preview shown here is the exact document you’ll receive after purchase—fully formatted and ready to use. The content, structure, and layout visible are identical to the downloadable file, with no placeholders or surprises. After payment you’ll instantly get this finished, professionally structured report.











