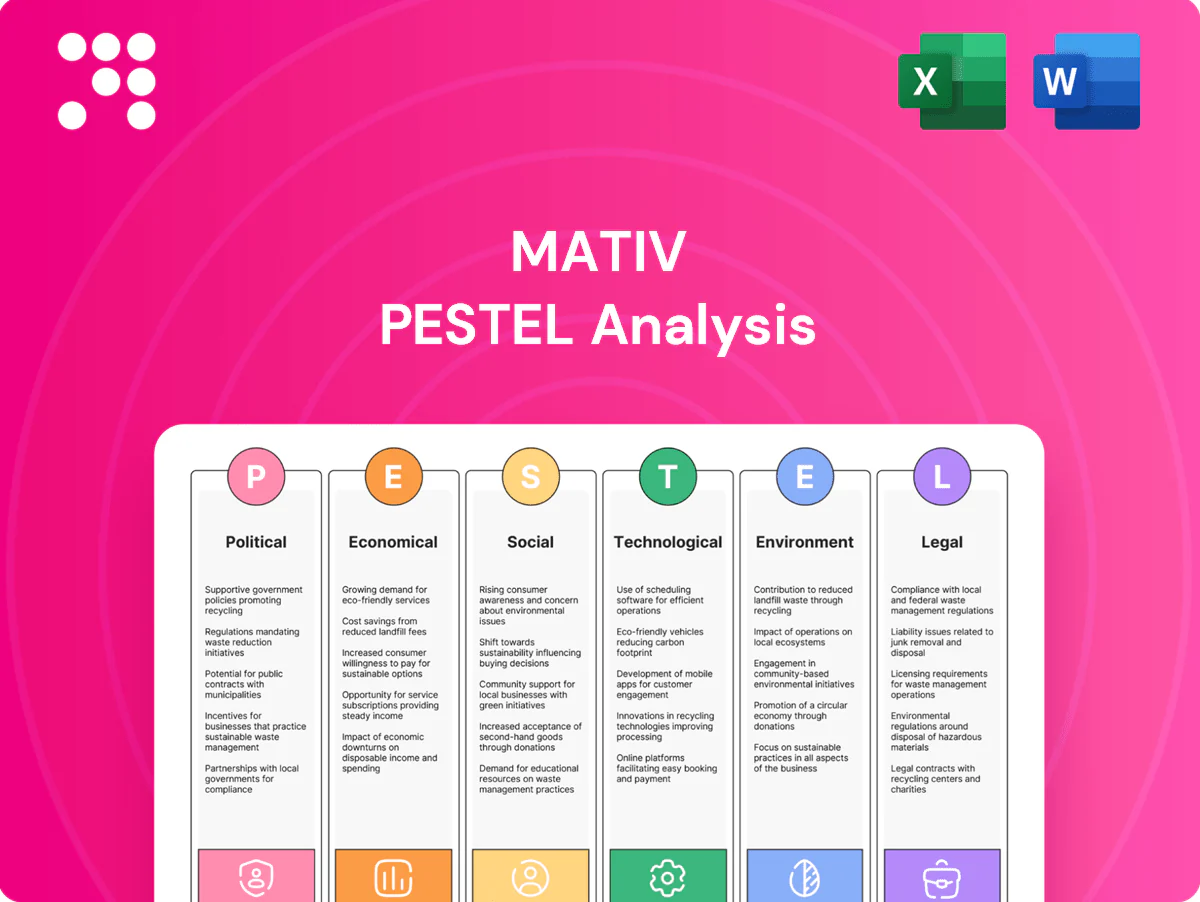
Mativ PESTLE Analysis

Your Shortcut to Market Insight Starts Here
Unlock how political, economic, social, technological, legal, and environmental forces shape Mativ’s strategic outlook with our concise PESTLE summary. Gain practical insights to inform investment and planning decisions. Purchase the full analysis for the complete, editable report and immediate strategic advantage.
Political factors

Trade policy shifts
Mativ faces tariffs, import/export controls and rules‑of‑origin that drive higher costs and longer lead times; Section 301 tariffs on roughly $360 billion of Chinese goods and recent US‑EU‑China frictions have shifted sourcing economics for fibers, resins and chemicals. Proactive rerouting and nearshoring reduce disruption; US incentives like the Inflation Reduction Act (~$369 billion) are reshaping footprint choices.
Geopolitical supply risk
Regional conflicts and sanctions since 2022 (eg Russia/Ukraine) have disrupted logistics and constrained inputs—Russia/Belarus account for ~40% of global potash and Ukraine supplied >70% of semiconductor-grade neon—heightening raw-material risk for filtration and healthcare chains. Governments have imposed export restrictions and prioritized medical inputs. Diversified suppliers, safety stocks, insurance and hedging are critical to manage volatility.

Public procurement rules
Healthcare and infrastructure products often sell through government tenders with strict technical specs; public procurement represents roughly 12–20% of GDP in many countries, making tenders material to revenue. Buy-local clauses and domestic content rules (increasing since 2021) push pricing pressure and can justify local plants to meet requirements. Compliance with transparency and anti-corruption standards is mandatory to access contracts. Long public sales cycles, often 6–18 months, require active policy monitoring to capture demand.

Industrial subsidies
- Lower capex: tax credits/grants
- Competition: EU/US/others reshape advantage
- Co-funding: R&D/automation monitoring
- Risk: clawbacks if milestones missed
Sustainability mandates
Policies such as extended producer responsibility and the EU Packaging and Packaging Waste Regulation shift procurement toward fiber-based and recyclable materials, accelerating demand for Mativ's cellulose and TPU alternatives; global recyclable packaging demand grew ~4–5% in 2023. Public air-quality targets (WHO 2021 guidelines adoption) and a global air filtration market ~USD 18B in 2023 with ~6% CAGR boost filtration-spec demand.
- EPR/PPWR: procurement shift to fiber/recyclables
- Air quality: WHO guidelines → higher filtration uptake
- Decarbonization roadmaps: drive low-carbon specs and certifications
- Early compliance: increases tender wins and preferred-supplier chances
Tariffs on ~$360B, IRA/CHIPS spur nearshoring, boost filtration demand
Mativ faces tariffs on ~360B of Chinese goods, export controls and rising buy‑local rules (public procurement ~12–20% GDP) that shift sourcing and favor nearshoring; IRA ($369B)/CHIPS ($52B)/EU IPCEI (~€20B) incentives reshape capex and footprint choices. EPR/PPWR and WHO air‑quality rules boost demand for recyclable fibers and filtration (global market ~$18B in 2023, ~6% CAGR).
| Risk/Policy | Key Figure |
|---|---|
| Tariffs | ~$360B |
| IRA | $369B |
| CHIPS | $52B |
| Filtration market 2023 | $18B (6% CAGR) |
What is included in the product
 Detailed Word Document
Comprehensive PESTLE analysis of Mativ examining Political, Economic, Social, Technological, Environmental and Legal drivers, backed by current data and trends to identify risks and opportunities, offer forward-looking scenarios, and deliver formatted insights for executives, investors and strategists.

 Customizable Excel Spreadsheet
A concise, visually segmented Mativ PESTLE summary that’s editable and shareable, enabling teams to quickly align on external risks, regulatory impacts and market positioning during meetings, presentations or client reports.
Economic factors

End-market cycles
Mativ’s revenues closely track industrial production, packaging, healthcare and consumer-goods cycles, with slower industrial capex reducing discretionary fiber use while healthcare and filtration remain more resilient. US healthcare spending topped about 4.6 trillion in 2023 and global air/liquid filtration was roughly 38 billion in 2024, underpinning stable demand pockets. The group’s portfolio mix and scenario-based capacity and inventory planning smooth cyclical swings and align supply to demand.
Commodity input volatility
Pulp, specialty fibers, polymers and chemicals face feedstock- and energy-driven swings—energy can account for roughly 25–40% of pulp production cost and feedstock-linked polymers saw price moves up to ~30% between 2022–24. Cost-pass-through clauses and disciplined pricing (industry pass-through commonly 60–90%) have protected margins. Strategic sourcing and formulation flexibility reduce sensitivity, while hedging and inventory optimization balance risk and cash.

FX exposure
Multi-currency operations create translation and transaction risk for Mativ, with FX swings impacting consolidated results across USD, EUR and emerging‑market currencies.
Currency moves affect export competitiveness and input costs; Federal Reserve policy tightening in 2024 (fed funds ~5.25–5.50%) supported a stronger dollar that raised import costs for dollar buyers.
Natural hedges via local sourcing and local‑currency sales stabilize margins, while use of forwards, options and pricing in local currency further mitigates volatility.

Pricing power/mix
High-performance, specification-driven products let Mativ command premium pricing; filtration and healthcare mix shifts raised segment margins industrywide, with global filtration markets growing about 6% CAGR entering 2024. Value-based selling tied to efficiency and sustainability improves retention and ASPs, while overcapacity in commoditized niches depresses prices and forces differentiation.
- Pricing power
- Mix uplift (filtration, healthcare)
- Value-based retention
- Commoditization risk
M&A and consolidation
Specialty materials markets continued consolidating in 2024 to gain scale, technology and customer access, with bolt-on acquisitions accelerating entry into adjacent growth segments while limiting execution risk. Disciplined integration is key to realize cost and revenue synergies without disrupting service; targeted portfolio pruning improves ROIC and strategic focus.
- Scale: consolidation for tech and customer reach
- Bolt-on: faster adjacency entry
- Integration: discipline to capture synergies
- Pruning: boosts ROIC and focus
Tariffs on ~$360B, IRA/CHIPS spur nearshoring, boost filtration demand
Revenues follow industrial cycles; US healthcare ~$4.6T (2023) and global filtration ~$38B (2024) provide resilient demand. Energy/feedstock = ~25–40% of pulp cost; polymers swung ~30% (2022–24) with 60–90% pass-through. Stronger dollar (fed funds ~5.25–5.50% in 2024) raised input costs; local sourcing and hedges mitigate.
| Metric | 2023/24 |
|---|---|
| US healthcare | $4.6T |
| Filtration market | $38B |
| Pulp energy share | 25–40% |
Same Document Delivered
Mativ PESTLE Analysis
The preview shown here is the exact Mativ PESTLE Analysis document you’ll receive after purchase—fully formatted, professionally structured, and ready to use. It includes the same content, layout, and insights displayed. No placeholders or teasers—this is the final file available for immediate download upon checkout.

Original: $10.00
-65%$10.00
$3.50Product Information
Product Information
Shipping & Returns
Shipping & Returns
Description
Your Shortcut to Market Insight Starts Here
Unlock how political, economic, social, technological, legal, and environmental forces shape Mativ’s strategic outlook with our concise PESTLE summary. Gain practical insights to inform investment and planning decisions. Purchase the full analysis for the complete, editable report and immediate strategic advantage.
Political factors
Trade policy shifts
Mativ faces tariffs, import/export controls and rules‑of‑origin that drive higher costs and longer lead times; Section 301 tariffs on roughly $360 billion of Chinese goods and recent US‑EU‑China frictions have shifted sourcing economics for fibers, resins and chemicals. Proactive rerouting and nearshoring reduce disruption; US incentives like the Inflation Reduction Act (~$369 billion) are reshaping footprint choices.
Geopolitical supply risk
Regional conflicts and sanctions since 2022 (eg Russia/Ukraine) have disrupted logistics and constrained inputs—Russia/Belarus account for ~40% of global potash and Ukraine supplied >70% of semiconductor-grade neon—heightening raw-material risk for filtration and healthcare chains. Governments have imposed export restrictions and prioritized medical inputs. Diversified suppliers, safety stocks, insurance and hedging are critical to manage volatility.
Public procurement rules
Healthcare and infrastructure products often sell through government tenders with strict technical specs; public procurement represents roughly 12–20% of GDP in many countries, making tenders material to revenue. Buy-local clauses and domestic content rules (increasing since 2021) push pricing pressure and can justify local plants to meet requirements. Compliance with transparency and anti-corruption standards is mandatory to access contracts. Long public sales cycles, often 6–18 months, require active policy monitoring to capture demand.
Industrial subsidies
- Lower capex: tax credits/grants
- Competition: EU/US/others reshape advantage
- Co-funding: R&D/automation monitoring
- Risk: clawbacks if milestones missed
Sustainability mandates
Policies such as extended producer responsibility and the EU Packaging and Packaging Waste Regulation shift procurement toward fiber-based and recyclable materials, accelerating demand for Mativ's cellulose and TPU alternatives; global recyclable packaging demand grew ~4–5% in 2023. Public air-quality targets (WHO 2021 guidelines adoption) and a global air filtration market ~USD 18B in 2023 with ~6% CAGR boost filtration-spec demand.
- EPR/PPWR: procurement shift to fiber/recyclables
- Air quality: WHO guidelines → higher filtration uptake
- Decarbonization roadmaps: drive low-carbon specs and certifications
- Early compliance: increases tender wins and preferred-supplier chances
Tariffs on ~$360B, IRA/CHIPS spur nearshoring, boost filtration demand
Mativ faces tariffs on ~360B of Chinese goods, export controls and rising buy‑local rules (public procurement ~12–20% GDP) that shift sourcing and favor nearshoring; IRA ($369B)/CHIPS ($52B)/EU IPCEI (~€20B) incentives reshape capex and footprint choices. EPR/PPWR and WHO air‑quality rules boost demand for recyclable fibers and filtration (global market ~$18B in 2023, ~6% CAGR).
| Risk/Policy | Key Figure |
|---|---|
| Tariffs | ~$360B |
| IRA | $369B |
| CHIPS | $52B |
| Filtration market 2023 | $18B (6% CAGR) |
What is included in the product
Detailed Word Document
Comprehensive PESTLE analysis of Mativ examining Political, Economic, Social, Technological, Environmental and Legal drivers, backed by current data and trends to identify risks and opportunities, offer forward-looking scenarios, and deliver formatted insights for executives, investors and strategists.
Customizable Excel Spreadsheet
A concise, visually segmented Mativ PESTLE summary that’s editable and shareable, enabling teams to quickly align on external risks, regulatory impacts and market positioning during meetings, presentations or client reports.
Economic factors
End-market cycles
Mativ’s revenues closely track industrial production, packaging, healthcare and consumer-goods cycles, with slower industrial capex reducing discretionary fiber use while healthcare and filtration remain more resilient. US healthcare spending topped about 4.6 trillion in 2023 and global air/liquid filtration was roughly 38 billion in 2024, underpinning stable demand pockets. The group’s portfolio mix and scenario-based capacity and inventory planning smooth cyclical swings and align supply to demand.
Commodity input volatility
Pulp, specialty fibers, polymers and chemicals face feedstock- and energy-driven swings—energy can account for roughly 25–40% of pulp production cost and feedstock-linked polymers saw price moves up to ~30% between 2022–24. Cost-pass-through clauses and disciplined pricing (industry pass-through commonly 60–90%) have protected margins. Strategic sourcing and formulation flexibility reduce sensitivity, while hedging and inventory optimization balance risk and cash.
FX exposure
Multi-currency operations create translation and transaction risk for Mativ, with FX swings impacting consolidated results across USD, EUR and emerging‑market currencies.
Currency moves affect export competitiveness and input costs; Federal Reserve policy tightening in 2024 (fed funds ~5.25–5.50%) supported a stronger dollar that raised import costs for dollar buyers.
Natural hedges via local sourcing and local‑currency sales stabilize margins, while use of forwards, options and pricing in local currency further mitigates volatility.
Pricing power/mix
High-performance, specification-driven products let Mativ command premium pricing; filtration and healthcare mix shifts raised segment margins industrywide, with global filtration markets growing about 6% CAGR entering 2024. Value-based selling tied to efficiency and sustainability improves retention and ASPs, while overcapacity in commoditized niches depresses prices and forces differentiation.
- Pricing power
- Mix uplift (filtration, healthcare)
- Value-based retention
- Commoditization risk
M&A and consolidation
Specialty materials markets continued consolidating in 2024 to gain scale, technology and customer access, with bolt-on acquisitions accelerating entry into adjacent growth segments while limiting execution risk. Disciplined integration is key to realize cost and revenue synergies without disrupting service; targeted portfolio pruning improves ROIC and strategic focus.
- Scale: consolidation for tech and customer reach
- Bolt-on: faster adjacency entry
- Integration: discipline to capture synergies
- Pruning: boosts ROIC and focus
Tariffs on ~$360B, IRA/CHIPS spur nearshoring, boost filtration demand
Revenues follow industrial cycles; US healthcare ~$4.6T (2023) and global filtration ~$38B (2024) provide resilient demand. Energy/feedstock = ~25–40% of pulp cost; polymers swung ~30% (2022–24) with 60–90% pass-through. Stronger dollar (fed funds ~5.25–5.50% in 2024) raised input costs; local sourcing and hedges mitigate.
| Metric | 2023/24 |
|---|---|
| US healthcare | $4.6T |
| Filtration market | $38B |
| Pulp energy share | 25–40% |
Same Document Delivered
Mativ PESTLE Analysis
The preview shown here is the exact Mativ PESTLE Analysis document you’ll receive after purchase—fully formatted, professionally structured, and ready to use. It includes the same content, layout, and insights displayed. No placeholders or teasers—this is the final file available for immediate download upon checkout.











