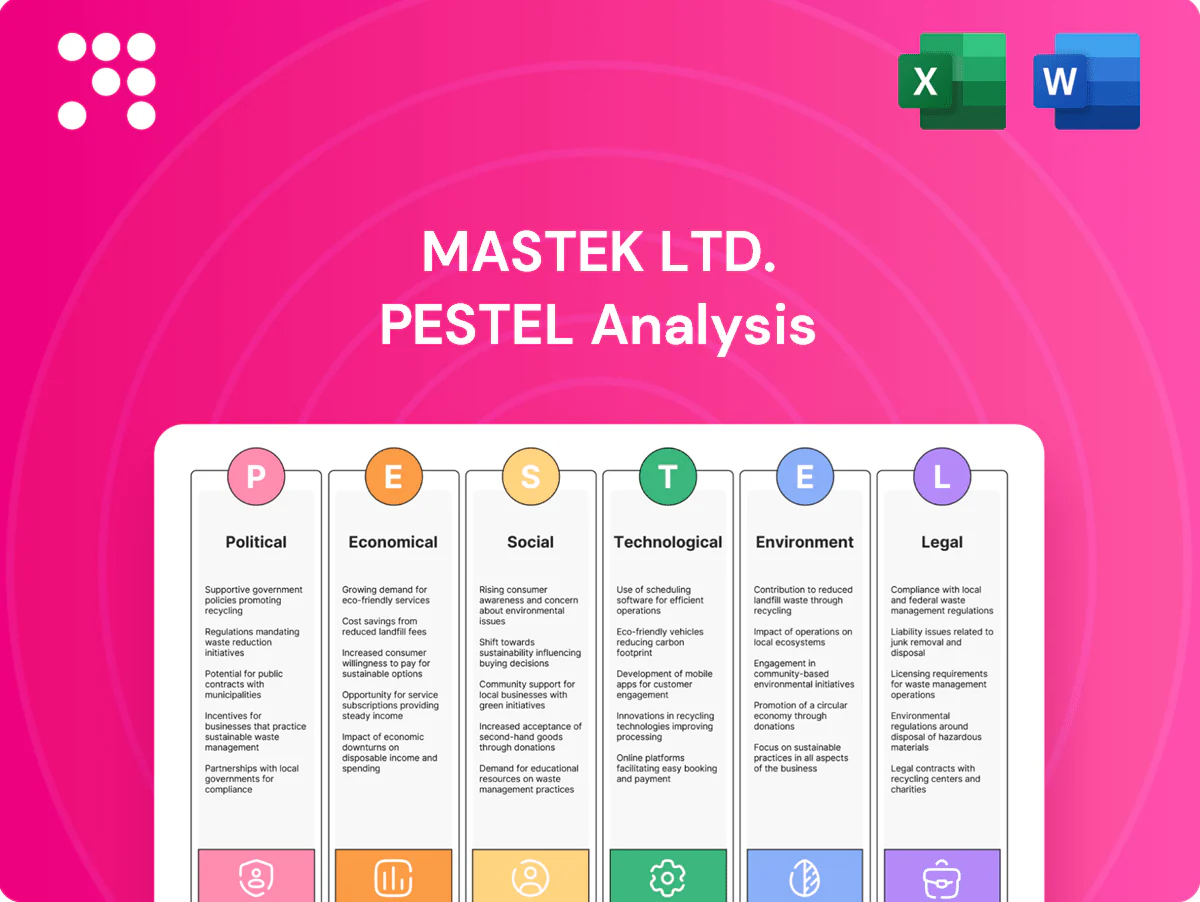
Mastek Ltd. PESTLE Analysis

Your Competitive Advantage Starts with This Report
Discover how political, economic and technological forces are shaping Mastek Ltd.'s strategic path and risk profile. Our concise PESTLE highlights critical threats and opportunities for investors and executives. Use these insights to sharpen strategy and forecasting. Purchase the full analysis for a detailed, ready-to-use report.
Political factors

Public-sector digital agendas
Government digital transformation programs—e.g., Ayushman Bharat Digital Mission with over 500 million health IDs and GST systems averaging ~Rs 1.6 lakh crore monthly receipts in FY2024-25—drive demand across healthcare, citizen services and tax systems. Mastek can align offerings to national priorities and framework agreements; shifts in ruling parties or budget cycles can accelerate or delay contracts. Tracking 3–5 year eGov roadmaps mitigates pipeline volatility.
Geopolitics and cross-border delivery
Trade policies and tighter visa regimes directly constrain onsite staffing and delivery for Mastek, exemplified by the US H-1B cap of 85,000 and heightened immigration scrutiny; India’s IT exports reached about $227 billion in FY24, highlighting scale at stake. Geopolitical tensions between major economies can disrupt market access and partner ecosystems, while nearshoring and distributed delivery models reduce exposure; proactive host-country compliance sustains continuity.

Data sovereignty mandates
Local hosting and in-country processing requirements driven by GDPR (effective 2018) and India’s Digital Personal Data Protection Act 2023 compel Mastek to design cloud architectures with clear data residency controls. Public-sector and regulated clients routinely restrict cross-border flows, forcing region-specific residency options for bids. Strategic partnerships with compliant hyperscalers (AWS, Azure, GCP) enable certified, auditable hosting to meet mandates.

Procurement and vendor eligibility
Public tender norms, localization clauses and past-performance criteria materially affect Mastek’s win rates, with sales cycles commonly taking 12–24 months and framework contracts lasting 3–5 years requiring sustained engagement. Certifications such as ISO/IEC 27001 and CMMI and security clearances are often decisive in shortlistings. Transparent pricing and clear value-for-money metrics improve competitiveness in government bids.
Cyber policy and national security standards
Government cybersecurity baselines and critical‑infrastructure rules (ISO/IEC 27001, NIST SP 800‑207, CERT‑In directives) are driving demand for secure‑by‑design solutions and making Zero Trust architectures table stakes for public tenders; failure to meet these controls can disqualify bidders and block large government contracts. Investment in secure delivery centers enhances Mastek’s credibility in compliance‑sensitive deals.
- Regulatory standards: ISO/IEC 27001, NIST SP 800‑207, CERT‑In
- Procurement risk: non‑compliance can lead to tender disqualification
- Strategic move: secure delivery centers boost trust with government clients
Government digital programs and India IT exports $227B drive demand; H-1B cap 85,000 limits onsite
Government digital programs (Ayushman Bharat 500M IDs; GST receipts ≈Rs 1.6 lakh crore/month FY24‑25) and India IT exports ≈$227B FY24 drive demand; 12–24 month sales cycles and 3–5 year frameworks shape pipeline. H‑1B cap 85,000 and DPDPA 2023 force local delivery/residency. Compliance (ISO/IEC 27001, NIST SP 800‑207, CERT‑In) and transparent pricing decide bids.
| Metric | Value | Impact |
|---|---|---|
| Ayushman Bharat | 500M IDs | Healthcare IT demand |
| GST receipts | ~Rs 1.6L cr/mo | Govt spend pool |
| India IT exports | $227B FY24 | Market scale |
| H‑1B cap | 85,000 | Onsite staffing limits |
What is included in the product
 Detailed Word Document
Explores how political, economic, social, technological, environmental and legal forces uniquely impact Mastek Ltd., with data-backed insights and trend analysis to identify sector-specific risks and opportunities; designed for executives and investors to support strategy, scenario planning and funding discussions.

 Customizable Excel Spreadsheet
Provides a concise, visually segmented PESTLE summary of Mastek Ltd. that’s easy to drop into presentations or strategy folders, supports quick cross-team alignment, and uses simple language for accessible discussion of external risks and market positioning.
Economic factors

IT spending cycles
Macro growth and fiscal positions—IMF projects India GDP ~6.5% in 2025—directly shape client tech budgets, with Gartner citing global IT spending near $5.3 trillion in 2024; counter-cyclical demand for cost-optimization and legacy modernisation often offsets discretionary cuts, helping Mastek sustain revenue. Diversified end-markets smooth volatility, while outcome-based pricing suits ROI-sensitive buyers seeking measurable cost-savings and value delivery.
Currency and margin volatility
Multi-currency revenues against an INR cost base expose Mastek’s earnings to FX swings, increasing margin volatility across quarters. The company leverages natural hedging from offshore delivery hubs and uses forward contracts and options to stabilize margins. Contractual pricing clauses and periodic rate reviews help pass through sharp currency moves. Regional revenue mix determines overall FX sensitivity and hedge effectiveness.

Talent cost inflation
Wage pressures in digital skills—industry salary inflation near 10% in 2024—raise delivery costs and constrain pricing power for Mastek, pressuring operating margins. Pyramid optimization and productivity tools have preserved ~200–300 basis points of margin by shifting work to senior/automation layers. A strong offshore-onshore mix (roughly 80:20) plus automation improves unit economics. Strategic hiring in tier-2 locations can cut hiring cost by ~20–30% versus metros.

Consolidation and partnerships
Consolidation by large integrators raises pricing and talent competition for Mastek but creates partnership niches as acquirers seek regional delivery partners; hyperscalers (AWS 32%, Azure 23%, GCP 11% market share in 2024) amplify co-selling opportunities that accelerate pipeline. Strategic acquisitions can add cloud, digital-commerce and analytics capabilities and immediate client access, while disciplined integration is critical to protect projected value. Co-selling with hyperscalers shortens sales cycles and increases deal size.
- M&A pressure: intensifies competition
- Acquisitions: add capabilities & client access
- Integration: preserves value creation
- Hyperscaler co-selling: speeds pipeline (AWS 32%, Azure 23%, GCP 11% 2024)
Client cost-to-serve and deal structure
Larger managed services and multi-year deals at Mastek increase revenue visibility; Mastek reported consolidated FY24 revenue of INR 2,048 crore, with recurring services growing faster than project fees. Milestone and outcome-linked contracts shift risk-reward to vendors, but Mastek’s performance-linked TCV mix rose to ~38% in FY24. Standardized accelerators cut delivery effort and improve margins; clear TCO narratives shortened client approval cycles by reported 20% in 2024.
- visibility: FY24 revenue INR 2,048 crore
- risk-reward: outcome-linked mix ~38%
- efficiency: accelerators → higher margins
- procurement: TCO narratives cut approval time ~20% (2024)
Government digital programs and India IT exports $227B drive demand; H-1B cap 85,000 limits onsite
India GDP ~6.5% (IMF 2025) and global IT spend ~$5.3T (Gartner 2024) sustain demand for Mastek’s digital services; FY24 revenue INR 2,048 Cr and outcome-linked TCV ~38% boost visibility. Wage inflation ~10% (2024) pressures margins; offshore 80:20 mix and automation mitigate. FX exposure managed via hedges and pricing clauses; regional mix drives sensitivity.
| Metric | Value |
|---|---|
| FY24 Revenue | INR 2,048 Cr |
| Outcome TCV | ~38% |
| Wage Inflation | ~10% (2024) |
Preview Before You Purchase
Mastek Ltd. PESTLE Analysis
The Mastek Ltd. PESTLE analysis preview shown here is the exact document you’ll receive after purchase, fully formatted and ready to use. It covers political, economic, social, technological, legal, and environmental factors affecting Mastek. No placeholders or teasers—this is the final, downloadable file. You’ll get the same structured content and layout immediately after checkout.

Product Information
Product Information
Shipping & Returns
Shipping & Returns
Description
Your Competitive Advantage Starts with This Report
Discover how political, economic and technological forces are shaping Mastek Ltd.'s strategic path and risk profile. Our concise PESTLE highlights critical threats and opportunities for investors and executives. Use these insights to sharpen strategy and forecasting. Purchase the full analysis for a detailed, ready-to-use report.
Political factors
Public-sector digital agendas
Government digital transformation programs—e.g., Ayushman Bharat Digital Mission with over 500 million health IDs and GST systems averaging ~Rs 1.6 lakh crore monthly receipts in FY2024-25—drive demand across healthcare, citizen services and tax systems. Mastek can align offerings to national priorities and framework agreements; shifts in ruling parties or budget cycles can accelerate or delay contracts. Tracking 3–5 year eGov roadmaps mitigates pipeline volatility.
Geopolitics and cross-border delivery
Trade policies and tighter visa regimes directly constrain onsite staffing and delivery for Mastek, exemplified by the US H-1B cap of 85,000 and heightened immigration scrutiny; India’s IT exports reached about $227 billion in FY24, highlighting scale at stake. Geopolitical tensions between major economies can disrupt market access and partner ecosystems, while nearshoring and distributed delivery models reduce exposure; proactive host-country compliance sustains continuity.
Data sovereignty mandates
Local hosting and in-country processing requirements driven by GDPR (effective 2018) and India’s Digital Personal Data Protection Act 2023 compel Mastek to design cloud architectures with clear data residency controls. Public-sector and regulated clients routinely restrict cross-border flows, forcing region-specific residency options for bids. Strategic partnerships with compliant hyperscalers (AWS, Azure, GCP) enable certified, auditable hosting to meet mandates.
Procurement and vendor eligibility
Public tender norms, localization clauses and past-performance criteria materially affect Mastek’s win rates, with sales cycles commonly taking 12–24 months and framework contracts lasting 3–5 years requiring sustained engagement. Certifications such as ISO/IEC 27001 and CMMI and security clearances are often decisive in shortlistings. Transparent pricing and clear value-for-money metrics improve competitiveness in government bids.
Cyber policy and national security standards
Government cybersecurity baselines and critical‑infrastructure rules (ISO/IEC 27001, NIST SP 800‑207, CERT‑In directives) are driving demand for secure‑by‑design solutions and making Zero Trust architectures table stakes for public tenders; failure to meet these controls can disqualify bidders and block large government contracts. Investment in secure delivery centers enhances Mastek’s credibility in compliance‑sensitive deals.
- Regulatory standards: ISO/IEC 27001, NIST SP 800‑207, CERT‑In
- Procurement risk: non‑compliance can lead to tender disqualification
- Strategic move: secure delivery centers boost trust with government clients
Government digital programs and India IT exports $227B drive demand; H-1B cap 85,000 limits onsite
Government digital programs (Ayushman Bharat 500M IDs; GST receipts ≈Rs 1.6 lakh crore/month FY24‑25) and India IT exports ≈$227B FY24 drive demand; 12–24 month sales cycles and 3–5 year frameworks shape pipeline. H‑1B cap 85,000 and DPDPA 2023 force local delivery/residency. Compliance (ISO/IEC 27001, NIST SP 800‑207, CERT‑In) and transparent pricing decide bids.
| Metric | Value | Impact |
|---|---|---|
| Ayushman Bharat | 500M IDs | Healthcare IT demand |
| GST receipts | ~Rs 1.6L cr/mo | Govt spend pool |
| India IT exports | $227B FY24 | Market scale |
| H‑1B cap | 85,000 | Onsite staffing limits |
What is included in the product
Detailed Word Document
Explores how political, economic, social, technological, environmental and legal forces uniquely impact Mastek Ltd., with data-backed insights and trend analysis to identify sector-specific risks and opportunities; designed for executives and investors to support strategy, scenario planning and funding discussions.
Customizable Excel Spreadsheet
Provides a concise, visually segmented PESTLE summary of Mastek Ltd. that’s easy to drop into presentations or strategy folders, supports quick cross-team alignment, and uses simple language for accessible discussion of external risks and market positioning.
Economic factors
IT spending cycles
Macro growth and fiscal positions—IMF projects India GDP ~6.5% in 2025—directly shape client tech budgets, with Gartner citing global IT spending near $5.3 trillion in 2024; counter-cyclical demand for cost-optimization and legacy modernisation often offsets discretionary cuts, helping Mastek sustain revenue. Diversified end-markets smooth volatility, while outcome-based pricing suits ROI-sensitive buyers seeking measurable cost-savings and value delivery.
Currency and margin volatility
Multi-currency revenues against an INR cost base expose Mastek’s earnings to FX swings, increasing margin volatility across quarters. The company leverages natural hedging from offshore delivery hubs and uses forward contracts and options to stabilize margins. Contractual pricing clauses and periodic rate reviews help pass through sharp currency moves. Regional revenue mix determines overall FX sensitivity and hedge effectiveness.
Talent cost inflation
Wage pressures in digital skills—industry salary inflation near 10% in 2024—raise delivery costs and constrain pricing power for Mastek, pressuring operating margins. Pyramid optimization and productivity tools have preserved ~200–300 basis points of margin by shifting work to senior/automation layers. A strong offshore-onshore mix (roughly 80:20) plus automation improves unit economics. Strategic hiring in tier-2 locations can cut hiring cost by ~20–30% versus metros.
Consolidation and partnerships
Consolidation by large integrators raises pricing and talent competition for Mastek but creates partnership niches as acquirers seek regional delivery partners; hyperscalers (AWS 32%, Azure 23%, GCP 11% market share in 2024) amplify co-selling opportunities that accelerate pipeline. Strategic acquisitions can add cloud, digital-commerce and analytics capabilities and immediate client access, while disciplined integration is critical to protect projected value. Co-selling with hyperscalers shortens sales cycles and increases deal size.
- M&A pressure: intensifies competition
- Acquisitions: add capabilities & client access
- Integration: preserves value creation
- Hyperscaler co-selling: speeds pipeline (AWS 32%, Azure 23%, GCP 11% 2024)
Client cost-to-serve and deal structure
Larger managed services and multi-year deals at Mastek increase revenue visibility; Mastek reported consolidated FY24 revenue of INR 2,048 crore, with recurring services growing faster than project fees. Milestone and outcome-linked contracts shift risk-reward to vendors, but Mastek’s performance-linked TCV mix rose to ~38% in FY24. Standardized accelerators cut delivery effort and improve margins; clear TCO narratives shortened client approval cycles by reported 20% in 2024.
- visibility: FY24 revenue INR 2,048 crore
- risk-reward: outcome-linked mix ~38%
- efficiency: accelerators → higher margins
- procurement: TCO narratives cut approval time ~20% (2024)
Government digital programs and India IT exports $227B drive demand; H-1B cap 85,000 limits onsite
India GDP ~6.5% (IMF 2025) and global IT spend ~$5.3T (Gartner 2024) sustain demand for Mastek’s digital services; FY24 revenue INR 2,048 Cr and outcome-linked TCV ~38% boost visibility. Wage inflation ~10% (2024) pressures margins; offshore 80:20 mix and automation mitigate. FX exposure managed via hedges and pricing clauses; regional mix drives sensitivity.
| Metric | Value |
|---|---|
| FY24 Revenue | INR 2,048 Cr |
| Outcome TCV | ~38% |
| Wage Inflation | ~10% (2024) |
Preview Before You Purchase
Mastek Ltd. PESTLE Analysis
The Mastek Ltd. PESTLE analysis preview shown here is the exact document you’ll receive after purchase, fully formatted and ready to use. It covers political, economic, social, technological, legal, and environmental factors affecting Mastek. No placeholders or teasers—this is the final, downloadable file. You’ll get the same structured content and layout immediately after checkout.











