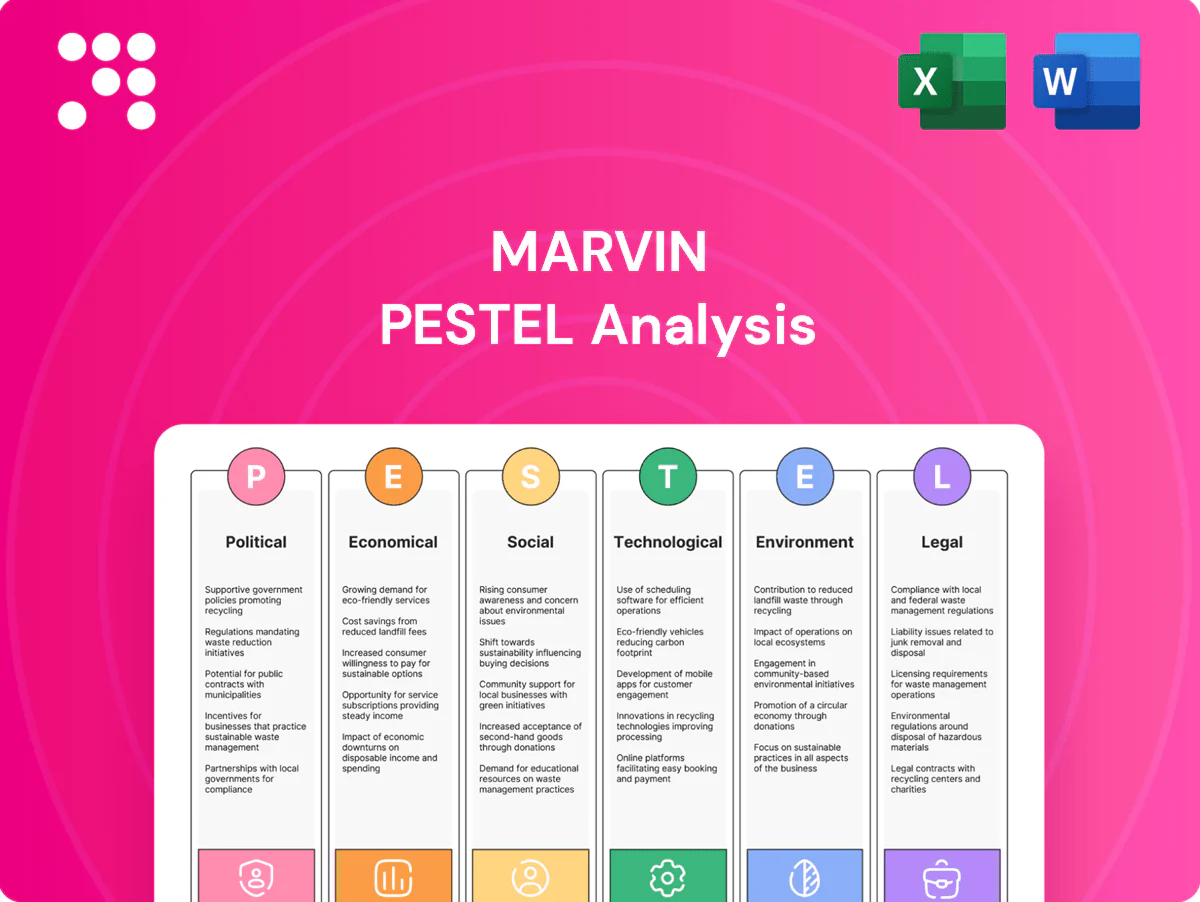
Marvin PESTLE Analysis

Your Shortcut to Market Insight Starts Here
Discover how political shifts, economic trends, social behaviors, technological advances, legal changes, and environmental factors converge to shape Marvin’s strategic outlook in our concise PESTLE snapshot. This actionable brief highlights key risks and growth levers—buy the full PESTLE Analysis for a detailed, ready-to-use roadmap and data you can trust.
Political factors

Trade policy and material tariffs
Import duties — notably Section 232 aluminum at 10% and Section 301 tariffs up to 25% on many hardware components — can raise Marvin’s input costs and force sourcing changes. Policy shifts between major economies have pushed lead times up 20–40% and prompted inventory buffers of 60–90 days for many manufacturers. Proactive supplier diversification (54% of firms reported diversification moves by 2024), hedging strategies, and industry advocacy (trade groups lobbying for tariff relief) mitigate volatility.
Housing and infrastructure incentives
Federal programs such as the Inflation Reduction Act (about $369 billion for clean energy) and the 2021 Infrastructure Investment and Jobs Act ($1.2 trillion) boost housing starts and energy retrofits, increasing demand for windows and doors. Tax credits like the Residential Clean Energy Credit (30% for qualifying installations) and the Energy Efficient Home Improvement Credit (up to $1,200) shift mix toward high-efficiency SKUs. Public procurement and green building standards increasingly require domestically sourced or certified products, so tracking policy pipelines is essential to align product certification and manufacturing capacity.

Building code modernization agendas
Government-backed updates to resilience and energy codes are raising performance baselines; buildings account for ~40% of global energy use and ~36% of CO2 emissions (IEA 2023). Storm, wildfire and coastal rules follow rising losses—US had 28 weather disasters exceeding $1B in 2023, totaling about $74B (NOAA). Timely certification keeps products listed in public projects worth billions annually, and active code hearing engagement secures practical compliance paths.

Labor and workforce policy
Labor and workforce policy—apprenticeship funding, immigration rules, and prevailing wage laws—directly shape factory and installer availability; the US unemployment rate averaged 3.8% in 2024 (BLS), keeping markets tight and slowing installations via dealer networks. Participation in workforce programs and policy-driven training grants help stabilize capacity and offset upskilling costs.
- Apprenticeship funding: expands installer pipeline
- Immigration rules: affect skilled labor supply
- Prevailing wage laws: raise labor costs
- Workforce programs: stabilize capacity, reduce delays
Environmental policy direction
Decarbonization roadmaps and strengthened public procurement rules (public procurement ≈14% of EU GDP) are accelerating demand for low‑embodied‑carbon products as governments push net‑zero by 2050; lifecycle costing clauses favor lower emissions. Extended producer responsibility debates are expanding obligations on packaging and recycling across markets. Compliance increasingly differentiates bids in public tenders and early alignment cuts retrofit costs and reputational exposure.
- Procurement share: ≈14% EU GDP
- Net‑zero target: EU 2050
- EPR scope: expanding packaging/recycling obligations
- Compliance: tender differentiator, reduces retrofit/reputation risk
Tariffs prompt 60-90 day buffers; clean energy boost $1.2T
Tariffs (Section 232 10%, Section 301 up to 25%) and policy shifts raised lead times 20–40% and drove 60–90 day inventory buffers; 54% of firms diversified by 2024. IRA $369B and IIJA $1.2T plus credits (30% clean energy; $1,200 EE) boost demand. Buildings ~40% energy use/36% CO2; 28 US billion‑dollar disasters in 2023 ($74B). Unemployment 3.8% (2024) tightens labor supply.
| Metric | Value |
|---|---|
| Tariffs | 10% / up to 25% |
| Inventory buffers | 60–90 days |
| Diversification | 54% (2024) |
| IRA / IIJA | $369B / $1.2T |
What is included in the product
 Detailed Word Document
Explores how external macro-environmental factors uniquely affect Marvin across Political, Economic, Social, Technological, Environmental and Legal dimensions; backed by current data and trends, it provides region- and industry-specific insights to help executives, investors and strategists identify risks, opportunities and support scenario planning and funding pitches.

 Customizable Excel Spreadsheet
Marvin PESTLE Analysis compresses complex external risk factors into a visually segmented, concise summary that's easy to drop into presentations or share across teams. Editable notes and clear language streamline alignment and decision-making during planning sessions.
Economic factors

Interest rates and housing cycles
Mortgage rates around 7% in mid-2025 directly reduce new residential construction and remodeling activity by raising borrowing costs and cutting buyer affordability. Higher rates delay projects and compress dealer throughput as orders are pushed out; retrofit and commercial work have helped partially offset declines by shifting demand to repairs and nonresidential contracts. Flexible production scheduling preserved margins for many manufacturers and contractors across the 2024–25 housing cycle.
Commodity and input cost volatility
Fluctuations in lumber (prices down ~40% from 2021 peaks) and 2024 Y/Y rises in aluminum (~+12%) and resins (~+8%) plus volatile glass and freight (spot freight saw ~15% H2 2024 spikes) materially shift unit economics. Surcharges and dynamic pricing recover short-term cost shocks but can cut demand if elasticity is high. Strategic inventory buys and supplier contracts covering 60–80% of volumes smooth COGS. Value engineering has reduced material intensity 10–15% while preserving performance.

Labor availability and wage inflation
Skilled manufacturing and installation labor remains tight, with US manufacturing employment near 12.9 million in 2024 and average hourly earnings up roughly 4% YoY, lifting costs and lead times. Automation and standardized install kits can cut labor hours and improve throughput. Dealer training raises first-time-right rates and reduces costly call-backs. Regular compensation benchmarking helps retain critical installers and technicians.

Channel health and dealer margins
Independent dealers' working capital and turnover directly drive Marvin sell-through; industry inventory turns averaged about 4.0x in 2024, with dealer working capital days near 75, constraining SKU breadth and promotions. Transparent incentives and point‑of‑sale financing (average dealer co-op funding ~2–3% of sales) enabled showroom upgrades and higher AURs in 2024–25. Digital leads rose ~20% YoY in 2024, and co-op marketing improved local capture while balanced territory assignment limited channel conflict.
- dealer-working-capital-days ~75 (2024)
- inventory-turns ~4.0x (2024)
- co-op-funding ~2–3% of sales
- digital-leads +20% YoY (2024)
FX and cross-border sourcing
Currency swings drive component import costs and export competitiveness; the dollar experienced roughly a 10% swing versus major currencies 2022–24, amplifying cost pass-through risk. Natural hedges and multi-currency contracts have cut reported earnings volatility for peers by up to mid-single digits. Dual-sourcing critical SKUs reduces single‑site disruption, while strict pricing governance preserves margin discipline across markets.
- FX exposure: DXY ~±10% (2022–24)
- Hedging: multi-currency contracts, natural hedges
- Supply resilience: dual-sourcing critical SKUs
- Pricing: centralized governance to protect margins
Tariffs prompt 60-90 day buffers; clean energy boost $1.2T
Higher mortgage rates (~7% mid‑2025) and tight labor (avg hourly earnings +4% YoY 2024) compress new-build demand and raise install costs, while retrofit and commercial work partially offset volumes. Material swings (lumber -40% vs 2021; Al +12% Y/Y 2024) and freight volatility shift unit economics. Dealer liquidity (inventory turns ~4.0x; W/C days ~75) and FX (DXY ±10% 2022–24) drive pricing and margin risk.
| Metric | Value |
|---|---|
| Mortgage rate | ~7% (mid‑2025) |
| Lumber vs 2021 | -40% |
| Aluminum 2024 | +12% Y/Y |
| Inventory turns (2024) | ~4.0x |
| Dealer W/C days (2024) | ~75 |
| Digital leads (2024) | +20% YoY |
| FX DXY (2022–24) | ±10% |
Preview Before You Purchase
Marvin PESTLE Analysis
The preview shown here is the exact Marvin PESTLE Analysis document you’ll receive after purchase—fully formatted, professionally structured, and ready to use. No placeholders or teasers: the content, layout, and headings match the downloadable file you’ll get instantly after payment. What you see is the finished product you’ll own and can apply immediately.

Original: $10.00
-65%$10.00
$3.50Product Information
Product Information
Shipping & Returns
Shipping & Returns
Description
Your Shortcut to Market Insight Starts Here
Discover how political shifts, economic trends, social behaviors, technological advances, legal changes, and environmental factors converge to shape Marvin’s strategic outlook in our concise PESTLE snapshot. This actionable brief highlights key risks and growth levers—buy the full PESTLE Analysis for a detailed, ready-to-use roadmap and data you can trust.
Political factors
Trade policy and material tariffs
Import duties — notably Section 232 aluminum at 10% and Section 301 tariffs up to 25% on many hardware components — can raise Marvin’s input costs and force sourcing changes. Policy shifts between major economies have pushed lead times up 20–40% and prompted inventory buffers of 60–90 days for many manufacturers. Proactive supplier diversification (54% of firms reported diversification moves by 2024), hedging strategies, and industry advocacy (trade groups lobbying for tariff relief) mitigate volatility.
Housing and infrastructure incentives
Federal programs such as the Inflation Reduction Act (about $369 billion for clean energy) and the 2021 Infrastructure Investment and Jobs Act ($1.2 trillion) boost housing starts and energy retrofits, increasing demand for windows and doors. Tax credits like the Residential Clean Energy Credit (30% for qualifying installations) and the Energy Efficient Home Improvement Credit (up to $1,200) shift mix toward high-efficiency SKUs. Public procurement and green building standards increasingly require domestically sourced or certified products, so tracking policy pipelines is essential to align product certification and manufacturing capacity.
Building code modernization agendas
Government-backed updates to resilience and energy codes are raising performance baselines; buildings account for ~40% of global energy use and ~36% of CO2 emissions (IEA 2023). Storm, wildfire and coastal rules follow rising losses—US had 28 weather disasters exceeding $1B in 2023, totaling about $74B (NOAA). Timely certification keeps products listed in public projects worth billions annually, and active code hearing engagement secures practical compliance paths.
Labor and workforce policy
Labor and workforce policy—apprenticeship funding, immigration rules, and prevailing wage laws—directly shape factory and installer availability; the US unemployment rate averaged 3.8% in 2024 (BLS), keeping markets tight and slowing installations via dealer networks. Participation in workforce programs and policy-driven training grants help stabilize capacity and offset upskilling costs.
- Apprenticeship funding: expands installer pipeline
- Immigration rules: affect skilled labor supply
- Prevailing wage laws: raise labor costs
- Workforce programs: stabilize capacity, reduce delays
Environmental policy direction
Decarbonization roadmaps and strengthened public procurement rules (public procurement ≈14% of EU GDP) are accelerating demand for low‑embodied‑carbon products as governments push net‑zero by 2050; lifecycle costing clauses favor lower emissions. Extended producer responsibility debates are expanding obligations on packaging and recycling across markets. Compliance increasingly differentiates bids in public tenders and early alignment cuts retrofit costs and reputational exposure.
- Procurement share: ≈14% EU GDP
- Net‑zero target: EU 2050
- EPR scope: expanding packaging/recycling obligations
- Compliance: tender differentiator, reduces retrofit/reputation risk
Tariffs prompt 60-90 day buffers; clean energy boost $1.2T
Tariffs (Section 232 10%, Section 301 up to 25%) and policy shifts raised lead times 20–40% and drove 60–90 day inventory buffers; 54% of firms diversified by 2024. IRA $369B and IIJA $1.2T plus credits (30% clean energy; $1,200 EE) boost demand. Buildings ~40% energy use/36% CO2; 28 US billion‑dollar disasters in 2023 ($74B). Unemployment 3.8% (2024) tightens labor supply.
| Metric | Value |
|---|---|
| Tariffs | 10% / up to 25% |
| Inventory buffers | 60–90 days |
| Diversification | 54% (2024) |
| IRA / IIJA | $369B / $1.2T |
What is included in the product
Detailed Word Document
Explores how external macro-environmental factors uniquely affect Marvin across Political, Economic, Social, Technological, Environmental and Legal dimensions; backed by current data and trends, it provides region- and industry-specific insights to help executives, investors and strategists identify risks, opportunities and support scenario planning and funding pitches.
Customizable Excel Spreadsheet
Marvin PESTLE Analysis compresses complex external risk factors into a visually segmented, concise summary that's easy to drop into presentations or share across teams. Editable notes and clear language streamline alignment and decision-making during planning sessions.
Economic factors
Interest rates and housing cycles
Mortgage rates around 7% in mid-2025 directly reduce new residential construction and remodeling activity by raising borrowing costs and cutting buyer affordability. Higher rates delay projects and compress dealer throughput as orders are pushed out; retrofit and commercial work have helped partially offset declines by shifting demand to repairs and nonresidential contracts. Flexible production scheduling preserved margins for many manufacturers and contractors across the 2024–25 housing cycle.
Commodity and input cost volatility
Fluctuations in lumber (prices down ~40% from 2021 peaks) and 2024 Y/Y rises in aluminum (~+12%) and resins (~+8%) plus volatile glass and freight (spot freight saw ~15% H2 2024 spikes) materially shift unit economics. Surcharges and dynamic pricing recover short-term cost shocks but can cut demand if elasticity is high. Strategic inventory buys and supplier contracts covering 60–80% of volumes smooth COGS. Value engineering has reduced material intensity 10–15% while preserving performance.
Labor availability and wage inflation
Skilled manufacturing and installation labor remains tight, with US manufacturing employment near 12.9 million in 2024 and average hourly earnings up roughly 4% YoY, lifting costs and lead times. Automation and standardized install kits can cut labor hours and improve throughput. Dealer training raises first-time-right rates and reduces costly call-backs. Regular compensation benchmarking helps retain critical installers and technicians.
Channel health and dealer margins
Independent dealers' working capital and turnover directly drive Marvin sell-through; industry inventory turns averaged about 4.0x in 2024, with dealer working capital days near 75, constraining SKU breadth and promotions. Transparent incentives and point‑of‑sale financing (average dealer co-op funding ~2–3% of sales) enabled showroom upgrades and higher AURs in 2024–25. Digital leads rose ~20% YoY in 2024, and co-op marketing improved local capture while balanced territory assignment limited channel conflict.
- dealer-working-capital-days ~75 (2024)
- inventory-turns ~4.0x (2024)
- co-op-funding ~2–3% of sales
- digital-leads +20% YoY (2024)
FX and cross-border sourcing
Currency swings drive component import costs and export competitiveness; the dollar experienced roughly a 10% swing versus major currencies 2022–24, amplifying cost pass-through risk. Natural hedges and multi-currency contracts have cut reported earnings volatility for peers by up to mid-single digits. Dual-sourcing critical SKUs reduces single‑site disruption, while strict pricing governance preserves margin discipline across markets.
- FX exposure: DXY ~±10% (2022–24)
- Hedging: multi-currency contracts, natural hedges
- Supply resilience: dual-sourcing critical SKUs
- Pricing: centralized governance to protect margins
Tariffs prompt 60-90 day buffers; clean energy boost $1.2T
Higher mortgage rates (~7% mid‑2025) and tight labor (avg hourly earnings +4% YoY 2024) compress new-build demand and raise install costs, while retrofit and commercial work partially offset volumes. Material swings (lumber -40% vs 2021; Al +12% Y/Y 2024) and freight volatility shift unit economics. Dealer liquidity (inventory turns ~4.0x; W/C days ~75) and FX (DXY ±10% 2022–24) drive pricing and margin risk.
| Metric | Value |
|---|---|
| Mortgage rate | ~7% (mid‑2025) |
| Lumber vs 2021 | -40% |
| Aluminum 2024 | +12% Y/Y |
| Inventory turns (2024) | ~4.0x |
| Dealer W/C days (2024) | ~75 |
| Digital leads (2024) | +20% YoY |
| FX DXY (2022–24) | ±10% |
Preview Before You Purchase
Marvin PESTLE Analysis
The preview shown here is the exact Marvin PESTLE Analysis document you’ll receive after purchase—fully formatted, professionally structured, and ready to use. No placeholders or teasers: the content, layout, and headings match the downloadable file you’ll get instantly after payment. What you see is the finished product you’ll own and can apply immediately.











