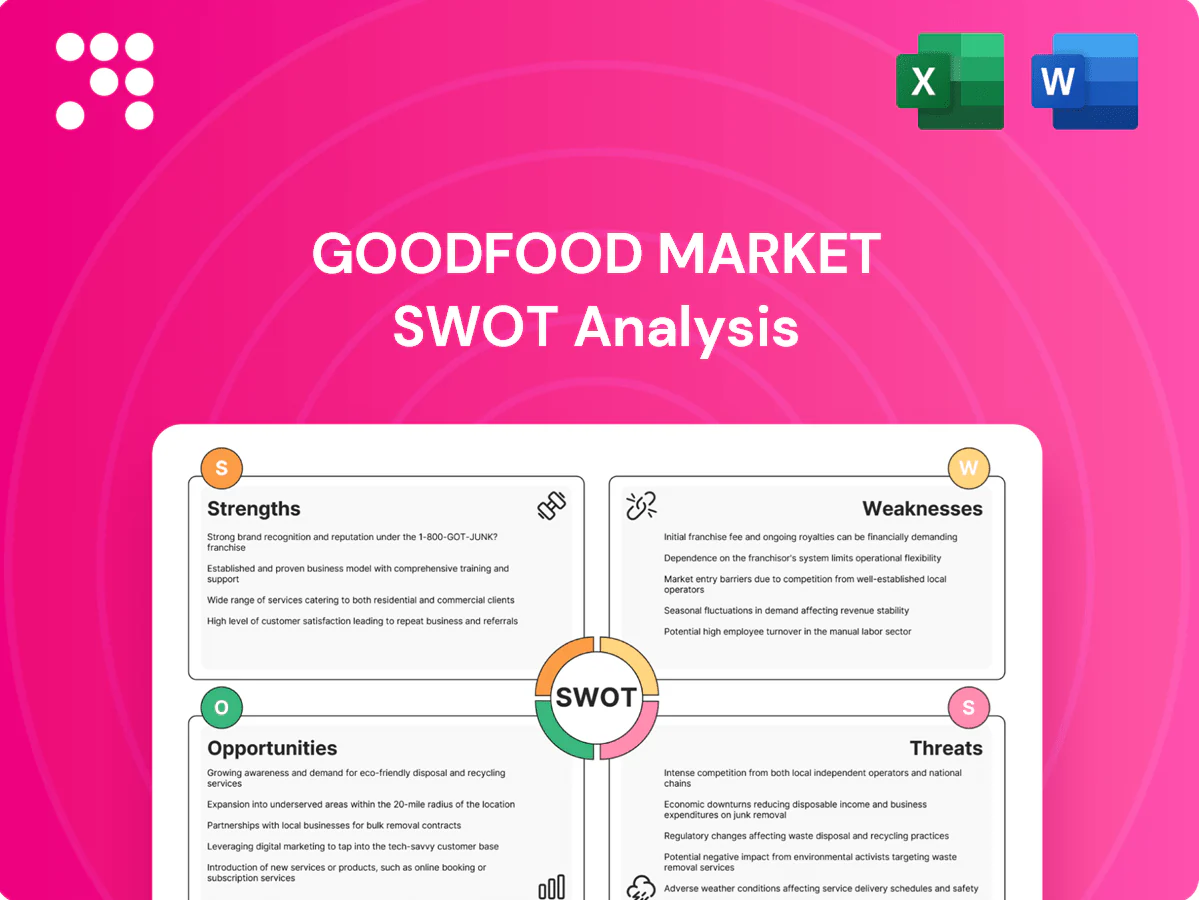
Goodfood Market SWOT Analysis

Dive Deeper Into the Company’s Strategic Blueprint
Goodfood Market’s snapshot shows clear strengths in customer retention and e-commerce logistics, but rising competition and margin pressure create near-term risks; operational scalability and product differentiation are pivotal to watch. Want the full story behind growth drivers, financial sensitivity, and tactical recommendations? Purchase the complete SWOT analysis to get a professionally written, editable report and Excel model for strategy and investment decisions.
Strengths

Recognized Canadian meal-kit brand
Recognized Canadian meal-kit brand (founded 2014, TSX-listed 2017) drives strong recall in urban markets, supporting acquisition and retention; Goodfood reported roughly 320,000 active customers in 2024, boosting recurring revenue. Trust in freshness and recipe quality reduces perceived switching risk, while word-of-mouth and positive reviews lower effective CAC over time. Brand equity facilitates cross-selling of new grocery SKUs into an engaged customer base.
Integrated meal kits and online groceries
Combining curated meal kits with an expanded online grocery assortment increases average basket size and order frequency by letting customers solve multiple needs in one checkout, boosting convenience and retention. This mix diversifies revenue away from kits’ seasonality, improves inventory turns through cross-selling and fresher SKU rotation, and enhances margin mix as higher-margin grocery items complement kit profitability.

Convenience and reduced food waste value
Pre-portioned ingredients cut prep time and minimize leftovers, supporting Goodfood’s value proposition to busy households; the company reported serving over 300,000 active subscribers in 2024, highlighting scale. Clear, step-by-step recipes lower cooking friction for novices, boosting adoption. Reduced waste resonates with sustainability-minded consumers and can increase perceived value and loyalty, aiding repeat-order rates and customer lifetime value.

Data-driven menus and personalization
Data-driven menu iteration from ratings and order history raises satisfaction and repeat orders; personalization nudges have been shown to lift attach rates 10–30% and lower churn, while demand forecasting can cut spoilage by ~15–20%, improving gross margins. Over time these insights enable targeted private-label launches with higher margin capture and SKU rationalization.
Urban fulfillment and last-mile capabilities
Urban fulfillment and last-mile capabilities place Goodfood close to dense customer clusters, shortening delivery windows and improving freshness, which boosts NPS and repeat purchase rates. Higher route density in metro areas reduces per-order delivery cost and supports profitably scaling same-day options. Localized operations enable rapid assortment testing and faster SKU iterations to match neighborhood preferences.
- Proximity: shorter delivery windows
- Freshness: higher NPS and repeats
- Cost: lower per-order delivery
- Agility: rapid local assortment testing
Meal-kit with ~320,000 customers lifts margins via personalization
Recognized Canadian meal-kit brand (founded 2014, TSX-listed 2017) with ~320,000 active customers in 2024 drives recurring revenue and cross-sell. Data-led personalization lifts attach rates 10–30% and forecasting cuts spoilage ~15–20%, improving margins. Urban fulfillment shortens delivery windows, lowering per-order cost and boosting repeat purchase rates.
| Metric | Value |
|---|---|
| Active customers (2024) | ~320,000 |
| Personalization uplift | 10–30% |
| Spoilage reduction | ~15–20% |
What is included in the product
 Detailed Word Document
Provides a concise strategic SWOT overview of Goodfood Market, highlighting internal strengths and weaknesses and external opportunities and threats to assess its competitive position and growth prospects.

 Customizable Excel Spreadsheet
Provides a focused SWOT matrix summarizing Goodfood Market’s strengths, weaknesses, opportunities, and threats for rapid strategic alignment and stakeholder-ready presentations.
Weaknesses

Thin margins and cost intensity
Meal kits and last-mile delivery are inherently low-margin businesses, and Goodfood’s unit economics are pressured by packaging, refrigerated transport and labor costs. These cost drivers make profitability vulnerable to small demand shocks and input-price swings. Scaling profitably therefore depends on disciplined cost control, higher order frequency and mix improvement toward higher-margin SKUs.
High customer churn risk
Subscriptions on Goodfood (FOOD.TO) can be paused or canceled easily, contributing to high churn risk; active customers stood around 300,000 in FY2024, making cohort stability pivotal. Price promotions frequently draw deal-seekers with lower LTV, pressuring margins. Menu fatigue and limited novelty can erode engagement over weeks. Continuous product innovation and loyalty levers are required to stabilize cohorts and lift retention.

Limited geographic footprint
Goodfood’s Canada-only footprint limits its total addressable market to roughly 39.6 million people (2024) and a domestic grocery retail market near CAD 120 billion (2023), capping near-term scale. Sparse northern and Atlantic regions increase per-delivery costs and operational complexity. Cross-border expansion into the US (≈330 million population) faces regulatory, fulfillment and tariff hurdles. Near-term growth likely depends on deeper Canadian penetration rather than wide geographic expansion.

Dependence on third-party logistics
Dependence on third-party carriers exposes Goodfood to on-time delivery failures and cold-chain breaks that can spoil perishable shipments and damage brand trust. Variable carrier service levels translate into inconsistent customer experiences and higher churn risk. Peak-season capacity constraints drive up spot rates and delivery costs, while building owned last-mile capability would require significant capital investment and operating scale.
- third-party carriers -> delivery & cold-chain risk
- service variability -> customer experience hit
- peak capacity -> higher seasonal costs
- owned last-mile -> capital intensive
Price sensitivity versus grocers
Traditional supermarkets frequently undercut delivered meal cost-per-serving, and budget-conscious consumers often view meal kits as discretionary; Statistics Canada reported food price inflation of about 4.5% in 2024, which magnifies trade-down behavior and forces Goodfood to make value communication that offsets headline price comparisons.
- price pressure: supermarkets cheaper per-serving
- consumer behavior: kits seen as discretionary
- inflation impact: 4.5% food inflation (2024)
- response need: stronger value messaging vs headline prices
Meal-kit margins squeezed; churn ≈300k, 4.5%
Goodfood’s low-margin meal-kit model is squeezed by packaging, refrigerated transport and labour, making profitability sensitive to demand shocks. High subscription churn (≈300,000 active customers in FY2024) and promotion-driven deal-seekers depress LTV; menu fatigue risks engagement. Canada-only footprint (39.6M pop, TAM CAD120B grocery 2023) limits scale, while reliance on third-party carriers and 4.5% food inflation (2024) increase cost and service risks.
| Metric | Value |
|---|---|
| Active customers (FY2024) | ≈300,000 |
| Canada population (2024) | 39.6M |
| Grocery market (2023) | CAD 120B |
| Food inflation (2024) | 4.5% |
Same Document Delivered
Goodfood Market SWOT Analysis
This is the actual Goodfood Market SWOT Analysis document you’ll receive upon purchase—no surprises, just professional quality. The preview below is taken directly from the full report you'll get, and the complete, editable version is unlocked after checkout. Buy now to access the full, detailed analysis.

Original: $10.00
-65%$10.00
$3.50Product Information
Product Information
Shipping & Returns
Shipping & Returns
Description
Dive Deeper Into the Company’s Strategic Blueprint
Goodfood Market’s snapshot shows clear strengths in customer retention and e-commerce logistics, but rising competition and margin pressure create near-term risks; operational scalability and product differentiation are pivotal to watch. Want the full story behind growth drivers, financial sensitivity, and tactical recommendations? Purchase the complete SWOT analysis to get a professionally written, editable report and Excel model for strategy and investment decisions.
Strengths
Recognized Canadian meal-kit brand
Recognized Canadian meal-kit brand (founded 2014, TSX-listed 2017) drives strong recall in urban markets, supporting acquisition and retention; Goodfood reported roughly 320,000 active customers in 2024, boosting recurring revenue. Trust in freshness and recipe quality reduces perceived switching risk, while word-of-mouth and positive reviews lower effective CAC over time. Brand equity facilitates cross-selling of new grocery SKUs into an engaged customer base.
Integrated meal kits and online groceries
Combining curated meal kits with an expanded online grocery assortment increases average basket size and order frequency by letting customers solve multiple needs in one checkout, boosting convenience and retention. This mix diversifies revenue away from kits’ seasonality, improves inventory turns through cross-selling and fresher SKU rotation, and enhances margin mix as higher-margin grocery items complement kit profitability.
Convenience and reduced food waste value
Pre-portioned ingredients cut prep time and minimize leftovers, supporting Goodfood’s value proposition to busy households; the company reported serving over 300,000 active subscribers in 2024, highlighting scale. Clear, step-by-step recipes lower cooking friction for novices, boosting adoption. Reduced waste resonates with sustainability-minded consumers and can increase perceived value and loyalty, aiding repeat-order rates and customer lifetime value.
Data-driven menus and personalization
Data-driven menu iteration from ratings and order history raises satisfaction and repeat orders; personalization nudges have been shown to lift attach rates 10–30% and lower churn, while demand forecasting can cut spoilage by ~15–20%, improving gross margins. Over time these insights enable targeted private-label launches with higher margin capture and SKU rationalization.
Urban fulfillment and last-mile capabilities
Urban fulfillment and last-mile capabilities place Goodfood close to dense customer clusters, shortening delivery windows and improving freshness, which boosts NPS and repeat purchase rates. Higher route density in metro areas reduces per-order delivery cost and supports profitably scaling same-day options. Localized operations enable rapid assortment testing and faster SKU iterations to match neighborhood preferences.
- Proximity: shorter delivery windows
- Freshness: higher NPS and repeats
- Cost: lower per-order delivery
- Agility: rapid local assortment testing
Meal-kit with ~320,000 customers lifts margins via personalization
Recognized Canadian meal-kit brand (founded 2014, TSX-listed 2017) with ~320,000 active customers in 2024 drives recurring revenue and cross-sell. Data-led personalization lifts attach rates 10–30% and forecasting cuts spoilage ~15–20%, improving margins. Urban fulfillment shortens delivery windows, lowering per-order cost and boosting repeat purchase rates.
| Metric | Value |
|---|---|
| Active customers (2024) | ~320,000 |
| Personalization uplift | 10–30% |
| Spoilage reduction | ~15–20% |
What is included in the product
Detailed Word Document
Provides a concise strategic SWOT overview of Goodfood Market, highlighting internal strengths and weaknesses and external opportunities and threats to assess its competitive position and growth prospects.
Customizable Excel Spreadsheet
Provides a focused SWOT matrix summarizing Goodfood Market’s strengths, weaknesses, opportunities, and threats for rapid strategic alignment and stakeholder-ready presentations.
Weaknesses
Thin margins and cost intensity
Meal kits and last-mile delivery are inherently low-margin businesses, and Goodfood’s unit economics are pressured by packaging, refrigerated transport and labor costs. These cost drivers make profitability vulnerable to small demand shocks and input-price swings. Scaling profitably therefore depends on disciplined cost control, higher order frequency and mix improvement toward higher-margin SKUs.
High customer churn risk
Subscriptions on Goodfood (FOOD.TO) can be paused or canceled easily, contributing to high churn risk; active customers stood around 300,000 in FY2024, making cohort stability pivotal. Price promotions frequently draw deal-seekers with lower LTV, pressuring margins. Menu fatigue and limited novelty can erode engagement over weeks. Continuous product innovation and loyalty levers are required to stabilize cohorts and lift retention.
Limited geographic footprint
Goodfood’s Canada-only footprint limits its total addressable market to roughly 39.6 million people (2024) and a domestic grocery retail market near CAD 120 billion (2023), capping near-term scale. Sparse northern and Atlantic regions increase per-delivery costs and operational complexity. Cross-border expansion into the US (≈330 million population) faces regulatory, fulfillment and tariff hurdles. Near-term growth likely depends on deeper Canadian penetration rather than wide geographic expansion.
Dependence on third-party logistics
Dependence on third-party carriers exposes Goodfood to on-time delivery failures and cold-chain breaks that can spoil perishable shipments and damage brand trust. Variable carrier service levels translate into inconsistent customer experiences and higher churn risk. Peak-season capacity constraints drive up spot rates and delivery costs, while building owned last-mile capability would require significant capital investment and operating scale.
- third-party carriers -> delivery & cold-chain risk
- service variability -> customer experience hit
- peak capacity -> higher seasonal costs
- owned last-mile -> capital intensive
Price sensitivity versus grocers
Traditional supermarkets frequently undercut delivered meal cost-per-serving, and budget-conscious consumers often view meal kits as discretionary; Statistics Canada reported food price inflation of about 4.5% in 2024, which magnifies trade-down behavior and forces Goodfood to make value communication that offsets headline price comparisons.
- price pressure: supermarkets cheaper per-serving
- consumer behavior: kits seen as discretionary
- inflation impact: 4.5% food inflation (2024)
- response need: stronger value messaging vs headline prices
Meal-kit margins squeezed; churn ≈300k, 4.5%
Goodfood’s low-margin meal-kit model is squeezed by packaging, refrigerated transport and labour, making profitability sensitive to demand shocks. High subscription churn (≈300,000 active customers in FY2024) and promotion-driven deal-seekers depress LTV; menu fatigue risks engagement. Canada-only footprint (39.6M pop, TAM CAD120B grocery 2023) limits scale, while reliance on third-party carriers and 4.5% food inflation (2024) increase cost and service risks.
| Metric | Value |
|---|---|
| Active customers (FY2024) | ≈300,000 |
| Canada population (2024) | 39.6M |
| Grocery market (2023) | CAD 120B |
| Food inflation (2024) | 4.5% |
Same Document Delivered
Goodfood Market SWOT Analysis
This is the actual Goodfood Market SWOT Analysis document you’ll receive upon purchase—no surprises, just professional quality. The preview below is taken directly from the full report you'll get, and the complete, editable version is unlocked after checkout. Buy now to access the full, detailed analysis.











