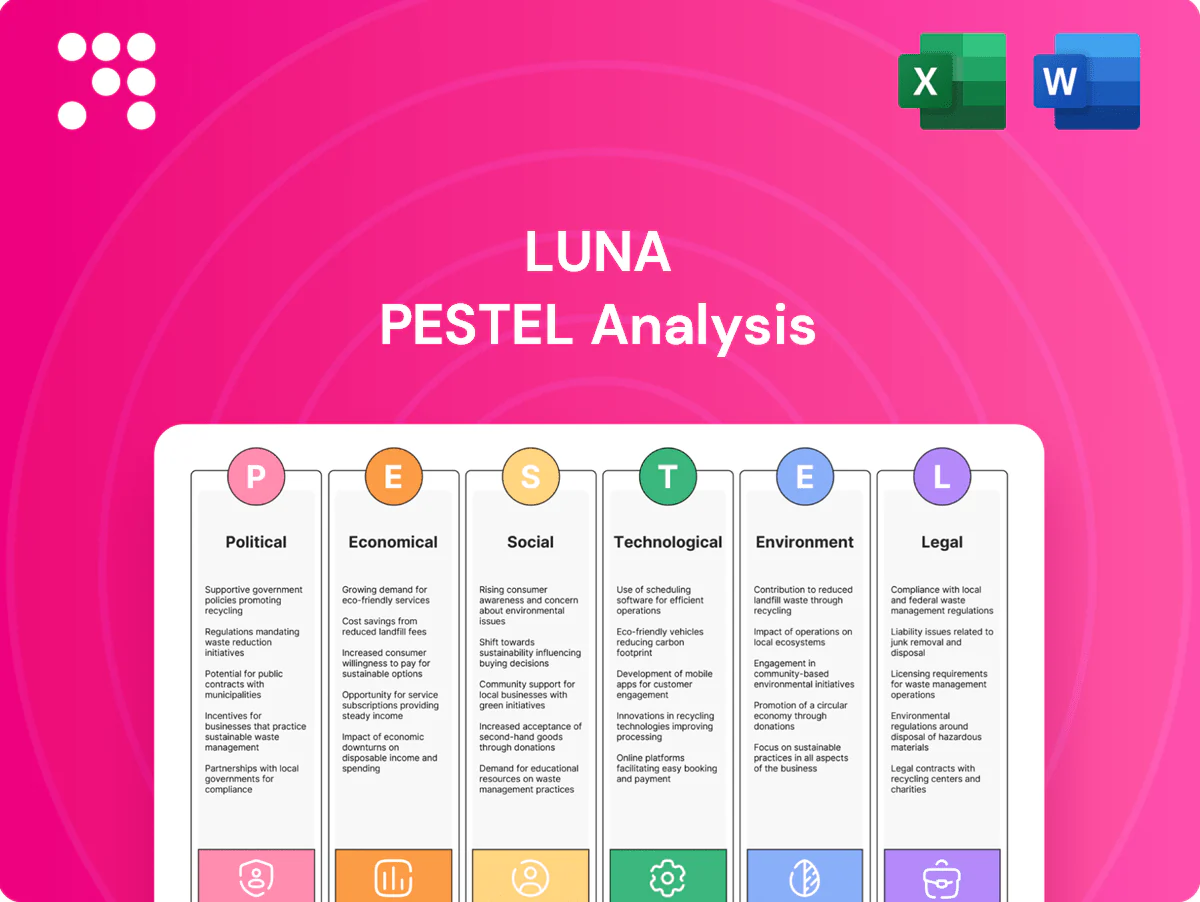
Luna PESTLE Analysis

Plan Smarter. Present Sharper. Compete Stronger.
Explore how political shifts, economic cycles, and technological disruptions are reshaping Luna's strategic horizon. Our PESTLE distills regulatory, social, and environmental risks into actionable insights for investors, advisors, and planners. Purchase the full, editable analysis now to access the complete breakdown and make smarter, faster decisions.
Political factors

Export controls & ITAR
Laser and fiber sensing products can fall under U.S. export controls and ITAR, restricting aerospace and defense sales; U.S. licensing reviews commonly take 30–180 days, increasing sales cycles. End‑user screening and license costs raise compliance spend and can delay contracts. Since 2020 the U.S. has tightened controls on China and Russia, and proactive product classification and compliant supply chains reduce disruption risk.
Government R&D funding
Public grants and defense contracts drive demand for advanced sensing—US DoD RDT&E request reached about $120B for FY2025 and DARPA funding was ~4.8B in 2024, creating procurement opportunities. Budget shifts in aerospace, energy and infrastructure (NASA ~29B/year) can accelerate or delay projects and revenues. Multi-year appropriations increase visibility but face political cycles. Consortium engagement aligns offerings with funded roadmaps.

Trade policy & tariffs
Tariffs on optical components and electronics (US Section 301 measures reach up to 25%) can materially raise BOM costs, squeezing gross margins. Trade tensions with China and the EU disrupt sourcing and customer access, boosting lead times and price volatility. Localizing assembly reduces tariff exposure but typically requires low-to-mid tens of millions in incremental capex. Building flexible supplier networks has proven to stabilize margins during tariff shocks.

Infrastructure initiatives
- GI Hub $4.5T annual need (2024)
- US infrastructure law $1.2T
- EU RRF €723B
- Proven reliability ≈ +20% tender win
- Disbursement timing → order/backlog volatility
Standards & public safety
US export controls tighten laser/fiber trade; defense funding and tariffs pressure market
Laser/fiber products face US export controls/ITAR with 30–180 day license reviews and tighter controls vs China/Russia since 2020, raising compliance costs. Public funding and infrastructure programs (DoD RDT&E ~$120B FY2025; DARPA ~$4.8B 2024; US Infra $1.2T) drive procurement. Tariffs (up to 25%) and localization capex pressure margins while standards and mandates (fiber sensing ~$1.2B 2023, ~11% CAGR) raise adoption.
| Metric | Value |
|---|---|
| DoD RDT&E | $120B (FY2025) |
| DARPA | $4.8B (2024) |
| GI Hub need | $4.5T (2024) |
| US Infra Law | $1.2T |
| EU RRF | €723B |
| Tariffs | Up to 25% |
| Fiber sensing market | $1.2B (2023), ~11% CAGR |
What is included in the product
 Detailed Word Document
Explores how Political, Economic, Social, Technological, Environmental, and Legal forces uniquely affect Luna, with each category expanded into detailed sub-points and examples specific to the business and region. Backed by data and current trends, the analysis delivers forward-looking insights and clean formatting ready for business plans, pitch decks, or strategic reports to inform investors and executives.

 Customizable Excel Spreadsheet
A concise, visually segmented Luna PESTLE summary that highlights regulatory, economic and technological risks to streamline stakeholder discussions and decision-making, easily dropped into presentations or shared across teams for quick alignment.
Economic factors

Capex cycles
Customers in aerospace, automotive and energy phase purchases with capex cycles; IMF data showed global investment growth near 3.3% in 2024, causing procurement pulls in capital-intensive sectors and tighter test & measurement budgets that can elongate sales cycles by months. Recovery phases boost metrology and R&D tool demand—global R&D spending was about $2.7 trillion in 2023—while diversified end-markets reduce revenue volatility for Luna.
Supply chain inflation
Double-digit price increases for semiconductors, optics and precision components have squeezed margins, while lead times—often exceeding 20 weeks at peak—have added delivery volatility. Strategic inventory buildup and long-term agreements (LTAs) have reduced cost exposure and stabilized supply. Value-based pricing and product-mix optimization preserve gross margin by shifting sales toward higher-margin SKUs.

Foreign exchange
Global sales expose Luna to FX swings: with the US Dollar Index around 105 in mid‑2025, revenue reported in USD faces translation risk that can compress margins. USD strength makes international pricing less competitive versus local rivals and may force price cuts. Active hedging programs and natural offsets (costs in foreign currencies) materially reduce reported earnings volatility. Quoting prices in local currency improves market penetration and customer conversion.

Cost of capital
Higher interest rates (US federal funds ~5.25–5.50% mid‑2025) raise customer discount rates, increasing payback thresholds and often delaying ROI‑driven Luna purchases; they also raise Luna’s hurdle rates for new projects. Strong working capital management and targeted R&D shorten payback windows, while strategic partnerships share development risk and capex burden.
- Interest rate environment: Fed ~5.25–5.50% (mid‑2025)
- Customer behavior: higher discounting delays purchases
- Resilience: efficient WC + targeted R&D
- Risk mitigation: partnerships share development cost
Sector-specific growth
Energy transition and grid modernization are driving sensing demand as global power-sector investment requirements are estimated at about $1.7 trillion to 2030, lifting metrology and sensor spend. Aerospace recovery reached roughly 90% of 2019 passenger levels in 2024, sustaining metrology needs, while automotive EV sales near 14 million in 2024 increase demand for thermal and structural monitoring. Aligning Luna offerings to these secular trends supports revenue growth.
- Grid investment: $1.7T to 2030
- Aerospace: ~90% of 2019 traffic in 2024
- EVs: ~14M sales in 2024 — rising thermal/structural sensing demand
US export controls tighten laser/fiber trade; defense funding and tariffs pressure market
Customers in capex cycles slow buys; IMF shows global investment +3.3% (2024) and R&D ~$2.7T (2023), supporting metrology demand. Input costs and 20+ week lead times squeeze margins; LTAs and value pricing mitigate. USD index ~105 and Fed 5.25–5.50% (mid‑2025) raise FX and discount‑rate risk; hedging and WC actions reduce volatility.
| Metric | Value |
|---|---|
| Global investment (2024) | +3.3% (IMF) |
| Global R&D (2023) | $2.7T |
| USD Index (mid‑2025) | ~105 |
| Fed funds (mid‑2025) | 5.25–5.50% |
| Grid investment to 2030 | $1.7T |
| Aerospace (2024) | ~90% of 2019 |
| EV sales (2024) | ~14M |
| Peak lead times | >20 weeks |
Full Version Awaits
Luna PESTLE Analysis
The Luna PESTLE Analysis preview is the exact document you’ll receive after purchase—fully formatted, professionally structured, and ready to use. What you see here is the real file, with no placeholders or teasers. After checkout you’ll be able to download this same finished analysis immediately.

Product Information
Product Information
Shipping & Returns
Shipping & Returns
Description
Plan Smarter. Present Sharper. Compete Stronger.
Explore how political shifts, economic cycles, and technological disruptions are reshaping Luna's strategic horizon. Our PESTLE distills regulatory, social, and environmental risks into actionable insights for investors, advisors, and planners. Purchase the full, editable analysis now to access the complete breakdown and make smarter, faster decisions.
Political factors
Export controls & ITAR
Laser and fiber sensing products can fall under U.S. export controls and ITAR, restricting aerospace and defense sales; U.S. licensing reviews commonly take 30–180 days, increasing sales cycles. End‑user screening and license costs raise compliance spend and can delay contracts. Since 2020 the U.S. has tightened controls on China and Russia, and proactive product classification and compliant supply chains reduce disruption risk.
Government R&D funding
Public grants and defense contracts drive demand for advanced sensing—US DoD RDT&E request reached about $120B for FY2025 and DARPA funding was ~4.8B in 2024, creating procurement opportunities. Budget shifts in aerospace, energy and infrastructure (NASA ~29B/year) can accelerate or delay projects and revenues. Multi-year appropriations increase visibility but face political cycles. Consortium engagement aligns offerings with funded roadmaps.
Trade policy & tariffs
Tariffs on optical components and electronics (US Section 301 measures reach up to 25%) can materially raise BOM costs, squeezing gross margins. Trade tensions with China and the EU disrupt sourcing and customer access, boosting lead times and price volatility. Localizing assembly reduces tariff exposure but typically requires low-to-mid tens of millions in incremental capex. Building flexible supplier networks has proven to stabilize margins during tariff shocks.
Infrastructure initiatives
- GI Hub $4.5T annual need (2024)
- US infrastructure law $1.2T
- EU RRF €723B
- Proven reliability ≈ +20% tender win
- Disbursement timing → order/backlog volatility
Standards & public safety
US export controls tighten laser/fiber trade; defense funding and tariffs pressure market
Laser/fiber products face US export controls/ITAR with 30–180 day license reviews and tighter controls vs China/Russia since 2020, raising compliance costs. Public funding and infrastructure programs (DoD RDT&E ~$120B FY2025; DARPA ~$4.8B 2024; US Infra $1.2T) drive procurement. Tariffs (up to 25%) and localization capex pressure margins while standards and mandates (fiber sensing ~$1.2B 2023, ~11% CAGR) raise adoption.
| Metric | Value |
|---|---|
| DoD RDT&E | $120B (FY2025) |
| DARPA | $4.8B (2024) |
| GI Hub need | $4.5T (2024) |
| US Infra Law | $1.2T |
| EU RRF | €723B |
| Tariffs | Up to 25% |
| Fiber sensing market | $1.2B (2023), ~11% CAGR |
What is included in the product
Detailed Word Document
Explores how Political, Economic, Social, Technological, Environmental, and Legal forces uniquely affect Luna, with each category expanded into detailed sub-points and examples specific to the business and region. Backed by data and current trends, the analysis delivers forward-looking insights and clean formatting ready for business plans, pitch decks, or strategic reports to inform investors and executives.
Customizable Excel Spreadsheet
A concise, visually segmented Luna PESTLE summary that highlights regulatory, economic and technological risks to streamline stakeholder discussions and decision-making, easily dropped into presentations or shared across teams for quick alignment.
Economic factors
Capex cycles
Customers in aerospace, automotive and energy phase purchases with capex cycles; IMF data showed global investment growth near 3.3% in 2024, causing procurement pulls in capital-intensive sectors and tighter test & measurement budgets that can elongate sales cycles by months. Recovery phases boost metrology and R&D tool demand—global R&D spending was about $2.7 trillion in 2023—while diversified end-markets reduce revenue volatility for Luna.
Supply chain inflation
Double-digit price increases for semiconductors, optics and precision components have squeezed margins, while lead times—often exceeding 20 weeks at peak—have added delivery volatility. Strategic inventory buildup and long-term agreements (LTAs) have reduced cost exposure and stabilized supply. Value-based pricing and product-mix optimization preserve gross margin by shifting sales toward higher-margin SKUs.
Foreign exchange
Global sales expose Luna to FX swings: with the US Dollar Index around 105 in mid‑2025, revenue reported in USD faces translation risk that can compress margins. USD strength makes international pricing less competitive versus local rivals and may force price cuts. Active hedging programs and natural offsets (costs in foreign currencies) materially reduce reported earnings volatility. Quoting prices in local currency improves market penetration and customer conversion.
Cost of capital
Higher interest rates (US federal funds ~5.25–5.50% mid‑2025) raise customer discount rates, increasing payback thresholds and often delaying ROI‑driven Luna purchases; they also raise Luna’s hurdle rates for new projects. Strong working capital management and targeted R&D shorten payback windows, while strategic partnerships share development risk and capex burden.
- Interest rate environment: Fed ~5.25–5.50% (mid‑2025)
- Customer behavior: higher discounting delays purchases
- Resilience: efficient WC + targeted R&D
- Risk mitigation: partnerships share development cost
Sector-specific growth
Energy transition and grid modernization are driving sensing demand as global power-sector investment requirements are estimated at about $1.7 trillion to 2030, lifting metrology and sensor spend. Aerospace recovery reached roughly 90% of 2019 passenger levels in 2024, sustaining metrology needs, while automotive EV sales near 14 million in 2024 increase demand for thermal and structural monitoring. Aligning Luna offerings to these secular trends supports revenue growth.
- Grid investment: $1.7T to 2030
- Aerospace: ~90% of 2019 traffic in 2024
- EVs: ~14M sales in 2024 — rising thermal/structural sensing demand
US export controls tighten laser/fiber trade; defense funding and tariffs pressure market
Customers in capex cycles slow buys; IMF shows global investment +3.3% (2024) and R&D ~$2.7T (2023), supporting metrology demand. Input costs and 20+ week lead times squeeze margins; LTAs and value pricing mitigate. USD index ~105 and Fed 5.25–5.50% (mid‑2025) raise FX and discount‑rate risk; hedging and WC actions reduce volatility.
| Metric | Value |
|---|---|
| Global investment (2024) | +3.3% (IMF) |
| Global R&D (2023) | $2.7T |
| USD Index (mid‑2025) | ~105 |
| Fed funds (mid‑2025) | 5.25–5.50% |
| Grid investment to 2030 | $1.7T |
| Aerospace (2024) | ~90% of 2019 |
| EV sales (2024) | ~14M |
| Peak lead times | >20 weeks |
Full Version Awaits
Luna PESTLE Analysis
The Luna PESTLE Analysis preview is the exact document you’ll receive after purchase—fully formatted, professionally structured, and ready to use. What you see here is the real file, with no placeholders or teasers. After checkout you’ll be able to download this same finished analysis immediately.











