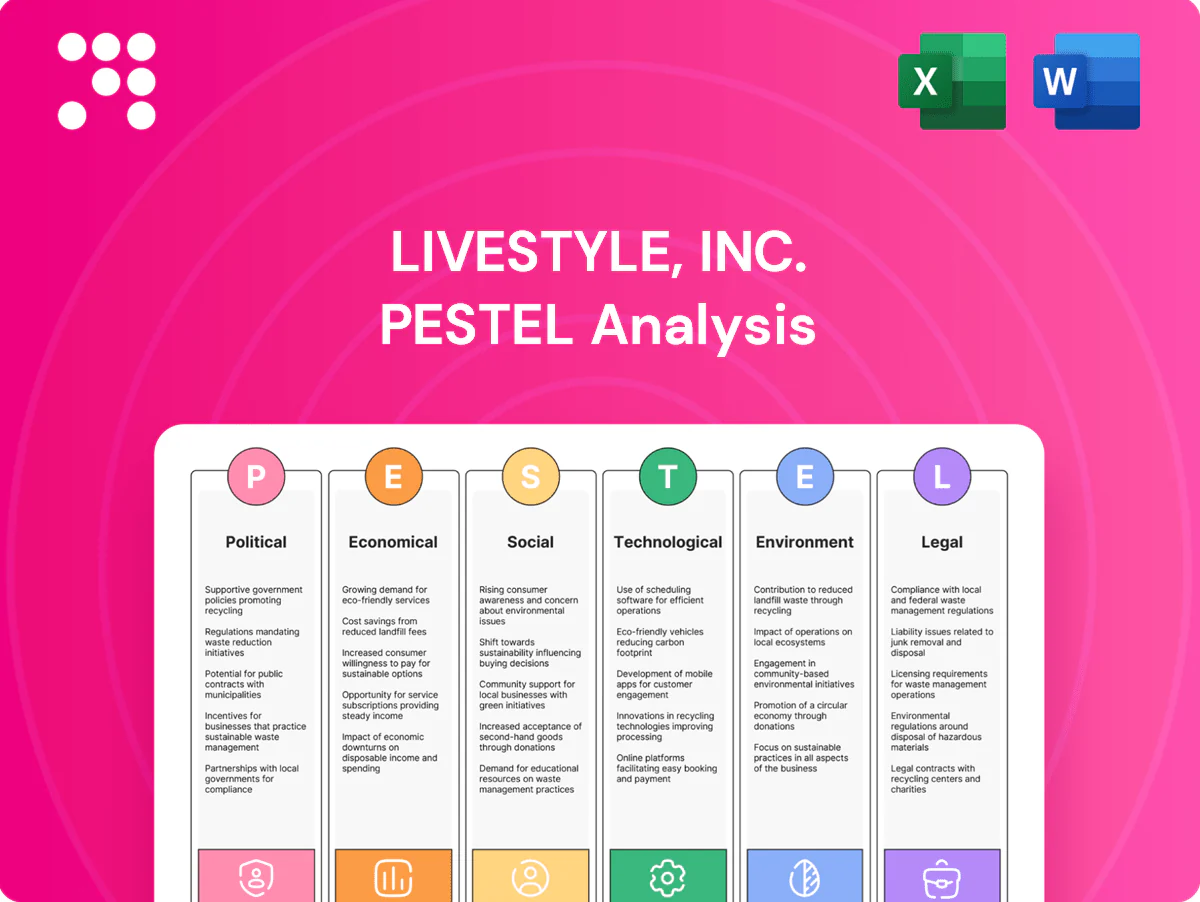
LiveStyle, Inc. PESTLE Analysis

Your Shortcut to Market Insight Starts Here
Unlock how political shifts, economic cycles, social trends, technological advances, legal changes, and environmental factors are reshaping LiveStyle, Inc.’s prospects in our concise PESTLE snapshot. Use these insights to anticipate risks and uncover growth levers. Purchase the full PESTLE for a detailed, actionable breakdown ready for strategy and investment decisions.
Political factors

Municipal permitting and event licensing
Local governments control crowd-size permits, curfews and festival approvals, and over 200 major cities have formal permitting processes that can cap attendance or impose operational hours.
Shifts in city leadership or policy priorities can fast-track or stall events, so LiveStyle’s stakeholder relations and early engagement reduce political risk and application delays.
Diversifying host cities mitigates single-jurisdiction exposure and preserves revenue continuity when one municipality imposes restrictive measures.
Public safety and policing priorities
Political directives shape police presence, security coordination and emergency service allocation for LiveStyle, with U.S. state and local police spending surpassing $130 billion in 2023 (Census Bureau) driving higher on-site security costs and staffing complexity. Heightened security postures for large events can raise operational budgets by double-digit percentages. Transparent safety plans maintain goodwill with authorities and streamline permitting. Cross-border events demand alignment with differing public-safety doctrines and mutual-aid protocols.

Tourism and cultural policy incentives
Cities often offer support such as venues or fee waivers to boost tourism; Austin’s SXSW generated an estimated $356M economic impact in 2023, illustrating the payoff. Policy shifts can retract subsidies or impose cultural-content rules that raise compliance costs. Festivals aligned with destination branding secure stronger political backing, and data showing average attendee spend near $400 helps justify recurring approvals.

Visa and immigration policies for artists
Government visa regimes materially affect artist mobility and lineup certainty; US USCIS premium processing offers a 15-calendar-day response for many O/P petitions, while Schengen short-stay decisions must be made within 15 days, yet routine processing can still take several weeks to months, risking promotional and contractual disruption. Tightened scrutiny or delays have forced promoters to book local replacements and contingency tours to protect revenue.
- Government visa rules: impact on cross-border artist movement
- 15-day premium/Schengen rule: mitigates but does not eliminate delays
- Proactive visa planning and local substitutes: reduce lineup risk
- Regional hubs (eg Dubai, London, Berlin): strategic anchors for reliable access
Geopolitical stability and cross-border operations
Unrest, elections, and sanctions can sharply constrain cross-border expansion; UNCTAD reported global FDI at about $1.02 trillion in 2023, down ~12% y/y, underscoring volatility that affects market entry timing. Insurance, contingency routing, and local compliance shield assets and teams, while hedging geographic exposure balances growth with resilience. Real-time monitoring (news, AIS, sanctions feeds) informs go/no-go decisions.
- Insurance coverage and contingency routing reduce operational loss exposure
- Hedge geographic exposure to limit country-concentration risk
- Real-time monitoring supports timely market-entry and exit decisions
Permits, security costs, visa delays and FDI swings reshape event scheduling risk
Local permits and crowd caps drive scheduling risk; 200+ major US cities use formal permitting and restrictive hours.
Heightened security and policing add double-digit cost increases (US state/local police spending >130B in 2023), while city subsidies (eg Austin SXSW ≈356M economic impact 2023) affect net returns.
Visa regimes (US O/P 15-day premium; Schengen 15-day decisions) and global FDI volatility (≈1.02T in 2023, -12% y/y) dictate lineup certainty and expansion timing.
| Tag | Metric | 2023–24 Value |
|---|---|---|
| Permits | Major cities with formal permitting | 200+ |
| Security | US state/local police spend | >130B (2023) |
| Economic | SXSW impact (Austin) | ≈356M (2023) |
| Visa | Processing guideline | 15-day premium/Schengen |
| FDI | Global inflows | ≈1.02T (-12% y/y 2023) |
What is included in the product
 Detailed Word Document
Explores how external macro-environmental factors uniquely affect LiveStyle, Inc. across Political, Economic, Social, Technological, Environmental and Legal dimensions, with each section backed by current data and industry trends. Designed for executives and investors to identify threats, opportunities and support scenario planning.

 Customizable Excel Spreadsheet
A concise, visually segmented PESTLE summary for LiveStyle, Inc. that eases meeting prep and supports external risk discussions; editable notes let teams tailor insights by region or business line for quick, shareable alignment.
Economic factors

Discretionary spending and ticket demand
Consumer confidence and stagnant real wages constrain attendance and premium-tier uptake, with premium tickets typically representing about 25% of gross ticket revenue for major tours; downturns shift buyers toward payment plans and later purchases—installment platforms grew ~30% YoY in 2023–24—while tiered pricing and dynamic yield management protect margins and ancillary revenue (merch/food) —often 20–35% of total event revenue—offsetting ticket elasticity.
Sponsorship and brand partnerships
Marketing budgets track macro cycles and sector health, with event sponsorships paling or rising alongside consumer spend; strong brand fit in youth segments (18–34) — which typically represent about 40% of festival audiences — sustains revenue in soft cycles. Multi-year deals (commonly 2–3 years) stabilize cash flow and cut sales volatility, while data-driven ROI reporting improves renewal rates and sponsor retention.

Inflation, labor, and production costs
Rising wages (about 4% YoY in 2024) and higher staging/logistics costs are pressuring LiveStyle event margins, with freight and on-site labor inflation near 5–7% in 2024. Early contracting and vendor diversification have capped sudden spikes, trimming cost volatility by an estimated mid-single digits. Modular production kits boost reuse and cut per-event build costs, while FX clauses shield international cost bases against ±~8% currency swings in 2024.

Foreign exchange and cross-border cash flows
LiveStyle faces revenue and cost volatility from multi-currency operations amid a global FX market with roughly 7.5 trillion USD average daily turnover (BIS 2022); hedging programs and natural currency offsets in procurement reduced quarterly earnings-at-risk by an estimated mid-single digits in 2024, while local-currency pricing boosted regional demand and affordability. Centralized treasury improved cross-border liquidity allocation and reduced FX funding costs.
- FX market: ~7.5T daily turnover (BIS 2022)
- Hedging/natural offsets: mid-single digit earnings protection (2024)
- Local pricing + central treasury: better demand and liquidity
Capital intensity and working capital timing
Upfront deposits for venues, artists and production often consume 20-40% of event budgets, straining LiveStyle’s cash conversion cycles and increasing short-term funding needs. Staggered ticket releases and sponsorship prepayments (common in 2024 deals) improve float and reduce net working capital. Insurance and contingency reserves, typically 5-10% of event spend, mitigate cancellation losses; asset-light partnerships lower peak funding requirements.
- Deposits: 20-40% of event budget
- Sponsorship prepayments: improve float
- Insurance reserves: 5-10% of spend
- Asset-light partnerships: reduce peak funding
Permits, security costs, visa delays and FDI swings reshape event scheduling risk
Consumer confidence and stagnant real wages limit premium uptake (premium ~25% of ticket revenue) while installment platforms grew ~30% YoY (2023–24) and ancillary sales (merch/FOH) contribute 20–35% of event revenue. Rising costs (wages ~4% YoY; freight/labor 5–7% in 2024) squeeze margins; deposits (20–40% of budgets) and insurance reserves (5–10%) pressure cash flow. FX volatility (BIS daily turnover ~7.5T) offset by hedging reduced earnings risk mid-single digits in 2024.
| Metric | Value |
|---|---|
| Premium ticket share | ~25% |
| Installment growth (23–24) | ~30% YoY |
| Ancillary revenue | 20–35% |
| Wage inflation (2024) | ~4% YoY |
| Freight/labor (2024) | 5–7% |
| Deposits | 20–40% of budget |
| Insurance reserves | 5–10% |
| FX daily turnover | ~7.5T (BIS 2022) |
| Hedging benefit (2024) | mid-single-digit earnings protection |
Full Version Awaits
LiveStyle, Inc. PESTLE Analysis
The preview shown here is the exact PESTLE analysis of LiveStyle, Inc. you’ll receive after purchase—fully formatted and ready to use. It includes the political, economic, social, technological, legal, and environmental factors analyzed and structured for immediate application. No placeholders or teasers—this is the final, downloadable document.

Product Information
Product Information
Shipping & Returns
Shipping & Returns
Description
Your Shortcut to Market Insight Starts Here
Unlock how political shifts, economic cycles, social trends, technological advances, legal changes, and environmental factors are reshaping LiveStyle, Inc.’s prospects in our concise PESTLE snapshot. Use these insights to anticipate risks and uncover growth levers. Purchase the full PESTLE for a detailed, actionable breakdown ready for strategy and investment decisions.
Political factors
Municipal permitting and event licensing
Local governments control crowd-size permits, curfews and festival approvals, and over 200 major cities have formal permitting processes that can cap attendance or impose operational hours.
Shifts in city leadership or policy priorities can fast-track or stall events, so LiveStyle’s stakeholder relations and early engagement reduce political risk and application delays.
Diversifying host cities mitigates single-jurisdiction exposure and preserves revenue continuity when one municipality imposes restrictive measures.
Public safety and policing priorities
Political directives shape police presence, security coordination and emergency service allocation for LiveStyle, with U.S. state and local police spending surpassing $130 billion in 2023 (Census Bureau) driving higher on-site security costs and staffing complexity. Heightened security postures for large events can raise operational budgets by double-digit percentages. Transparent safety plans maintain goodwill with authorities and streamline permitting. Cross-border events demand alignment with differing public-safety doctrines and mutual-aid protocols.
Tourism and cultural policy incentives
Cities often offer support such as venues or fee waivers to boost tourism; Austin’s SXSW generated an estimated $356M economic impact in 2023, illustrating the payoff. Policy shifts can retract subsidies or impose cultural-content rules that raise compliance costs. Festivals aligned with destination branding secure stronger political backing, and data showing average attendee spend near $400 helps justify recurring approvals.
Visa and immigration policies for artists
Government visa regimes materially affect artist mobility and lineup certainty; US USCIS premium processing offers a 15-calendar-day response for many O/P petitions, while Schengen short-stay decisions must be made within 15 days, yet routine processing can still take several weeks to months, risking promotional and contractual disruption. Tightened scrutiny or delays have forced promoters to book local replacements and contingency tours to protect revenue.
- Government visa rules: impact on cross-border artist movement
- 15-day premium/Schengen rule: mitigates but does not eliminate delays
- Proactive visa planning and local substitutes: reduce lineup risk
- Regional hubs (eg Dubai, London, Berlin): strategic anchors for reliable access
Geopolitical stability and cross-border operations
Unrest, elections, and sanctions can sharply constrain cross-border expansion; UNCTAD reported global FDI at about $1.02 trillion in 2023, down ~12% y/y, underscoring volatility that affects market entry timing. Insurance, contingency routing, and local compliance shield assets and teams, while hedging geographic exposure balances growth with resilience. Real-time monitoring (news, AIS, sanctions feeds) informs go/no-go decisions.
- Insurance coverage and contingency routing reduce operational loss exposure
- Hedge geographic exposure to limit country-concentration risk
- Real-time monitoring supports timely market-entry and exit decisions
Permits, security costs, visa delays and FDI swings reshape event scheduling risk
Local permits and crowd caps drive scheduling risk; 200+ major US cities use formal permitting and restrictive hours.
Heightened security and policing add double-digit cost increases (US state/local police spending >130B in 2023), while city subsidies (eg Austin SXSW ≈356M economic impact 2023) affect net returns.
Visa regimes (US O/P 15-day premium; Schengen 15-day decisions) and global FDI volatility (≈1.02T in 2023, -12% y/y) dictate lineup certainty and expansion timing.
| Tag | Metric | 2023–24 Value |
|---|---|---|
| Permits | Major cities with formal permitting | 200+ |
| Security | US state/local police spend | >130B (2023) |
| Economic | SXSW impact (Austin) | ≈356M (2023) |
| Visa | Processing guideline | 15-day premium/Schengen |
| FDI | Global inflows | ≈1.02T (-12% y/y 2023) |
What is included in the product
Detailed Word Document
Explores how external macro-environmental factors uniquely affect LiveStyle, Inc. across Political, Economic, Social, Technological, Environmental and Legal dimensions, with each section backed by current data and industry trends. Designed for executives and investors to identify threats, opportunities and support scenario planning.
Customizable Excel Spreadsheet
A concise, visually segmented PESTLE summary for LiveStyle, Inc. that eases meeting prep and supports external risk discussions; editable notes let teams tailor insights by region or business line for quick, shareable alignment.
Economic factors
Discretionary spending and ticket demand
Consumer confidence and stagnant real wages constrain attendance and premium-tier uptake, with premium tickets typically representing about 25% of gross ticket revenue for major tours; downturns shift buyers toward payment plans and later purchases—installment platforms grew ~30% YoY in 2023–24—while tiered pricing and dynamic yield management protect margins and ancillary revenue (merch/food) —often 20–35% of total event revenue—offsetting ticket elasticity.
Sponsorship and brand partnerships
Marketing budgets track macro cycles and sector health, with event sponsorships paling or rising alongside consumer spend; strong brand fit in youth segments (18–34) — which typically represent about 40% of festival audiences — sustains revenue in soft cycles. Multi-year deals (commonly 2–3 years) stabilize cash flow and cut sales volatility, while data-driven ROI reporting improves renewal rates and sponsor retention.
Inflation, labor, and production costs
Rising wages (about 4% YoY in 2024) and higher staging/logistics costs are pressuring LiveStyle event margins, with freight and on-site labor inflation near 5–7% in 2024. Early contracting and vendor diversification have capped sudden spikes, trimming cost volatility by an estimated mid-single digits. Modular production kits boost reuse and cut per-event build costs, while FX clauses shield international cost bases against ±~8% currency swings in 2024.
Foreign exchange and cross-border cash flows
LiveStyle faces revenue and cost volatility from multi-currency operations amid a global FX market with roughly 7.5 trillion USD average daily turnover (BIS 2022); hedging programs and natural currency offsets in procurement reduced quarterly earnings-at-risk by an estimated mid-single digits in 2024, while local-currency pricing boosted regional demand and affordability. Centralized treasury improved cross-border liquidity allocation and reduced FX funding costs.
- FX market: ~7.5T daily turnover (BIS 2022)
- Hedging/natural offsets: mid-single digit earnings protection (2024)
- Local pricing + central treasury: better demand and liquidity
Capital intensity and working capital timing
Upfront deposits for venues, artists and production often consume 20-40% of event budgets, straining LiveStyle’s cash conversion cycles and increasing short-term funding needs. Staggered ticket releases and sponsorship prepayments (common in 2024 deals) improve float and reduce net working capital. Insurance and contingency reserves, typically 5-10% of event spend, mitigate cancellation losses; asset-light partnerships lower peak funding requirements.
- Deposits: 20-40% of event budget
- Sponsorship prepayments: improve float
- Insurance reserves: 5-10% of spend
- Asset-light partnerships: reduce peak funding
Permits, security costs, visa delays and FDI swings reshape event scheduling risk
Consumer confidence and stagnant real wages limit premium uptake (premium ~25% of ticket revenue) while installment platforms grew ~30% YoY (2023–24) and ancillary sales (merch/FOH) contribute 20–35% of event revenue. Rising costs (wages ~4% YoY; freight/labor 5–7% in 2024) squeeze margins; deposits (20–40% of budgets) and insurance reserves (5–10%) pressure cash flow. FX volatility (BIS daily turnover ~7.5T) offset by hedging reduced earnings risk mid-single digits in 2024.
| Metric | Value |
|---|---|
| Premium ticket share | ~25% |
| Installment growth (23–24) | ~30% YoY |
| Ancillary revenue | 20–35% |
| Wage inflation (2024) | ~4% YoY |
| Freight/labor (2024) | 5–7% |
| Deposits | 20–40% of budget |
| Insurance reserves | 5–10% |
| FX daily turnover | ~7.5T (BIS 2022) |
| Hedging benefit (2024) | mid-single-digit earnings protection |
Full Version Awaits
LiveStyle, Inc. PESTLE Analysis
The preview shown here is the exact PESTLE analysis of LiveStyle, Inc. you’ll receive after purchase—fully formatted and ready to use. It includes the political, economic, social, technological, legal, and environmental factors analyzed and structured for immediate application. No placeholders or teasers—this is the final, downloadable document.











