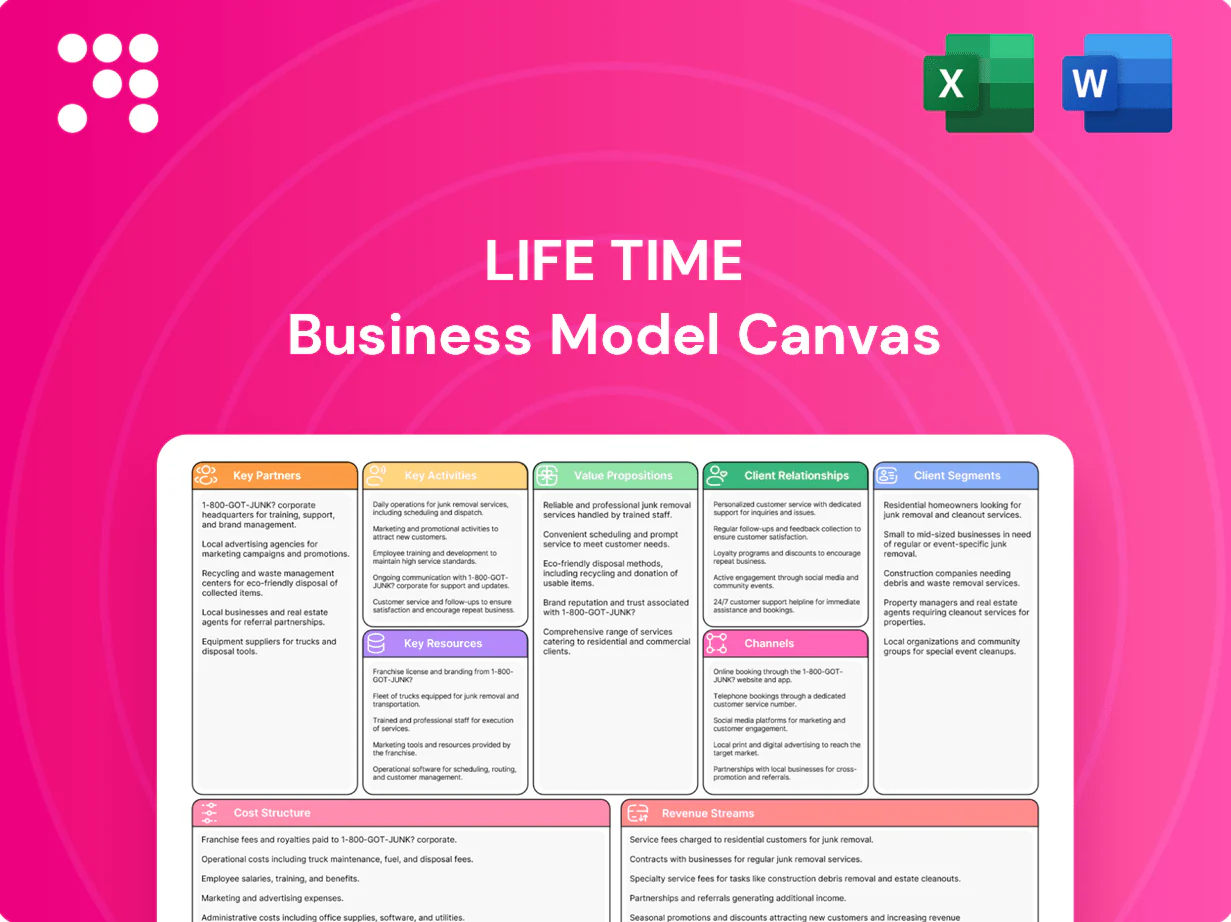
Life Time Business Model Canvas

Concise Business Model Canvas for winning health, fitness, and lifestyle markets
Unlock Life Time’s strategic blueprint with a concise Business Model Canvas that maps its value propositions, key partners, and revenue levers to show how it wins in health, fitness, and lifestyle markets. Perfect for entrepreneurs, consultants, and investors seeking actionable insight and benchmarking. Purchase the full, editable Canvas (Word & Excel) to access all nine blocks, financial implications, and ready-to-use slides for strategic planning.
Partnerships

Premium fitness equipment suppliers
Securing long-term agreements with top-tier equipment brands ensures reliability and higher member satisfaction and allows Life Time to lock favorable pricing; the commercial fitness equipment market exceeded $15 billion in 2024. Co-marketing and early access to innovations differentiate clubs and drive trial rates. Service-level guarantees reduce downtime and protect the premium experience. Network-wide volume purchasing lowers unit costs and improves margin consistency.
Wellness, spa, and beauty product vendors
Curated product partners elevate spa services and retail margins, with premium retail markups in the spa sector commonly exceeding 50% and driving incremental per-member spend; Life Time’s upscale positioning targets this high-margin segment. Co-branded treatments and seasonal menus refresh offerings without heavy R&D, enabling faster rollouts and typical campaign lift of 10–15% in service bookings. Vendor training improves staff expertise and upsell rates—third-party training programs have been shown to boost conversion by roughly 12–18%. Preferred pricing and exclusive SKUs reinforce luxury positioning and help capture repeat retail spend from a membership base that industry reports estimate spends materially more on wellness than non-members.

Health insurers and corporate wellness programs
Partnerships with health insurers and corporate wellness programs enable subsidized Life Time memberships, expanding the corporate client base and driving B2B revenue. Data-driven wellness outcomes (claims-linked metrics) support reimbursement and incentive programs, with the global corporate wellness market valued at about USD 57.3 billion in 2022 and growing into 2024. Tailored employer programs improve engagement and retention, and co-sponsored challenges measurably increase utilization and health impact.

Local sports, youth leagues, and community orgs
Alliances with local sports, youth leagues, and community orgs feed aquatics, tennis, and youth programming at Life Time, leveraging a network across over 160 clubs and more than 1 million members (Life Time disclosures through 2024) to drive family memberships and lift off-peak usage via weekday lessons and weekend leagues.
- Shared facilities/events boost brand presence and retention
- Pipeline partnerships create recurring seasonal demand
- Community ties convert local teams into family memberships
Technology and digital fitness platforms
Technology and digital fitness partnerships enable Life Time to integrate apps, wearables, and streaming for hybrid class and at-home experiences; digital engagement rose roughly 20% year-over-year in 2024 as members shifted to omnichannel usage. Data flows power personalization and retention analytics, while joint development shortens feature-release cycles and open APIs streamline booking, payments, and access across ecosystems.
- Integration: apps + wearables + streaming = hybrid reach
- Data: personalization + retention analytics
- Joint dev: faster feature cadence
- Open APIs: frictionless booking, payments, access
Vendor deals lift margins: >$15B equipment, 160+ clubs, digital +20%
Long-term vendor deals and volume buying secure equipment reliability and margin lift; global commercial fitness equipment market >$15B in 2024. Spa/retail partners drive high-margin per-member spend; Life Time: 160+ clubs, >1M members (2024). Insurer/corporate ties expand B2B revenue; corporate wellness ~$57.3B (2022). Tech partners pushed digital engagement +20% YoY (2024).
| Partner type | Impact metric | 2024 stat |
|---|---|---|
| Equipment | Market size | >$15B |
| Clubs/Members | Scale | 160+ clubs, >1M members |
| Digital | Engagement growth | +20% YoY |
What is included in the product
 Detailed Word Document
A concise, pre-written Business Model Canvas for Life Time that maps customer segments, channels, value propositions, revenue streams and key activities into the nine BMC blocks with narrative and insights. Ideal for presentations and investor discussions, it includes competitive advantage analysis, linked SWOT, and real-world operational validation to support strategic decisions.

 Customizable Excel Spreadsheet
High-level, editable one-page snapshot that condenses Life Time’s strategy, eases brainstorming and team collaboration, and saves hours structuring models for boardrooms or comparative analysis.
Activities

Club operations and facility management
Daily upkeep of gyms, pools, courts and lounges sustains Life Time’s luxury standard across 170+ clubs; as of 2024 the chain reported over $2 billion in annual revenue, underscoring the premium model’s scale. Rigorous preventive maintenance preserves asset life and safety, cutting repair cycles and liability exposure. Intelligent scheduling boosts space utilization during peak hours, while housekeeping and curated ambiance directly drive perceived value and retention.
Programming: classes, training, and sports
Programming across 160+ Life Time clubs serving ~1.4 million members uses diverse, high-quality schedules to attract multiple segments; Life Time-certified trainers and standardized coaching protocols ensure measurable outcomes and higher retention. Seasonal leagues and camps smooth off-peak demand and drive cross-sell revenue, while quarterly format innovation keeps offerings fresh and sticky.

Member acquisition and retention marketing
Local outreach, referral programs, and digital funnels fill Life Time’s membership pipeline, tapping a 2024 global health and fitness market valued at about $107 billion (Statista). Onboarding journeys focus on the first 30 days to drive early habit formation and higher 90-day retention. Lifecycle campaigns lift visit frequency and ARPU through tiered offers and add-ons. Churn analytics enable targeted saves and win-backs by segmenting at-risk cohorts.

Spa, cafe, and retail operations
Ancillary spa, cafe and retail services expand share of wallet and dwell time, driving higher per-member revenue and visit frequency. Menu engineering and merchandising raise margins through SKU mix and price elasticity testing. Inventory and labor optimization protect profitability while loyalty tie-ins in 2024 boost repeat purchases and cross-sell conversion.
- Ancillary revenue: higher per-member spend
- Menu engineering: margin uplift
- Ops: inventory & labor efficiency
- Loyalty: increased repeat visits
Technology, data, and member experience
Life Time’s apps power booking, access, and on-demand content, driving member engagement across clubs and digital channels; 2024 app sessions grew in the low double digits year-over-year, boosting usage and ancillary revenue. Personalization lifts satisfaction and conversion—McKinsey 2024 shows personalization can increase revenues by 10–15%—while NPS and rapid feedback loops prioritize roadmap changes. Rigorous security and privacy controls sustain trust; average global breach costs approached $4.45M in 2024, underscoring investment need.
- Apps: booking, access, content
- Personalization: +10–15% revenue (McKinsey 2024)
- Feedback: NPS-driven product cycles
- Security: avg breach cost ~$4.45M (2024)
170+ clubs, >$2B revenue: ops, personalization and digital lift retention
Life Time runs daily facility operations, preventive maintenance and intelligent scheduling across 170+ clubs to protect a premium experience and drive retention; 2024 revenue exceeded $2B. High-quality programming, certified trainers and seasonal formats serve ~1.4M members and smooth demand. Digital platforms (app sessions +~10% YoY) and ancillary services lift ARPU while personalization (+10–15%) and security investments reduce churn and risk.
| Metric | 2024 value |
|---|---|
| Clubs | 170+ |
| Members | ~1.4M |
| Revenue | >$2B |
| App sessions YoY | +~10% |
| Personalization impact | +10–15% |
| Avg breach cost | $4.45M |
What You See Is What You Get
Business Model Canvas
The Life Time Business Model Canvas you’re previewing is the actual deliverable, not a mockup—what you see is a direct excerpt from the full file you’ll receive after purchase. Upon ordering, you’ll download this same complete, editable document ready for presentation and implementation. No placeholders, no surprises.

Product Information
Product Information
Shipping & Returns
Shipping & Returns
Description
Concise Business Model Canvas for winning health, fitness, and lifestyle markets
Unlock Life Time’s strategic blueprint with a concise Business Model Canvas that maps its value propositions, key partners, and revenue levers to show how it wins in health, fitness, and lifestyle markets. Perfect for entrepreneurs, consultants, and investors seeking actionable insight and benchmarking. Purchase the full, editable Canvas (Word & Excel) to access all nine blocks, financial implications, and ready-to-use slides for strategic planning.
Partnerships
Premium fitness equipment suppliers
Securing long-term agreements with top-tier equipment brands ensures reliability and higher member satisfaction and allows Life Time to lock favorable pricing; the commercial fitness equipment market exceeded $15 billion in 2024. Co-marketing and early access to innovations differentiate clubs and drive trial rates. Service-level guarantees reduce downtime and protect the premium experience. Network-wide volume purchasing lowers unit costs and improves margin consistency.
Wellness, spa, and beauty product vendors
Curated product partners elevate spa services and retail margins, with premium retail markups in the spa sector commonly exceeding 50% and driving incremental per-member spend; Life Time’s upscale positioning targets this high-margin segment. Co-branded treatments and seasonal menus refresh offerings without heavy R&D, enabling faster rollouts and typical campaign lift of 10–15% in service bookings. Vendor training improves staff expertise and upsell rates—third-party training programs have been shown to boost conversion by roughly 12–18%. Preferred pricing and exclusive SKUs reinforce luxury positioning and help capture repeat retail spend from a membership base that industry reports estimate spends materially more on wellness than non-members.
Health insurers and corporate wellness programs
Partnerships with health insurers and corporate wellness programs enable subsidized Life Time memberships, expanding the corporate client base and driving B2B revenue. Data-driven wellness outcomes (claims-linked metrics) support reimbursement and incentive programs, with the global corporate wellness market valued at about USD 57.3 billion in 2022 and growing into 2024. Tailored employer programs improve engagement and retention, and co-sponsored challenges measurably increase utilization and health impact.
Local sports, youth leagues, and community orgs
Alliances with local sports, youth leagues, and community orgs feed aquatics, tennis, and youth programming at Life Time, leveraging a network across over 160 clubs and more than 1 million members (Life Time disclosures through 2024) to drive family memberships and lift off-peak usage via weekday lessons and weekend leagues.
- Shared facilities/events boost brand presence and retention
- Pipeline partnerships create recurring seasonal demand
- Community ties convert local teams into family memberships
Technology and digital fitness platforms
Technology and digital fitness partnerships enable Life Time to integrate apps, wearables, and streaming for hybrid class and at-home experiences; digital engagement rose roughly 20% year-over-year in 2024 as members shifted to omnichannel usage. Data flows power personalization and retention analytics, while joint development shortens feature-release cycles and open APIs streamline booking, payments, and access across ecosystems.
- Integration: apps + wearables + streaming = hybrid reach
- Data: personalization + retention analytics
- Joint dev: faster feature cadence
- Open APIs: frictionless booking, payments, access
Vendor deals lift margins: >$15B equipment, 160+ clubs, digital +20%
Long-term vendor deals and volume buying secure equipment reliability and margin lift; global commercial fitness equipment market >$15B in 2024. Spa/retail partners drive high-margin per-member spend; Life Time: 160+ clubs, >1M members (2024). Insurer/corporate ties expand B2B revenue; corporate wellness ~$57.3B (2022). Tech partners pushed digital engagement +20% YoY (2024).
| Partner type | Impact metric | 2024 stat |
|---|---|---|
| Equipment | Market size | >$15B |
| Clubs/Members | Scale | 160+ clubs, >1M members |
| Digital | Engagement growth | +20% YoY |
What is included in the product
Detailed Word Document
A concise, pre-written Business Model Canvas for Life Time that maps customer segments, channels, value propositions, revenue streams and key activities into the nine BMC blocks with narrative and insights. Ideal for presentations and investor discussions, it includes competitive advantage analysis, linked SWOT, and real-world operational validation to support strategic decisions.
Customizable Excel Spreadsheet
High-level, editable one-page snapshot that condenses Life Time’s strategy, eases brainstorming and team collaboration, and saves hours structuring models for boardrooms or comparative analysis.
Activities
Club operations and facility management
Daily upkeep of gyms, pools, courts and lounges sustains Life Time’s luxury standard across 170+ clubs; as of 2024 the chain reported over $2 billion in annual revenue, underscoring the premium model’s scale. Rigorous preventive maintenance preserves asset life and safety, cutting repair cycles and liability exposure. Intelligent scheduling boosts space utilization during peak hours, while housekeeping and curated ambiance directly drive perceived value and retention.
Programming: classes, training, and sports
Programming across 160+ Life Time clubs serving ~1.4 million members uses diverse, high-quality schedules to attract multiple segments; Life Time-certified trainers and standardized coaching protocols ensure measurable outcomes and higher retention. Seasonal leagues and camps smooth off-peak demand and drive cross-sell revenue, while quarterly format innovation keeps offerings fresh and sticky.
Member acquisition and retention marketing
Local outreach, referral programs, and digital funnels fill Life Time’s membership pipeline, tapping a 2024 global health and fitness market valued at about $107 billion (Statista). Onboarding journeys focus on the first 30 days to drive early habit formation and higher 90-day retention. Lifecycle campaigns lift visit frequency and ARPU through tiered offers and add-ons. Churn analytics enable targeted saves and win-backs by segmenting at-risk cohorts.
Spa, cafe, and retail operations
Ancillary spa, cafe and retail services expand share of wallet and dwell time, driving higher per-member revenue and visit frequency. Menu engineering and merchandising raise margins through SKU mix and price elasticity testing. Inventory and labor optimization protect profitability while loyalty tie-ins in 2024 boost repeat purchases and cross-sell conversion.
- Ancillary revenue: higher per-member spend
- Menu engineering: margin uplift
- Ops: inventory & labor efficiency
- Loyalty: increased repeat visits
Technology, data, and member experience
Life Time’s apps power booking, access, and on-demand content, driving member engagement across clubs and digital channels; 2024 app sessions grew in the low double digits year-over-year, boosting usage and ancillary revenue. Personalization lifts satisfaction and conversion—McKinsey 2024 shows personalization can increase revenues by 10–15%—while NPS and rapid feedback loops prioritize roadmap changes. Rigorous security and privacy controls sustain trust; average global breach costs approached $4.45M in 2024, underscoring investment need.
- Apps: booking, access, content
- Personalization: +10–15% revenue (McKinsey 2024)
- Feedback: NPS-driven product cycles
- Security: avg breach cost ~$4.45M (2024)
170+ clubs, >$2B revenue: ops, personalization and digital lift retention
Life Time runs daily facility operations, preventive maintenance and intelligent scheduling across 170+ clubs to protect a premium experience and drive retention; 2024 revenue exceeded $2B. High-quality programming, certified trainers and seasonal formats serve ~1.4M members and smooth demand. Digital platforms (app sessions +~10% YoY) and ancillary services lift ARPU while personalization (+10–15%) and security investments reduce churn and risk.
| Metric | 2024 value |
|---|---|
| Clubs | 170+ |
| Members | ~1.4M |
| Revenue | >$2B |
| App sessions YoY | +~10% |
| Personalization impact | +10–15% |
| Avg breach cost | $4.45M |
What You See Is What You Get
Business Model Canvas
The Life Time Business Model Canvas you’re previewing is the actual deliverable, not a mockup—what you see is a direct excerpt from the full file you’ll receive after purchase. Upon ordering, you’ll download this same complete, editable document ready for presentation and implementation. No placeholders, no surprises.