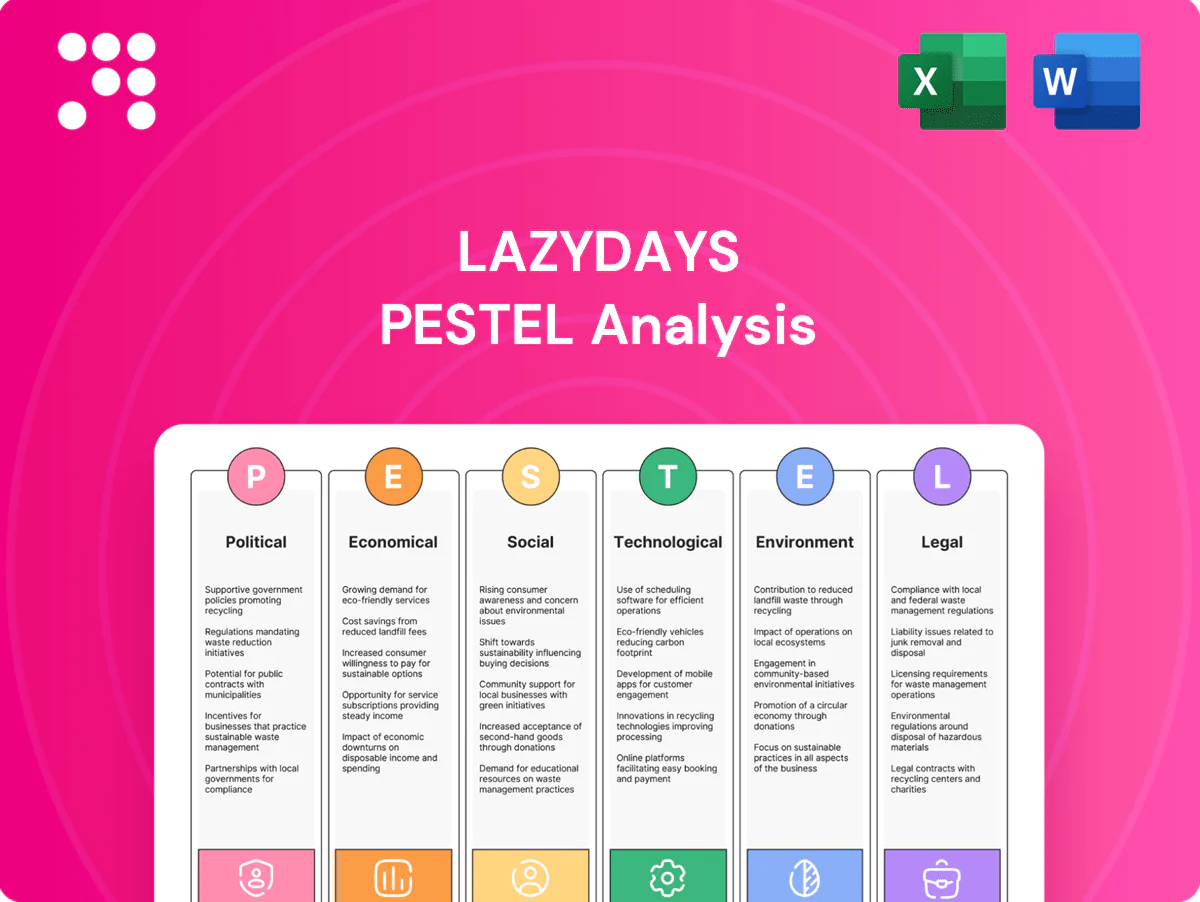
Lazydays PESTLE Analysis

Plan Smarter. Present Sharper. Compete Stronger.
Unlock how political shifts, economic cycles, and technological trends uniquely affect Lazydays with our concise PESTLE snapshot—perfect for investors and strategists. This analysis highlights risks and opportunities to guide smarter decisions. Buy the full PESTLE for the complete, actionable breakdown and downloadable formats.
Political factors

Fuel taxation and energy policy
Changes in federal and state fuel taxes affect RV operating costs and trip affordability — federal gasoline tax remains 18.4¢/gal and diesel 24.4¢/gal (since 1993) while state taxes commonly add ~30–40¢/gal. Energy policy and EV/alternative-fuel incentives (up to $7,500 federal EV credit) can shift demand toward more efficient tow vehicles and RVs. Lazydays must track policy shifts to adjust pricing, inventory and marketing and engage in industry lobbying to mitigate adverse tax proposals.
Tariffs and trade on RV components
Many RV components are sourced globally, leaving Lazydays exposed to tariff regimes such as the US Section 232 levies of 25% on steel and 10% on aluminum that raise input costs. New or higher tariffs on electronics or textiles would compress margins and force retail price increases. Lazydays may need to reprice, renegotiate supplier contracts or hold larger parts inventories to hedge supply risk. Trade normalization would reduce cost pressure and support demand recovery.

Public lands and camping access policy
Federal and state campground, permit and park-capacity policies directly shape RV usage; BLM manages about 245 million acres of public lands and NPS recorded over 312 million recreation visits in 2023, signaling demand drivers for Lazydays. Expanded access and investment boost utilization and support over 500,000 annual RV wholesale shipments, lifting new and used unit sales. Conversely, restrictions or closures cut trip frequency and service revenue. Advocacy for campground funding aligns with Lazydays’ aftermarket and sales ecosystem.

Infrastructure and road funding
Highway maintenance and expansion directly affect RV travel quality and safety; the Bipartisan Infrastructure Law allocated about 110 billion for roads and bridges, improving pavement and bridge conditions. Funding bills that boost pavement quality increase consumer confidence in long-distance RV trips and reduce roadside incidents. Weaker infrastructure raises ownership friction and service incidents, while policies supporting rest areas and RV-friendly facilities lower Lazydays service costs and encourage travel.
- Road funding: $110B from Bipartisan Infrastructure Law
- Improved roads increase long-distance trip confidence and reduce incidents
- Rest-area and RV-friendly policy reduces Lazydays service costs
State dealership and franchise frameworks
State-level rules shape how dealerships sell, service, and represent OEM brands across all 50 U.S. states. Licensing, facility standards, and sales practices vary by state, adding compliance complexity and higher operating costs. Favorable frameworks enable multi-state expansion and consistency; unfavorable changes can restrict territories or force capital-intensive facility upgrades.
- Regulation scope: 50 states
- Risk: increased compliance costs
- Opportunity: smoother multi-state rollout
Policy shifts reshape travel costs and demand: fuel taxes, tariffs, EV credits, roads funding
Political risks—fuel tax (federal 18.4¢/gal gas; diesel 24.4¢/gal), tariffs (Section 232: steel 25%, aluminum 10%) and EV incentives (up to $7,500) reshape costs and demand. Public-land access (BLM 245M acres; NPS 312M visits 2023) and $110B roads funding affect travel. State dealer rules (50 states) raise compliance costs and shape expansion.
| Metric | Value |
|---|---|
| Federal fuel tax | 18.4¢/gal gas; 24.4¢/gal diesel |
| Section 232 tariffs | Steel 25% / Al 10% |
| EV credit | Up to $7,500 |
| Public lands | BLM 245M acres; NPS 312M visits (2023) |
| Infrastructure | $110B roads |
| RV shipments | ~500,000 annually |
| States | 50 |
What is included in the product
 Detailed Word Document
Explores how macro-environmental factors uniquely affect Lazydays across Political, Economic, Social, Technological, Environmental and Legal dimensions, with data-driven insights and region-specific trends. Designed for executives and investors, the analysis is formatted for reports and includes forward-looking scenarios, actionable opportunities and risks tied to market and regulatory dynamics.

 Customizable Excel Spreadsheet
A concise, visually segmented PESTLE summary for Lazydays that streamlines external risk assessment and market positioning, easily dropped into presentations or shared for quick team alignment.
Economic factors

Interest rates and credit availability
RV purchases are highly rate-sensitive: with the prime rate at 8.50% in 2024, higher financing costs raise monthly payments and push buyers toward used units, while easing credit expands volumes and F&I income; Lazydays must flex promotional APRs and lender panels to sustain throughput and conversion.
Fuel prices and travel costs
Fuel price volatility—EIA reported U.S. retail regular gasoline averaged about $3.65/gal in 2024 and hovered near $3.60/gal mid-2025—directly affects RV trip frequency and total cost of ownership, with higher fuel costs compressing miles and accessory/service spend. Lower prices historically boost usage and aftermarket sales, while price spikes delay purchases or prompt trade-downs. Marketing hedges toward fuel-efficient floorplans can cushion demand swings.

Consumer confidence and discretionary spend
RVs are big-ticket discretionary purchases closely tied to household wealth and employment; sustained demand benefits from tight labor markets (U.S. unemployment averaged 3.7% in 2024, BLS). Strong equities and higher net worth boost foot traffic, while downturns suppress it. Lazydays can emphasize value propositions — certified used inventory and rental programs — to capture price-sensitive buyers. Ancillary services (service, parts, financing, F&I) provide recurring revenue that stabilizes results across cycles.

Used inventory values and trade-ins
Residual values drive buyer affordability through trade equity; used RV values, which fell roughly 25% from 2021 peaks into 2024, materially reduce available trade-in equity and squeeze new-unit affordability. Rapid depreciation or inventory glut compresses margins and lowers reconditioning ROI, while tight supply in late 2024 supported higher used pricing but limited volume. Dynamic appraisal and wholesale channel agility are critical to preserve turns and margin.
- Residual impact: trade equity key to affordability
- Depreciation: ~25% decline from 2021 peaks to 2024
- Tight supply: supports price but caps volume
- Need: fast appraisals and active wholesale channels
Regional growth and migration
Sunbelt and outdoor-centric regions continue to lead RV penetration, driven by faster population growth in states like Texas and Florida per recent Census trends; local income gains and housing affordability shifts strongly influence Lazydays store performance and average ticket. Site selection and expansion of mobile service routes should track inland migration corridors and seasonal tourist flows, which amplify regional seasonality and dealership utilization.
- Sunbelt-led population growth
- Income & housing affect sales
- Align sites with migration
- Tourism increases seasonality
Policy shifts reshape travel costs and demand: fuel taxes, tariffs, EV credits, roads funding
Higher financing costs (prime ~8.50% in 2024) and a 3.7% unemployment in 2024 make RV demand rate- and income-sensitive, pushing buyers to used units and rentals. U.S. fuel ~ $3.65/gal in 2024 and ~25% decline in used RV values vs 2021 compress affordability and margin, while Sunbelt growth (TX/FL) sustains regional demand; rapid appraisal and wholesale agility are essential.
| Metric | 2024/2025 | Impact |
|---|---|---|
| Prime rate | 8.50% (2024) | Raises financing costs |
| Unemployment | 3.7% (2024) | Supports demand |
| Gasoline | $3.65/gal (2024) | Usage & aftermarket |
| Used RV values | -25% vs 2021 | Reduces trade equity |
Same Document Delivered
Lazydays PESTLE Analysis
The preview shown here is the exact Lazydays PESTLE Analysis document you’ll receive after purchase—fully formatted, professionally structured, and ready to use. No placeholders or teasers: this is the real file you’ll download immediately after payment. The layout, content, and structure visible here are exactly what you’ll be working with.

Product Information
Product Information
Shipping & Returns
Shipping & Returns
Description
Plan Smarter. Present Sharper. Compete Stronger.
Unlock how political shifts, economic cycles, and technological trends uniquely affect Lazydays with our concise PESTLE snapshot—perfect for investors and strategists. This analysis highlights risks and opportunities to guide smarter decisions. Buy the full PESTLE for the complete, actionable breakdown and downloadable formats.
Political factors
Fuel taxation and energy policy
Changes in federal and state fuel taxes affect RV operating costs and trip affordability — federal gasoline tax remains 18.4¢/gal and diesel 24.4¢/gal (since 1993) while state taxes commonly add ~30–40¢/gal. Energy policy and EV/alternative-fuel incentives (up to $7,500 federal EV credit) can shift demand toward more efficient tow vehicles and RVs. Lazydays must track policy shifts to adjust pricing, inventory and marketing and engage in industry lobbying to mitigate adverse tax proposals.
Tariffs and trade on RV components
Many RV components are sourced globally, leaving Lazydays exposed to tariff regimes such as the US Section 232 levies of 25% on steel and 10% on aluminum that raise input costs. New or higher tariffs on electronics or textiles would compress margins and force retail price increases. Lazydays may need to reprice, renegotiate supplier contracts or hold larger parts inventories to hedge supply risk. Trade normalization would reduce cost pressure and support demand recovery.
Public lands and camping access policy
Federal and state campground, permit and park-capacity policies directly shape RV usage; BLM manages about 245 million acres of public lands and NPS recorded over 312 million recreation visits in 2023, signaling demand drivers for Lazydays. Expanded access and investment boost utilization and support over 500,000 annual RV wholesale shipments, lifting new and used unit sales. Conversely, restrictions or closures cut trip frequency and service revenue. Advocacy for campground funding aligns with Lazydays’ aftermarket and sales ecosystem.
Infrastructure and road funding
Highway maintenance and expansion directly affect RV travel quality and safety; the Bipartisan Infrastructure Law allocated about 110 billion for roads and bridges, improving pavement and bridge conditions. Funding bills that boost pavement quality increase consumer confidence in long-distance RV trips and reduce roadside incidents. Weaker infrastructure raises ownership friction and service incidents, while policies supporting rest areas and RV-friendly facilities lower Lazydays service costs and encourage travel.
- Road funding: $110B from Bipartisan Infrastructure Law
- Improved roads increase long-distance trip confidence and reduce incidents
- Rest-area and RV-friendly policy reduces Lazydays service costs
State dealership and franchise frameworks
State-level rules shape how dealerships sell, service, and represent OEM brands across all 50 U.S. states. Licensing, facility standards, and sales practices vary by state, adding compliance complexity and higher operating costs. Favorable frameworks enable multi-state expansion and consistency; unfavorable changes can restrict territories or force capital-intensive facility upgrades.
- Regulation scope: 50 states
- Risk: increased compliance costs
- Opportunity: smoother multi-state rollout
Policy shifts reshape travel costs and demand: fuel taxes, tariffs, EV credits, roads funding
Political risks—fuel tax (federal 18.4¢/gal gas; diesel 24.4¢/gal), tariffs (Section 232: steel 25%, aluminum 10%) and EV incentives (up to $7,500) reshape costs and demand. Public-land access (BLM 245M acres; NPS 312M visits 2023) and $110B roads funding affect travel. State dealer rules (50 states) raise compliance costs and shape expansion.
| Metric | Value |
|---|---|
| Federal fuel tax | 18.4¢/gal gas; 24.4¢/gal diesel |
| Section 232 tariffs | Steel 25% / Al 10% |
| EV credit | Up to $7,500 |
| Public lands | BLM 245M acres; NPS 312M visits (2023) |
| Infrastructure | $110B roads |
| RV shipments | ~500,000 annually |
| States | 50 |
What is included in the product
Detailed Word Document
Explores how macro-environmental factors uniquely affect Lazydays across Political, Economic, Social, Technological, Environmental and Legal dimensions, with data-driven insights and region-specific trends. Designed for executives and investors, the analysis is formatted for reports and includes forward-looking scenarios, actionable opportunities and risks tied to market and regulatory dynamics.
Customizable Excel Spreadsheet
A concise, visually segmented PESTLE summary for Lazydays that streamlines external risk assessment and market positioning, easily dropped into presentations or shared for quick team alignment.
Economic factors
Interest rates and credit availability
RV purchases are highly rate-sensitive: with the prime rate at 8.50% in 2024, higher financing costs raise monthly payments and push buyers toward used units, while easing credit expands volumes and F&I income; Lazydays must flex promotional APRs and lender panels to sustain throughput and conversion.
Fuel prices and travel costs
Fuel price volatility—EIA reported U.S. retail regular gasoline averaged about $3.65/gal in 2024 and hovered near $3.60/gal mid-2025—directly affects RV trip frequency and total cost of ownership, with higher fuel costs compressing miles and accessory/service spend. Lower prices historically boost usage and aftermarket sales, while price spikes delay purchases or prompt trade-downs. Marketing hedges toward fuel-efficient floorplans can cushion demand swings.
Consumer confidence and discretionary spend
RVs are big-ticket discretionary purchases closely tied to household wealth and employment; sustained demand benefits from tight labor markets (U.S. unemployment averaged 3.7% in 2024, BLS). Strong equities and higher net worth boost foot traffic, while downturns suppress it. Lazydays can emphasize value propositions — certified used inventory and rental programs — to capture price-sensitive buyers. Ancillary services (service, parts, financing, F&I) provide recurring revenue that stabilizes results across cycles.
Used inventory values and trade-ins
Residual values drive buyer affordability through trade equity; used RV values, which fell roughly 25% from 2021 peaks into 2024, materially reduce available trade-in equity and squeeze new-unit affordability. Rapid depreciation or inventory glut compresses margins and lowers reconditioning ROI, while tight supply in late 2024 supported higher used pricing but limited volume. Dynamic appraisal and wholesale channel agility are critical to preserve turns and margin.
- Residual impact: trade equity key to affordability
- Depreciation: ~25% decline from 2021 peaks to 2024
- Tight supply: supports price but caps volume
- Need: fast appraisals and active wholesale channels
Regional growth and migration
Sunbelt and outdoor-centric regions continue to lead RV penetration, driven by faster population growth in states like Texas and Florida per recent Census trends; local income gains and housing affordability shifts strongly influence Lazydays store performance and average ticket. Site selection and expansion of mobile service routes should track inland migration corridors and seasonal tourist flows, which amplify regional seasonality and dealership utilization.
- Sunbelt-led population growth
- Income & housing affect sales
- Align sites with migration
- Tourism increases seasonality
Policy shifts reshape travel costs and demand: fuel taxes, tariffs, EV credits, roads funding
Higher financing costs (prime ~8.50% in 2024) and a 3.7% unemployment in 2024 make RV demand rate- and income-sensitive, pushing buyers to used units and rentals. U.S. fuel ~ $3.65/gal in 2024 and ~25% decline in used RV values vs 2021 compress affordability and margin, while Sunbelt growth (TX/FL) sustains regional demand; rapid appraisal and wholesale agility are essential.
| Metric | 2024/2025 | Impact |
|---|---|---|
| Prime rate | 8.50% (2024) | Raises financing costs |
| Unemployment | 3.7% (2024) | Supports demand |
| Gasoline | $3.65/gal (2024) | Usage & aftermarket |
| Used RV values | -25% vs 2021 | Reduces trade equity |
Same Document Delivered
Lazydays PESTLE Analysis
The preview shown here is the exact Lazydays PESTLE Analysis document you’ll receive after purchase—fully formatted, professionally structured, and ready to use. No placeholders or teasers: this is the real file you’ll download immediately after payment. The layout, content, and structure visible here are exactly what you’ll be working with.











