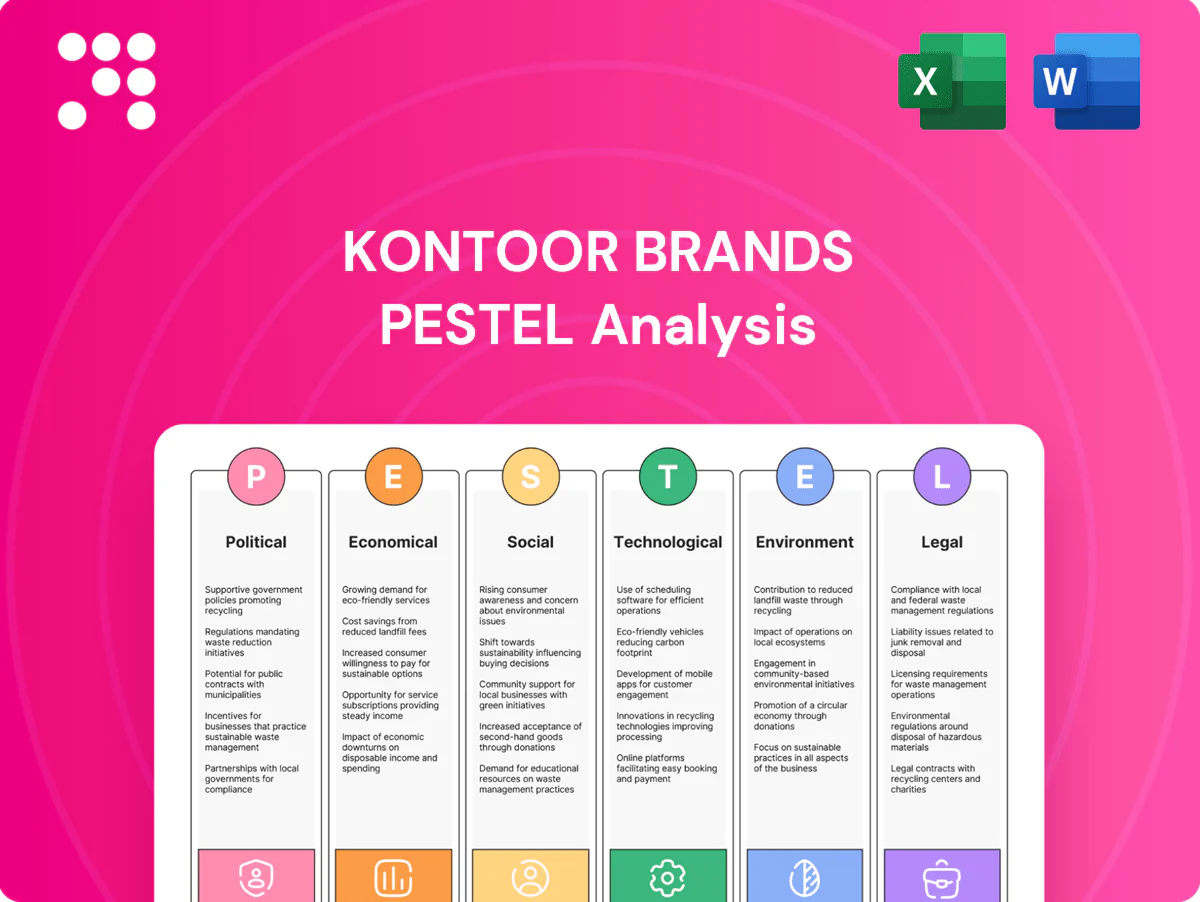
Kontoor Brands PESTLE Analysis

Your Shortcut to Market Insight Starts Here
Discover how political shifts, economic cycles, social trends, and technology are reshaping Kontoor Brands’ competitive edge in our concise PESTLE snapshot—perfect for investors and strategists seeking high-impact insights. Dive deeper into regulatory, environmental, and legal risks with the full analysis; buy now to unlock actionable intelligence and ready-to-use findings.
Political factors

Trade policy and tariffs exposure
As a global apparel brand, Kontoor faces tariff volatility—Section 301 and retaliatory duties on Chinese apparel can raise landed costs by up to 25%, affecting denim sourced between the U.S., China, Mexico and Vietnam. Such tariffs have shifted sourcing toward Mexico and Vietnam; proactive diversification and leveraging free‑trade agreements like USMCA are critical. Political shifts can rapidly change duty rates and quota regimes, altering margins and supply mix.
Geopolitical supply chain risk
Political instability in sourcing hubs can shutter fabric mills and cut-and-sew capacity, forcing Kontoor Brands to rely on multi-country sourcing and safety stock; apparel supply chains typically carry 8–12 weeks of inventory. Route insecurity—Red Sea attacks and Panama Canal draft limits—cut transits (Panama down ~20% in 2023) and have added 7–10 days or spiked spot rates. Export controls on specialty dyes and machinery further risk input availability and lead times.

Industrial and labor policy in sourcing nations
Shifts in minimum wages and labor protections—e.g., Bangladesh's 2023 garment wage of 12,500 taka and Vietnam's 2024 regional minimum wage rises of roughly 4–6%—directly raise Kontoor Brands' sourcing costs across Bangladesh, Vietnam, India and Mexico. Elections and reforms, including India's Code on Wages consolidation, can change compliance burdens and audit costs. Nearshoring incentives (USMCA-linked programs, Mexico's IMMEX) can reshape the footprint, making stability and predictability vital for long-term vendor partnerships.

Government sustainability agendas
- Policy: tighter textile-waste rules driving circular design
- Procurement: ~12% of GDP market favors low-impact apparel
- Scale: US 17M tons textile waste (EPA 2018)
- Incentives: grants/subsidies can reduce water/energy capex
- Risk: non-compliance → exclusion from public contracts
Consumer nationalism and brand perception
Consumer nationalism and buy-local narratives can shift demand toward domestically-made denim, making country-of-origin labeling a political and marketing lever; misalignment with local sentiment risks boycotts and reputational pressure, while localized sourcing and manufacturing act as hedges against sudden sentiment swings.
- Buy-local influences demand
- Country-of-origin = marketing tool
- Reputational risk from misalignment
- Localization mitigates volatility
Tariff swings, port disruptions and wage pressure force apparel nearshoring and higher costs
Kontoor faces tariff swings (Section 301/retaliatory duties up to 25%) driving nearshoring to Mexico/VN and USMCA reliance. Political instability and route disruptions (Panama -20% 2023; Red Sea delays +7–10 days) raise lead times and spot freight. Labor/wage rises (Bangladesh 12,500 taka 2023; VN +4–6% 2024) and tightened textile‑waste rules (US 17M t 2018) increase sourcing and compliance costs.
| Factor | Key stat | Impact |
|---|---|---|
| Tariffs | Up to 25% | Higher landed cost |
| Logistics | Panama -20% (2023) | Longer transit, higher rates |
| Labor | BD 12,500 taka; VN +4–6% | Rising COGS |
| Regulation | US textile waste 17M t | Compliance cost |
What is included in the product
 Detailed Word Document
Explores how external macro-environmental factors uniquely affect Kontoor Brands across Political, Economic, Social, Technological, Environmental, and Legal dimensions, with each section grounded in current data and industry trends. Designed for executives and investors, the analysis highlights actionable risks and opportunities, includes forward-looking scenario insights, and is formatted for seamless inclusion in plans or pitch decks.

 Customizable Excel Spreadsheet
A concise, visually segmented PESTLE summary of Kontoor Brands that distills external risks and opportunities into plain-language, editable notes for region or product teams, easily dropped into slides or shared across departments to speed strategic alignment and planning.
Economic factors

Consumer spending and denim cycle
Wrangler and Lee demand is highly sensitive to disposable income and fashion cycles; Kontoor Brands reported approximately $2.6 billion in net sales in FY2024, underscoring denim reliance on stable spending. Tight credit and elevated inflation (U.S. CPI around 3–4% in 2024) pushed shoppers toward value channels and promotions. Recovery phases historically boost full-price sell-through, while workwear remains resilient even as discretionary tops and bottoms stay cyclical.
Input costs: cotton and energy
ICE cotton futures averaged about $0.90 per lb in 2024 with intra-year swings near 25%, directly lifting denim COGS; US industrial natural gas around $3.50/MMBtu in 2024 similarly elevated mills’ dyeing and finishing costs. Hedging, fabric engineering and fiber‑blend optimization have helped protect margins, while longer-term contracts with spinners stabilize supply amid droughts or bumper crops.

FX fluctuations and global revenues
Kontoor’s multi-currency sales and sourcing—international markets making roughly 30% of net sales in FY2024—create both translation and transaction risk as exchange moves alter reported revenue and margins. Dollar strength (trade‑weighted USD up about 8% y/y in 2024) has compressed international revenue while lowering import costs and boosting purchasing power. Natural hedges from local sourcing and currency offsets reduce but do not eliminate volatility, so pricing actions and regional mix shifts remain active levers to protect margins.

Channel mix and DTC profitability
Wholesale volumes drive scale for Kontoor Brands while DTC yields higher gross margins and richer consumer data, though e-commerce logistics and elevated return rates can compress unit economics during downturns; optimizing store footprint and digital marketing ROAS is therefore critical, and marketplace policies affect visibility and platform take rates.
- Wholesale scale vs DTC margin/data trade-off
- E‑commerce logistics and returns pressure unit economics
- Store footprint and digital ROAS optimization essential
- Marketplace rules affect visibility and fees
Inventory and working capital cycles
Inventory and working capital cycles are critical for Kontoor Brands as apparel lead times, typically 8–16 weeks, demand forecasting accuracy to avoid markdowns. Macro shocks can create inventory overhangs or shortages that tie up capital. Gartner reports demand sensing and disciplined S&OP can cut forecast error up to 30%, dampening bullwhip. Higher financing costs—Fed funds around 5.25% in 2024—increase inventory carrying expense.
- Lead times: 8–16 weeks
- Macro risk: overhangs or shortages
- S&OP/demand sensing: forecast error down up to 30%
- Financing costs: Fed funds ~5.25% (2024)
Tariff swings, port disruptions and wage pressure force apparel nearshoring and higher costs
Kontoor’s denim demand tied to discretionary spending — net sales ~$2.6B FY2024 — and consumer sensitivity amid U.S. CPI ~3–4% in 2024 pressures promotions. Input cost swings (ICE cotton ~$0.90/lb avg 2024; US industrial gas ~$3.50/MMBtu) and Fed funds ~5.25% raise COGS and carrying costs. FX (trade‑weighted USD +8% y/y 2024) and ~30% international mix amplify translation and sourcing volatility.
| Metric | 2024 Value |
|---|---|
| Net sales | $2.6B |
| U.S. CPI | ~3–4% |
| ICE cotton (avg) | $0.90/lb |
| Industrial gas | $3.50/MMBtu |
| Fed funds | ~5.25% |
| USD trade‑weighted | +8% y/y |
| Intl sales share | ~30% |
What You See Is What You Get
Kontoor Brands PESTLE Analysis
The Kontoor Brands PESTLE Analysis provides concise political, economic, social, technological, legal and environmental insights tailored for investors and strategists. The preview shown here is the exact document you’ll receive after purchase—fully formatted and ready to use. Use it to inform valuation, risk assessment and strategic planning immediately upon download.

Product Information
Product Information
Shipping & Returns
Shipping & Returns
Description
Your Shortcut to Market Insight Starts Here
Discover how political shifts, economic cycles, social trends, and technology are reshaping Kontoor Brands’ competitive edge in our concise PESTLE snapshot—perfect for investors and strategists seeking high-impact insights. Dive deeper into regulatory, environmental, and legal risks with the full analysis; buy now to unlock actionable intelligence and ready-to-use findings.
Political factors
Trade policy and tariffs exposure
As a global apparel brand, Kontoor faces tariff volatility—Section 301 and retaliatory duties on Chinese apparel can raise landed costs by up to 25%, affecting denim sourced between the U.S., China, Mexico and Vietnam. Such tariffs have shifted sourcing toward Mexico and Vietnam; proactive diversification and leveraging free‑trade agreements like USMCA are critical. Political shifts can rapidly change duty rates and quota regimes, altering margins and supply mix.
Geopolitical supply chain risk
Political instability in sourcing hubs can shutter fabric mills and cut-and-sew capacity, forcing Kontoor Brands to rely on multi-country sourcing and safety stock; apparel supply chains typically carry 8–12 weeks of inventory. Route insecurity—Red Sea attacks and Panama Canal draft limits—cut transits (Panama down ~20% in 2023) and have added 7–10 days or spiked spot rates. Export controls on specialty dyes and machinery further risk input availability and lead times.
Industrial and labor policy in sourcing nations
Shifts in minimum wages and labor protections—e.g., Bangladesh's 2023 garment wage of 12,500 taka and Vietnam's 2024 regional minimum wage rises of roughly 4–6%—directly raise Kontoor Brands' sourcing costs across Bangladesh, Vietnam, India and Mexico. Elections and reforms, including India's Code on Wages consolidation, can change compliance burdens and audit costs. Nearshoring incentives (USMCA-linked programs, Mexico's IMMEX) can reshape the footprint, making stability and predictability vital for long-term vendor partnerships.
Government sustainability agendas
- Policy: tighter textile-waste rules driving circular design
- Procurement: ~12% of GDP market favors low-impact apparel
- Scale: US 17M tons textile waste (EPA 2018)
- Incentives: grants/subsidies can reduce water/energy capex
- Risk: non-compliance → exclusion from public contracts
Consumer nationalism and brand perception
Consumer nationalism and buy-local narratives can shift demand toward domestically-made denim, making country-of-origin labeling a political and marketing lever; misalignment with local sentiment risks boycotts and reputational pressure, while localized sourcing and manufacturing act as hedges against sudden sentiment swings.
- Buy-local influences demand
- Country-of-origin = marketing tool
- Reputational risk from misalignment
- Localization mitigates volatility
Tariff swings, port disruptions and wage pressure force apparel nearshoring and higher costs
Kontoor faces tariff swings (Section 301/retaliatory duties up to 25%) driving nearshoring to Mexico/VN and USMCA reliance. Political instability and route disruptions (Panama -20% 2023; Red Sea delays +7–10 days) raise lead times and spot freight. Labor/wage rises (Bangladesh 12,500 taka 2023; VN +4–6% 2024) and tightened textile‑waste rules (US 17M t 2018) increase sourcing and compliance costs.
| Factor | Key stat | Impact |
|---|---|---|
| Tariffs | Up to 25% | Higher landed cost |
| Logistics | Panama -20% (2023) | Longer transit, higher rates |
| Labor | BD 12,500 taka; VN +4–6% | Rising COGS |
| Regulation | US textile waste 17M t | Compliance cost |
What is included in the product
Detailed Word Document
Explores how external macro-environmental factors uniquely affect Kontoor Brands across Political, Economic, Social, Technological, Environmental, and Legal dimensions, with each section grounded in current data and industry trends. Designed for executives and investors, the analysis highlights actionable risks and opportunities, includes forward-looking scenario insights, and is formatted for seamless inclusion in plans or pitch decks.
Customizable Excel Spreadsheet
A concise, visually segmented PESTLE summary of Kontoor Brands that distills external risks and opportunities into plain-language, editable notes for region or product teams, easily dropped into slides or shared across departments to speed strategic alignment and planning.
Economic factors
Consumer spending and denim cycle
Wrangler and Lee demand is highly sensitive to disposable income and fashion cycles; Kontoor Brands reported approximately $2.6 billion in net sales in FY2024, underscoring denim reliance on stable spending. Tight credit and elevated inflation (U.S. CPI around 3–4% in 2024) pushed shoppers toward value channels and promotions. Recovery phases historically boost full-price sell-through, while workwear remains resilient even as discretionary tops and bottoms stay cyclical.
Input costs: cotton and energy
ICE cotton futures averaged about $0.90 per lb in 2024 with intra-year swings near 25%, directly lifting denim COGS; US industrial natural gas around $3.50/MMBtu in 2024 similarly elevated mills’ dyeing and finishing costs. Hedging, fabric engineering and fiber‑blend optimization have helped protect margins, while longer-term contracts with spinners stabilize supply amid droughts or bumper crops.
FX fluctuations and global revenues
Kontoor’s multi-currency sales and sourcing—international markets making roughly 30% of net sales in FY2024—create both translation and transaction risk as exchange moves alter reported revenue and margins. Dollar strength (trade‑weighted USD up about 8% y/y in 2024) has compressed international revenue while lowering import costs and boosting purchasing power. Natural hedges from local sourcing and currency offsets reduce but do not eliminate volatility, so pricing actions and regional mix shifts remain active levers to protect margins.
Channel mix and DTC profitability
Wholesale volumes drive scale for Kontoor Brands while DTC yields higher gross margins and richer consumer data, though e-commerce logistics and elevated return rates can compress unit economics during downturns; optimizing store footprint and digital marketing ROAS is therefore critical, and marketplace policies affect visibility and platform take rates.
- Wholesale scale vs DTC margin/data trade-off
- E‑commerce logistics and returns pressure unit economics
- Store footprint and digital ROAS optimization essential
- Marketplace rules affect visibility and fees
Inventory and working capital cycles
Inventory and working capital cycles are critical for Kontoor Brands as apparel lead times, typically 8–16 weeks, demand forecasting accuracy to avoid markdowns. Macro shocks can create inventory overhangs or shortages that tie up capital. Gartner reports demand sensing and disciplined S&OP can cut forecast error up to 30%, dampening bullwhip. Higher financing costs—Fed funds around 5.25% in 2024—increase inventory carrying expense.
- Lead times: 8–16 weeks
- Macro risk: overhangs or shortages
- S&OP/demand sensing: forecast error down up to 30%
- Financing costs: Fed funds ~5.25% (2024)
Tariff swings, port disruptions and wage pressure force apparel nearshoring and higher costs
Kontoor’s denim demand tied to discretionary spending — net sales ~$2.6B FY2024 — and consumer sensitivity amid U.S. CPI ~3–4% in 2024 pressures promotions. Input cost swings (ICE cotton ~$0.90/lb avg 2024; US industrial gas ~$3.50/MMBtu) and Fed funds ~5.25% raise COGS and carrying costs. FX (trade‑weighted USD +8% y/y 2024) and ~30% international mix amplify translation and sourcing volatility.
| Metric | 2024 Value |
|---|---|
| Net sales | $2.6B |
| U.S. CPI | ~3–4% |
| ICE cotton (avg) | $0.90/lb |
| Industrial gas | $3.50/MMBtu |
| Fed funds | ~5.25% |
| USD trade‑weighted | +8% y/y |
| Intl sales share | ~30% |
What You See Is What You Get
Kontoor Brands PESTLE Analysis
The Kontoor Brands PESTLE Analysis provides concise political, economic, social, technological, legal and environmental insights tailored for investors and strategists. The preview shown here is the exact document you’ll receive after purchase—fully formatted and ready to use. Use it to inform valuation, risk assessment and strategic planning immediately upon download.











