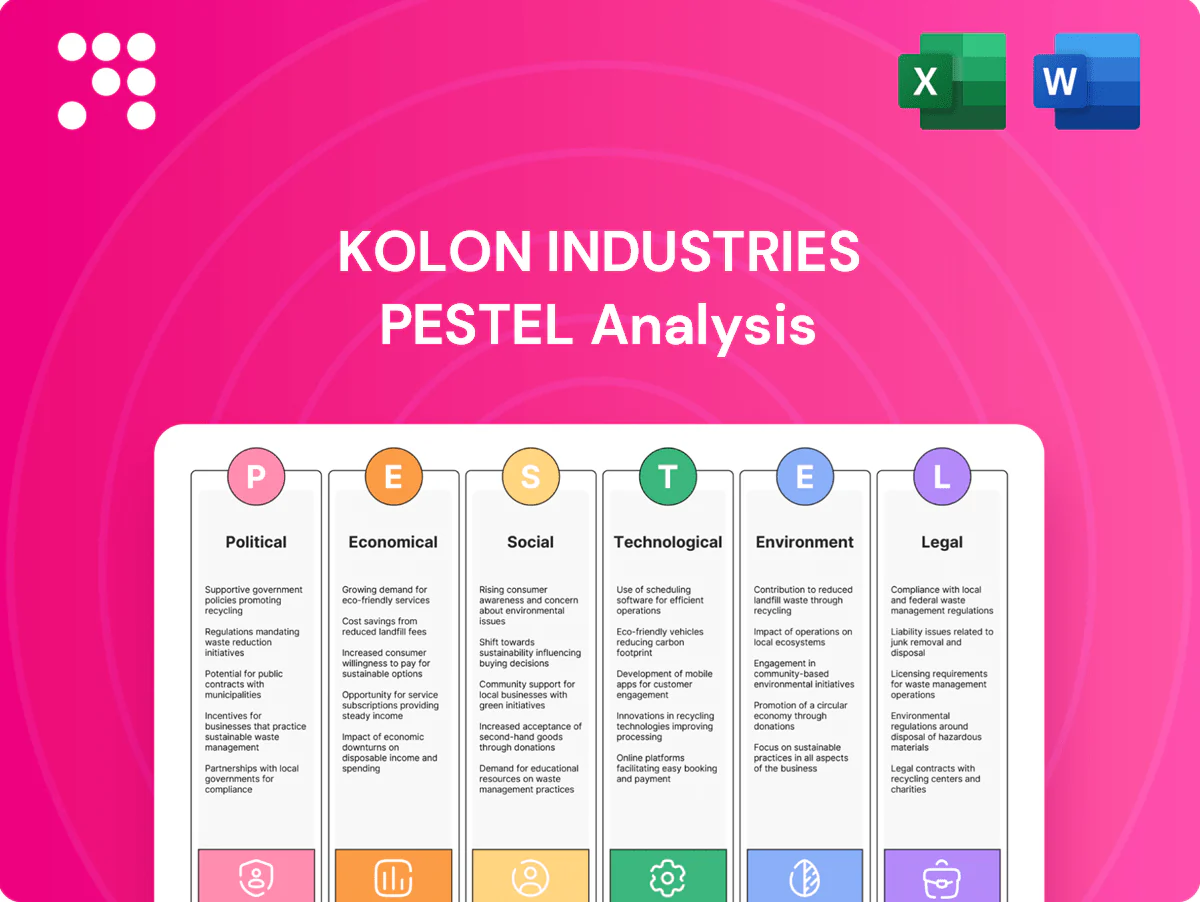
Kolon Industries PESTLE Analysis

Your Shortcut to Market Insight Starts Here
Discover how political shifts, economic cycles, social trends, technological advances, legal changes, and environmental pressures are reshaping Kolon Industries’ outlook in our concise PESTLE snapshot. Ideal for investors and strategists, this analysis highlights risks and growth levers you need to know. Buy the full PESTLE for a complete, editable breakdown and actionable insights ready for immediate use.
Political factors

Korea industrial policy
Seoul’s manufacturing and export-led policies steer incentives toward advanced materials, semiconductors and green industries, supporting firms in a country that is the world’s 10th-largest economy and whose memory firms account for roughly 70% of global market share. South Korea’s R&D intensity is about 4.6% of GDP, and targeted grants and tax credits materially lower Kolon’s R&D and capex burdens. Policy shifts can reallocate funding across chemicals, textiles and electronics, so active engagement helps Kolon align projects with strategic programs.
US–China tensions
Export controls on advanced materials and electronics components, expanded in 2023–24 to target semiconductors and related materials, can restrict customers or end-uses and force Kolon to map exposure across China- and US-linked value chains; China accounted for about 28% of global manufacturing value added in 2023. Compliance raises cost and lead time, reducing sanction risk but squeezing margins, so diversification of markets and regulatory approvals is essential.

Trade pacts and tariffs
RCEP (in force Jan 1, 2022) and the Korea–EU FTA (in force since 2011) materially cut tariff barriers for fibers, resins and electronic materials, with RCEP economies representing roughly 30% of global GDP. Preferential access can widen Kolon Industries margins versus non‑FTA rivals by lowering landed costs. Strict rules‑of‑origin compliance is required to claim tariff relief, and active monitoring of tariff schedules prevents unexpected duty costs.

Geopolitical security
Geopolitical tensions on the Korean Peninsula—South Korea spending about 2.6% of GDP on defense in 2024—increase insurance and investor risk premiums, pressuring Kolon Industries' cost of capital and working capital buffers. Disruptions to regional shipping (Red Sea/Strait of Malacca volatility) pushed some route insurance premiums up to 150% in 2024, raising freight and inventory-holding needs. Multi-site business continuity and clear redundancy/communication plans are essential to reassure customers and protect revenue.
- Insurance: higher premiums, +150% on some routes in 2024
- Logistics: elevated freight, larger inventory buffers
- Continuity: multi-site production & redundancy
- Customer confidence: transparent communication
Green industrial push
South Korea's 2050 carbon neutrality pledge and 2030 NDC targeting ~40% emissions cut, plus the 2020 Green New Deal (~73.4 trillion won), drive incentives for low‑carbon fibers and processes; public procurement is increasingly favoring eco‑friendly fibers and resins. Policy support for hydrogen, CCUS and recycling pilots is expanding via R&D and subsidy programs, letting early movers secure grants, permits and market advantage.
- Policy: 2050 neutrality, 2030 ≈40% cut
- Funding: Green New Deal ≈73.4 trillion won
- Procurement: preference for eco‑materials
- Opportunity: early movers win subsidies/permits
Grants ease capex; export controls force chain remaps; 4.6% R&D intensity
Seoul’s pro‑industrial grants and 4.6% GDP R&D intensity lower Kolon’s capex/R&D burden while export controls (expanded 2023–24) force value‑chain remaps; South Korea defense spend ≈2.6% GDP (2024) raises investor risk premiums and logistics costs. FTAs (RCEP, Korea‑EU) cut tariffs; 2050 neutrality and 73.4 trillion won Green New Deal boost demand for low‑carbon fibers.
| Metric | Value |
|---|---|
| R&D intensity (2023) | 4.6% GDP |
| Defense spend (2024) | 2.6% GDP |
| China Mfg share (2023) | 28% |
| Route insurance spike (2024) | +150% |
| Green New Deal | 73.4 trillion won |
What is included in the product
 Detailed Word Document
Explores how Political, Economic, Social, Technological, Environmental and Legal forces uniquely impact Kolon Industries, with data-driven subpoints and region‑specific trends; designed to help executives, investors and strategists identify risks, opportunities and forward‑looking scenarios for informed planning and funding decisions.

 Customizable Excel Spreadsheet
Concise, visually segmented PESTLE summary of Kolon Industries that can be dropped into presentations, edited with context-specific notes, and easily shared across teams to streamline external risk discussions and strategic planning.
Economic factors

Cyclical end-markets
Auto, tire, electronics and apparel demand for Kolon is cyclical and closely tied to global GDP, which slowed to about 3.0% in 2024 (IMF), while global light-vehicle sales were near 75 million units in 2024, pressuring tire-cord demand. Inventory swings in OEM and tire supply chains have amplified orders for tire cords, aramids and films during restocking phases. Fashion sales track consumer confidence and channel mix, with online share rising and boosting volatility. Kolon’s balanced portfolio across fibers, films and aramid products helps smooth revenue swings.
Input cost volatility
Petrochemical feedstocks and energy prices — with Brent crude averaging about $83/bbl in 2024 and Asian naphtha near $640/ton in 2024—directly compress resin and fiber margins at Kolon Industries.
Hedging and index-linked pricing mechanisms protect spreads but can lag spot moves, as seen in 2023–24 margin variability.
Energy-efficiency projects and supplier diversification (multiple Asian feedstock sources) have reduced spike exposure and secured continuity.

FX fluctuations
KRW fluctuations vs USD/EUR affect Kolon Industries’ export competitiveness and import costs; KRW depreciated roughly 5–8% vs USD in 2024–H1 2025, helping USD revenues but raising dollar/euro-priced feedstock costs. Natural hedges from foreign revenues and local costs reduce translation risk; financial hedges (forwards/options) cover residual exposure. Pricing discipline must reflect currency moves to protect margins.

Rates and capex
Higher interest rates (policy and market yields broadly in the 3.5–5% range in 2024–25) raise Kolon Industries’ borrowing costs for expansions and upgrades, forcing project IRRs to clear tighter hurdles and slowing large-scale capex. Management is likelier to phase investments or seek joint-venture financing to de-risk projects, while cash-flow prioritization shifts toward high-margin specialty segments.
- Higher borrowing costs: policy/market yields ~3.5–5%
- Project finance: IRR hurdles tightened, more phased investments
- Strategy: JV/partner financing and focus on high-margin specialties
Logistics and supply chain
Freight volatility and port congestion—spot container rates normalized to roughly $1,500–$2,000 per FEU by 2024 and average vessel delays of 2–4 days at major hubs—raise lead times and pressure service levels; dual-sourcing and nearshoring cut disruption risk and shorten variability. Inventory optimization balances resilience against ~20–30% annual carrying costs, while digital visibility can boost forecast accuracy by up to 20–25%.
- Freight rates: ~$1,500–$2,000/FEU (2024)
- Port delays: 2–4 days average
- Carrying cost: 20–30% pa
- Forecast accuracy gain: 20–25%
Grants ease capex; export controls force chain remaps; 4.6% R&D intensity
Kolon’s demand is cyclical—global GDP ~3.0% in 2024 and ~75m light vehicles in 2024 pressured tire-cord and specialty fibers. Brent ~$83/bbl and Asian naphtha ~$640/ton in 2024 squeezed resin/fiber margins despite hedges. KRW weakness ~5–8% (2024–H1 2025) aided USD revenues but raised feedstock costs; borrowing costs ~3.5–5% tightened capex IRRs. Freight ~$1,500–$2,000/FEU and 2–4 day delays increased supply risk.
| Metric | 2024–25 |
|---|---|
| Global GDP | ~3.0% |
| Light vehicles | ~75M units |
| Brent / Naphtha | $83/bbl / $640/ton |
| KRW vs USD | -5–8% |
| Policy/market yields | 3.5–5% |
| Freight / Port delay | $1,500–$2,000/FEU; 2–4 days |
Preview Before You Purchase
Kolon Industries PESTLE Analysis
Kolon Industries PESTLE Analysis offers a concise, actionable review of political, economic, social, technological, legal, and environmental factors shaping the company’s prospects. The preview shown here is the exact document you’ll receive after purchase—fully formatted and ready to use. Use it for strategic planning, risk assessment, or investment decisions with no edits required.

Original: $10.00
-65%$10.00
$3.50Product Information
Product Information
Shipping & Returns
Shipping & Returns
Description
Your Shortcut to Market Insight Starts Here
Discover how political shifts, economic cycles, social trends, technological advances, legal changes, and environmental pressures are reshaping Kolon Industries’ outlook in our concise PESTLE snapshot. Ideal for investors and strategists, this analysis highlights risks and growth levers you need to know. Buy the full PESTLE for a complete, editable breakdown and actionable insights ready for immediate use.
Political factors
Korea industrial policy
Seoul’s manufacturing and export-led policies steer incentives toward advanced materials, semiconductors and green industries, supporting firms in a country that is the world’s 10th-largest economy and whose memory firms account for roughly 70% of global market share. South Korea’s R&D intensity is about 4.6% of GDP, and targeted grants and tax credits materially lower Kolon’s R&D and capex burdens. Policy shifts can reallocate funding across chemicals, textiles and electronics, so active engagement helps Kolon align projects with strategic programs.
US–China tensions
Export controls on advanced materials and electronics components, expanded in 2023–24 to target semiconductors and related materials, can restrict customers or end-uses and force Kolon to map exposure across China- and US-linked value chains; China accounted for about 28% of global manufacturing value added in 2023. Compliance raises cost and lead time, reducing sanction risk but squeezing margins, so diversification of markets and regulatory approvals is essential.
Trade pacts and tariffs
RCEP (in force Jan 1, 2022) and the Korea–EU FTA (in force since 2011) materially cut tariff barriers for fibers, resins and electronic materials, with RCEP economies representing roughly 30% of global GDP. Preferential access can widen Kolon Industries margins versus non‑FTA rivals by lowering landed costs. Strict rules‑of‑origin compliance is required to claim tariff relief, and active monitoring of tariff schedules prevents unexpected duty costs.
Geopolitical security
Geopolitical tensions on the Korean Peninsula—South Korea spending about 2.6% of GDP on defense in 2024—increase insurance and investor risk premiums, pressuring Kolon Industries' cost of capital and working capital buffers. Disruptions to regional shipping (Red Sea/Strait of Malacca volatility) pushed some route insurance premiums up to 150% in 2024, raising freight and inventory-holding needs. Multi-site business continuity and clear redundancy/communication plans are essential to reassure customers and protect revenue.
- Insurance: higher premiums, +150% on some routes in 2024
- Logistics: elevated freight, larger inventory buffers
- Continuity: multi-site production & redundancy
- Customer confidence: transparent communication
Green industrial push
South Korea's 2050 carbon neutrality pledge and 2030 NDC targeting ~40% emissions cut, plus the 2020 Green New Deal (~73.4 trillion won), drive incentives for low‑carbon fibers and processes; public procurement is increasingly favoring eco‑friendly fibers and resins. Policy support for hydrogen, CCUS and recycling pilots is expanding via R&D and subsidy programs, letting early movers secure grants, permits and market advantage.
- Policy: 2050 neutrality, 2030 ≈40% cut
- Funding: Green New Deal ≈73.4 trillion won
- Procurement: preference for eco‑materials
- Opportunity: early movers win subsidies/permits
Grants ease capex; export controls force chain remaps; 4.6% R&D intensity
Seoul’s pro‑industrial grants and 4.6% GDP R&D intensity lower Kolon’s capex/R&D burden while export controls (expanded 2023–24) force value‑chain remaps; South Korea defense spend ≈2.6% GDP (2024) raises investor risk premiums and logistics costs. FTAs (RCEP, Korea‑EU) cut tariffs; 2050 neutrality and 73.4 trillion won Green New Deal boost demand for low‑carbon fibers.
| Metric | Value |
|---|---|
| R&D intensity (2023) | 4.6% GDP |
| Defense spend (2024) | 2.6% GDP |
| China Mfg share (2023) | 28% |
| Route insurance spike (2024) | +150% |
| Green New Deal | 73.4 trillion won |
What is included in the product
Detailed Word Document
Explores how Political, Economic, Social, Technological, Environmental and Legal forces uniquely impact Kolon Industries, with data-driven subpoints and region‑specific trends; designed to help executives, investors and strategists identify risks, opportunities and forward‑looking scenarios for informed planning and funding decisions.
Customizable Excel Spreadsheet
Concise, visually segmented PESTLE summary of Kolon Industries that can be dropped into presentations, edited with context-specific notes, and easily shared across teams to streamline external risk discussions and strategic planning.
Economic factors
Cyclical end-markets
Auto, tire, electronics and apparel demand for Kolon is cyclical and closely tied to global GDP, which slowed to about 3.0% in 2024 (IMF), while global light-vehicle sales were near 75 million units in 2024, pressuring tire-cord demand. Inventory swings in OEM and tire supply chains have amplified orders for tire cords, aramids and films during restocking phases. Fashion sales track consumer confidence and channel mix, with online share rising and boosting volatility. Kolon’s balanced portfolio across fibers, films and aramid products helps smooth revenue swings.
Input cost volatility
Petrochemical feedstocks and energy prices — with Brent crude averaging about $83/bbl in 2024 and Asian naphtha near $640/ton in 2024—directly compress resin and fiber margins at Kolon Industries.
Hedging and index-linked pricing mechanisms protect spreads but can lag spot moves, as seen in 2023–24 margin variability.
Energy-efficiency projects and supplier diversification (multiple Asian feedstock sources) have reduced spike exposure and secured continuity.
FX fluctuations
KRW fluctuations vs USD/EUR affect Kolon Industries’ export competitiveness and import costs; KRW depreciated roughly 5–8% vs USD in 2024–H1 2025, helping USD revenues but raising dollar/euro-priced feedstock costs. Natural hedges from foreign revenues and local costs reduce translation risk; financial hedges (forwards/options) cover residual exposure. Pricing discipline must reflect currency moves to protect margins.
Rates and capex
Higher interest rates (policy and market yields broadly in the 3.5–5% range in 2024–25) raise Kolon Industries’ borrowing costs for expansions and upgrades, forcing project IRRs to clear tighter hurdles and slowing large-scale capex. Management is likelier to phase investments or seek joint-venture financing to de-risk projects, while cash-flow prioritization shifts toward high-margin specialty segments.
- Higher borrowing costs: policy/market yields ~3.5–5%
- Project finance: IRR hurdles tightened, more phased investments
- Strategy: JV/partner financing and focus on high-margin specialties
Logistics and supply chain
Freight volatility and port congestion—spot container rates normalized to roughly $1,500–$2,000 per FEU by 2024 and average vessel delays of 2–4 days at major hubs—raise lead times and pressure service levels; dual-sourcing and nearshoring cut disruption risk and shorten variability. Inventory optimization balances resilience against ~20–30% annual carrying costs, while digital visibility can boost forecast accuracy by up to 20–25%.
- Freight rates: ~$1,500–$2,000/FEU (2024)
- Port delays: 2–4 days average
- Carrying cost: 20–30% pa
- Forecast accuracy gain: 20–25%
Grants ease capex; export controls force chain remaps; 4.6% R&D intensity
Kolon’s demand is cyclical—global GDP ~3.0% in 2024 and ~75m light vehicles in 2024 pressured tire-cord and specialty fibers. Brent ~$83/bbl and Asian naphtha ~$640/ton in 2024 squeezed resin/fiber margins despite hedges. KRW weakness ~5–8% (2024–H1 2025) aided USD revenues but raised feedstock costs; borrowing costs ~3.5–5% tightened capex IRRs. Freight ~$1,500–$2,000/FEU and 2–4 day delays increased supply risk.
| Metric | 2024–25 |
|---|---|
| Global GDP | ~3.0% |
| Light vehicles | ~75M units |
| Brent / Naphtha | $83/bbl / $640/ton |
| KRW vs USD | -5–8% |
| Policy/market yields | 3.5–5% |
| Freight / Port delay | $1,500–$2,000/FEU; 2–4 days |
Preview Before You Purchase
Kolon Industries PESTLE Analysis
Kolon Industries PESTLE Analysis offers a concise, actionable review of political, economic, social, technological, legal, and environmental factors shaping the company’s prospects. The preview shown here is the exact document you’ll receive after purchase—fully formatted and ready to use. Use it for strategic planning, risk assessment, or investment decisions with no edits required.











