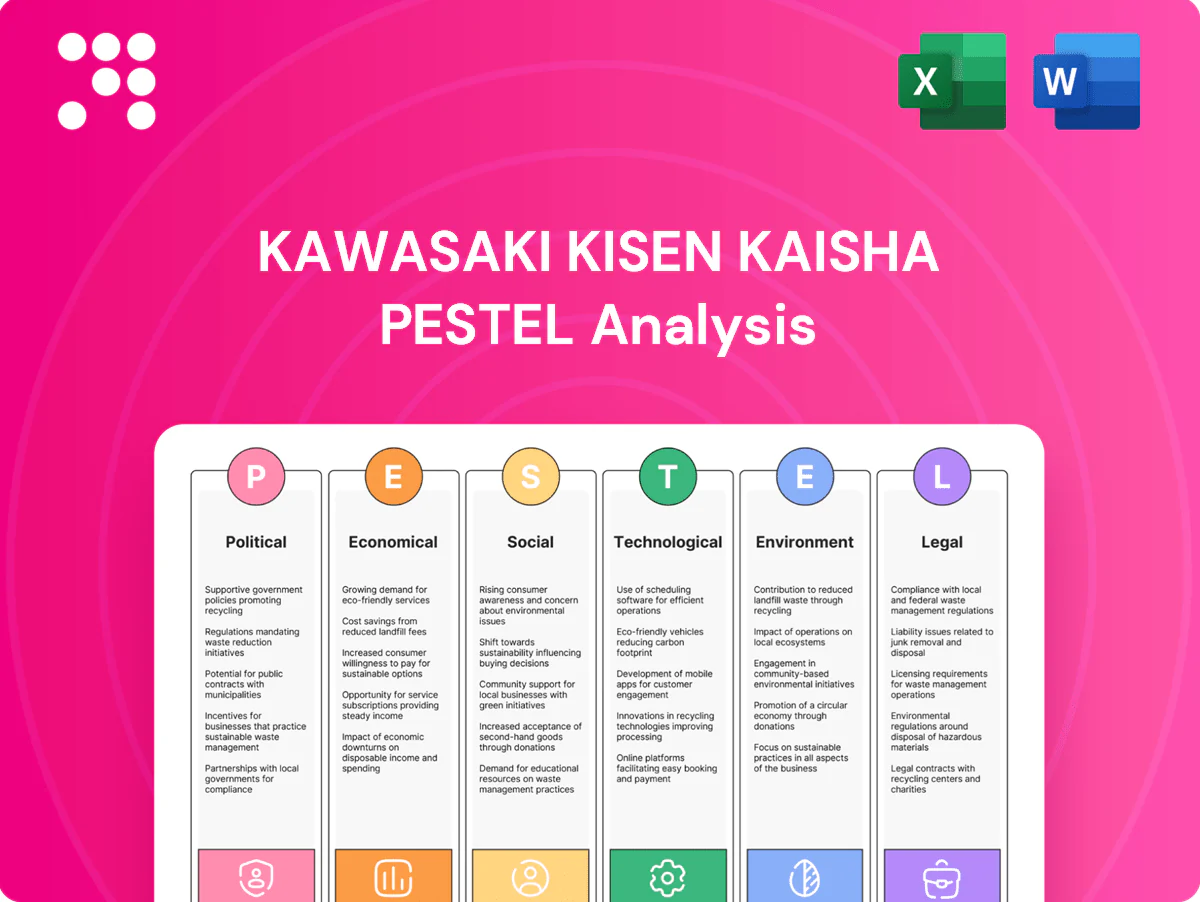
Kawasaki Kisen Kaisha PESTLE Analysis

Plan Smarter. Present Sharper. Compete Stronger.
Unlock strategic clarity with our PESTLE Analysis of Kawasaki Kisen Kaisha—spot how political, economic, social, technological, legal, and environmental forces will shape its shipping and logistics trajectory. Ideal for investors and strategists, this concise snapshot highlights risks and growth levers you can act on. Purchase the full report to access detailed, ready-to-use insights and forecasting tools.
Political factors

Geopolitical trade routes
Shifts in US–China relations, Middle East tensions, or sanctions can force reroutes that add voyage time and bunker costs and disrupt schedules. K LINE must diversify lanes and customers to mitigate chokepoint risks like the Strait of Hormuz, which handles about 20% of seaborne oil, or Red Sea transits. Political stability in port states directly affects terminal access and turnaround times. Active scenario planning and alliances preserve service reliability.
Japan maritime policy
Japan's maritime policy — driven by a net-zero 2050 target and the government Green Innovation Fund (≈2 trillion yen) — boosts shipping competitiveness and subsidizes fleet renewal, raising capex and financing needs for K Line. Public–private ammonia/hydrogen bunkering pilots receive targeted support, de-risking new-fuel adoption. Cabotage and strategic cargo rules expand domestic cargo share, while diplomatic backing secures port access and long‑term LNG supplies (Japan ~70 Mt LNG imports in 2023).

Global trade agreements
RCEP and CPTPP, covering about 30% of global GDP and lowering tariffs on most goods, are projected to lift intra-Asia trade—RCEP members saw goods trade rise ~5% YoY in 2023—boosting short-sea and feeder demand for containers, cars and bulks. WTO rulings and FTAs reshape tariff structures and volumes; rising protectionism and anti-dumping filings (WTO recorded ~1,300 in 2023) can depress specific commodity flows. K LINE must realign vessel deployment and chartering to treaty-driven demand shifts.

Port state politics
- Local governance impacts congestion & service
- Labor relations affect schedule integrity (strike risk)
- Political funding for digitization/dredging raises throughput
- Stakeholder relations help secure priority berthing
Security and piracy
Heightened piracy and conflict in the Red Sea and Gulf of Aden forced route deviations, escorts and war-risk premiums that spiked to over 100,000 USD/day for some container sailings in 2023–24, pressuring K LINE to maintain strict ISPS compliance and real-time risk monitoring. Naval coordination and BMP implementation remain critical to reduce boardings, while integrated cyber-physical security is increasingly essential to protect navigational and cargo systems.
- War-risk premiums: >100,000 USD/day (2023–24)
- ISPS: mandatory port/ship compliance
- BMP: naval liaison, armed escorts
- Cyber-physical: AIS, ECDIS hardening & OT segmentation
Hormuz ~20% oil, >$100k/day war premiums and Japan ¥2T green push reshape shipping
Geopolitical shocks (US–China, Middle East) force reroutes, rising bunker costs and schedule risk; Strait of Hormuz carries ~20% of seaborne oil. Japan policy (Green Innovation Fund ≈2 trillion yen) accelerates low‑carbon fuel adoption amid Japan LNG imports ~70 Mt (2023). Trade pacts (RCEP/CPTPP) lift intra‑Asia trade; port politics, strikes and war‑risk premiums (>100,000 USD/day 2023–24) affect throughput.
| Political Factor | Key Data |
|---|---|
| Chokepoints | Hormuz ~20% oil |
| Policy funding | Green Innovation Fund ≈¥2T |
| Security/ports | War premiums >$100k/day; Singapore 37.5M TEU (2023) |
What is included in the product
 Detailed Word Document
Explores how macro-environmental factors uniquely affect Kawasaki Kisen Kaisha (K Line) across Political, Economic, Social, Technological, Environmental and Legal dimensions, with data-backed trends, forward-looking insights and actionable implications to help executives, consultants and investors identify risks, opportunities and strategy-ready scenarios.

 Customizable Excel Spreadsheet
A concise, PESTLE-segmented summary of Kawasaki Kisen Kaisha's external factors that can be dropped into presentations, shared across teams, and used in planning sessions to streamline risk assessment and strategic alignment.
Economic factors

Global demand cycles
Container, auto, and dry bulk volumes move with global GDP and industrial output—world merchandise trade and container throughput (~800 million TEU) closely track GDP cycles (IMF world growth ~3.0% in 2024), so recessions compress rates and utilization while recoveries tighten capacity. K LINE’s diversified container, car-carrier and dry-bulk portfolio smooths earnings across cycles. Flexible spot and time-charter strategies help manage freight volatility and utilization swings.
Freight rate volatility
Freight rate volatility sees spot and contract rates across containers, car carriers, bulks and tankers swing with capacity shifts and fuel: container indices dropped roughly 60% from 2022 peaks while bunker (VLSFO) costs rose ~15% in H1 2025, pressuring margins. Revenue management and index-linked contracts have stabilized cash flows for carriers. Strategic alliances and slot charters boost load factors and network density. Active hedging and bunker adjustment factors (BAF) protect margins.

Currency and interest rates
JPY volatility versus the USD — around 155 JPY/USD in mid‑2025 — directly alters Kawasaki Kisen Kaisha reported yen earnings and raises yen cost of servicing USD debt. Higher global rates (US 10‑yr ~4–4.5% in 2024–25) elevate financing costs for newbuilds and retrofits, squeezing capex economics. Significant USD‑denominated freight revenues provide natural hedges that offset part of FX exposure. Prudent liability duration and a mix of yen/USD debt reduce balance‑sheet refinancing risk.

Commodity trade patterns
Iron ore seaborne trade (~1.6 billion t), coal (~1.2 billion t), crude oil (~3.4 billion t) and growing LNG volumes (~400 Mtpa) drive K Line’s bulk and energy segments; these flows underpin global ton-miles and revenue pools. Energy transition is reducing coal volumes while LNG and minor bulks gain share, reshaping ton-mile demand. Long-term contracts with majors provide revenue stability, so fleet mix must adapt to evolving cargo baskets.
- Iron ore: ~1.6bn t
- Coal: ~1.2bn t
- Crude: ~3.4bn t
- LNG: ~400 Mtpa
- Implication: fleet mix must shift to LNG/minor bulks; long-term contracts = stability
Supply chain reconfiguration
Supply chain reconfiguration—driven by nearshoring and China+1—is diversifying origin‑destination pairs and lifting intra‑Asia and short‑sea volumes, heightening peak seasonality and equipment repositioning needs. Just‑in‑case inventory strategies lengthen lead times and raise demand for terminal throughput. K LINE's terminals and logistics can capture end‑to‑end margins; K Line reported consolidated revenue of ¥1,075.6 billion in FY2023.
- Nearshoring: diversifies lanes
- Intra‑Asia: boosts short‑sea demand
- Inventory: raises peak seasonality
- K LINE: terminals/logistics = capture value
Hormuz ~20% oil, >$100k/day war premiums and Japan ¥2T green push reshape shipping
Global trade/cargo cycles (container throughput ~800M TEU; IMF world growth ~3.0% 2024) drive K LINE volumes; diversified containers/car‑carrier/dry‑bulk mix smooths earnings. Freight rate and bunker volatility (VLSFO +~15% H1 2025) compress margins; hedging, BAFs and alliances mitigate risk. FX (≈155 JPY/USD mid‑2025) and higher rates raise financing costs; USD revenues and balanced debt profile reduce net exposure.
| Metric | Value |
|---|---|
| Container throughput | ~800M TEU |
| World growth | ~3.0% (2024) |
| VLSFO change | +~15% H1 2025 |
| JPY/USD | ~155 (mid‑2025) |
| K LINE revenue | ¥1,075.6bn (FY2023) |
| Key seaborne trades | Iron ore 1.6bn t; Coal 1.2bn t; Crude 3.4bn t; LNG ~400 Mtpa |
Full Version Awaits
Kawasaki Kisen Kaisha PESTLE Analysis
The preview shown here is the exact Kawasaki Kisen Kaisha PESTLE Analysis you’ll receive after purchase—fully formatted, professionally structured, and ready to use. This file contains the complete political, economic, social, technological, legal, and environmental assessment with no placeholders. After checkout you’ll instantly download this same document, exactly as displayed.

Original: $10.00
-65%$10.00
$3.50Product Information
Product Information
Shipping & Returns
Shipping & Returns
Description
Plan Smarter. Present Sharper. Compete Stronger.
Unlock strategic clarity with our PESTLE Analysis of Kawasaki Kisen Kaisha—spot how political, economic, social, technological, legal, and environmental forces will shape its shipping and logistics trajectory. Ideal for investors and strategists, this concise snapshot highlights risks and growth levers you can act on. Purchase the full report to access detailed, ready-to-use insights and forecasting tools.
Political factors
Geopolitical trade routes
Shifts in US–China relations, Middle East tensions, or sanctions can force reroutes that add voyage time and bunker costs and disrupt schedules. K LINE must diversify lanes and customers to mitigate chokepoint risks like the Strait of Hormuz, which handles about 20% of seaborne oil, or Red Sea transits. Political stability in port states directly affects terminal access and turnaround times. Active scenario planning and alliances preserve service reliability.
Japan maritime policy
Japan's maritime policy — driven by a net-zero 2050 target and the government Green Innovation Fund (≈2 trillion yen) — boosts shipping competitiveness and subsidizes fleet renewal, raising capex and financing needs for K Line. Public–private ammonia/hydrogen bunkering pilots receive targeted support, de-risking new-fuel adoption. Cabotage and strategic cargo rules expand domestic cargo share, while diplomatic backing secures port access and long‑term LNG supplies (Japan ~70 Mt LNG imports in 2023).
Global trade agreements
RCEP and CPTPP, covering about 30% of global GDP and lowering tariffs on most goods, are projected to lift intra-Asia trade—RCEP members saw goods trade rise ~5% YoY in 2023—boosting short-sea and feeder demand for containers, cars and bulks. WTO rulings and FTAs reshape tariff structures and volumes; rising protectionism and anti-dumping filings (WTO recorded ~1,300 in 2023) can depress specific commodity flows. K LINE must realign vessel deployment and chartering to treaty-driven demand shifts.
Port state politics
- Local governance impacts congestion & service
- Labor relations affect schedule integrity (strike risk)
- Political funding for digitization/dredging raises throughput
- Stakeholder relations help secure priority berthing
Security and piracy
Heightened piracy and conflict in the Red Sea and Gulf of Aden forced route deviations, escorts and war-risk premiums that spiked to over 100,000 USD/day for some container sailings in 2023–24, pressuring K LINE to maintain strict ISPS compliance and real-time risk monitoring. Naval coordination and BMP implementation remain critical to reduce boardings, while integrated cyber-physical security is increasingly essential to protect navigational and cargo systems.
- War-risk premiums: >100,000 USD/day (2023–24)
- ISPS: mandatory port/ship compliance
- BMP: naval liaison, armed escorts
- Cyber-physical: AIS, ECDIS hardening & OT segmentation
Hormuz ~20% oil, >$100k/day war premiums and Japan ¥2T green push reshape shipping
Geopolitical shocks (US–China, Middle East) force reroutes, rising bunker costs and schedule risk; Strait of Hormuz carries ~20% of seaborne oil. Japan policy (Green Innovation Fund ≈2 trillion yen) accelerates low‑carbon fuel adoption amid Japan LNG imports ~70 Mt (2023). Trade pacts (RCEP/CPTPP) lift intra‑Asia trade; port politics, strikes and war‑risk premiums (>100,000 USD/day 2023–24) affect throughput.
| Political Factor | Key Data |
|---|---|
| Chokepoints | Hormuz ~20% oil |
| Policy funding | Green Innovation Fund ≈¥2T |
| Security/ports | War premiums >$100k/day; Singapore 37.5M TEU (2023) |
What is included in the product
Detailed Word Document
Explores how macro-environmental factors uniquely affect Kawasaki Kisen Kaisha (K Line) across Political, Economic, Social, Technological, Environmental and Legal dimensions, with data-backed trends, forward-looking insights and actionable implications to help executives, consultants and investors identify risks, opportunities and strategy-ready scenarios.
Customizable Excel Spreadsheet
A concise, PESTLE-segmented summary of Kawasaki Kisen Kaisha's external factors that can be dropped into presentations, shared across teams, and used in planning sessions to streamline risk assessment and strategic alignment.
Economic factors
Global demand cycles
Container, auto, and dry bulk volumes move with global GDP and industrial output—world merchandise trade and container throughput (~800 million TEU) closely track GDP cycles (IMF world growth ~3.0% in 2024), so recessions compress rates and utilization while recoveries tighten capacity. K LINE’s diversified container, car-carrier and dry-bulk portfolio smooths earnings across cycles. Flexible spot and time-charter strategies help manage freight volatility and utilization swings.
Freight rate volatility
Freight rate volatility sees spot and contract rates across containers, car carriers, bulks and tankers swing with capacity shifts and fuel: container indices dropped roughly 60% from 2022 peaks while bunker (VLSFO) costs rose ~15% in H1 2025, pressuring margins. Revenue management and index-linked contracts have stabilized cash flows for carriers. Strategic alliances and slot charters boost load factors and network density. Active hedging and bunker adjustment factors (BAF) protect margins.
Currency and interest rates
JPY volatility versus the USD — around 155 JPY/USD in mid‑2025 — directly alters Kawasaki Kisen Kaisha reported yen earnings and raises yen cost of servicing USD debt. Higher global rates (US 10‑yr ~4–4.5% in 2024–25) elevate financing costs for newbuilds and retrofits, squeezing capex economics. Significant USD‑denominated freight revenues provide natural hedges that offset part of FX exposure. Prudent liability duration and a mix of yen/USD debt reduce balance‑sheet refinancing risk.
Commodity trade patterns
Iron ore seaborne trade (~1.6 billion t), coal (~1.2 billion t), crude oil (~3.4 billion t) and growing LNG volumes (~400 Mtpa) drive K Line’s bulk and energy segments; these flows underpin global ton-miles and revenue pools. Energy transition is reducing coal volumes while LNG and minor bulks gain share, reshaping ton-mile demand. Long-term contracts with majors provide revenue stability, so fleet mix must adapt to evolving cargo baskets.
- Iron ore: ~1.6bn t
- Coal: ~1.2bn t
- Crude: ~3.4bn t
- LNG: ~400 Mtpa
- Implication: fleet mix must shift to LNG/minor bulks; long-term contracts = stability
Supply chain reconfiguration
Supply chain reconfiguration—driven by nearshoring and China+1—is diversifying origin‑destination pairs and lifting intra‑Asia and short‑sea volumes, heightening peak seasonality and equipment repositioning needs. Just‑in‑case inventory strategies lengthen lead times and raise demand for terminal throughput. K LINE's terminals and logistics can capture end‑to‑end margins; K Line reported consolidated revenue of ¥1,075.6 billion in FY2023.
- Nearshoring: diversifies lanes
- Intra‑Asia: boosts short‑sea demand
- Inventory: raises peak seasonality
- K LINE: terminals/logistics = capture value
Hormuz ~20% oil, >$100k/day war premiums and Japan ¥2T green push reshape shipping
Global trade/cargo cycles (container throughput ~800M TEU; IMF world growth ~3.0% 2024) drive K LINE volumes; diversified containers/car‑carrier/dry‑bulk mix smooths earnings. Freight rate and bunker volatility (VLSFO +~15% H1 2025) compress margins; hedging, BAFs and alliances mitigate risk. FX (≈155 JPY/USD mid‑2025) and higher rates raise financing costs; USD revenues and balanced debt profile reduce net exposure.
| Metric | Value |
|---|---|
| Container throughput | ~800M TEU |
| World growth | ~3.0% (2024) |
| VLSFO change | +~15% H1 2025 |
| JPY/USD | ~155 (mid‑2025) |
| K LINE revenue | ¥1,075.6bn (FY2023) |
| Key seaborne trades | Iron ore 1.6bn t; Coal 1.2bn t; Crude 3.4bn t; LNG ~400 Mtpa |
Full Version Awaits
Kawasaki Kisen Kaisha PESTLE Analysis
The preview shown here is the exact Kawasaki Kisen Kaisha PESTLE Analysis you’ll receive after purchase—fully formatted, professionally structured, and ready to use. This file contains the complete political, economic, social, technological, legal, and environmental assessment with no placeholders. After checkout you’ll instantly download this same document, exactly as displayed.











