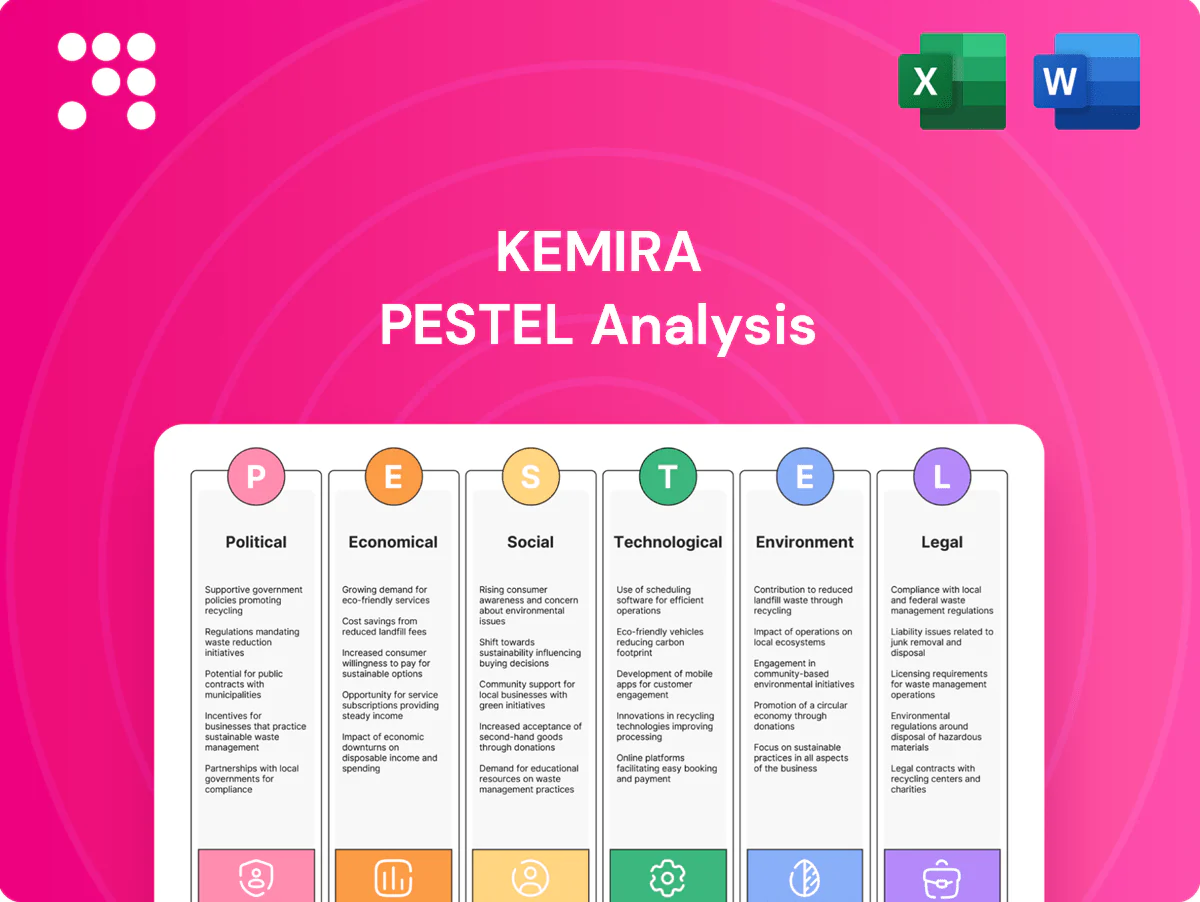
Kemira PESTLE Analysis

Make Smarter Strategic Decisions with a Complete PESTEL View
Gain a strategic advantage with our Kemira PESTLE Analysis—concise, up-to-date insights on political, economic, social, technological, legal, and environmental drivers shaping the company’s future. Ideal for investors and strategists—purchase the full report to access actionable recommendations and ready-to-use data now.
Political factors

EU chemicals policy and REACH
Stricter EU chemicals strategies and REACH updates increase testing, registration and substitution costs, notably as REACH covers over 22,000 registered substances and the PFAS group exceeds 4,700 substances. Kemira must proactively manage substance portfolios and accelerate safer alternatives to control compliance spend. Early compliance can become a tender differentiator; non-compliance risks market access restrictions and regulatory penalties.
Trade policy, tariffs, and logistics
Shifts in tariffs on chemical inputs and outputs directly squeeze margins and force price adjustments for Kemira, especially where raw materials cross borders; sensitivity rises when geopolitical tariffs target key feedstocks. Port congestion and chokepoints like the Suez Canal (roughly 12% of seaborne trade) can delay deliveries to pulp, paper and water utilities, raising inventory and logistics costs. Diversified sourcing and regional production footprints reduce exposure, while contracts increasingly require freight and tariff pass-through clauses to protect margins.

Energy security and geopolitical tensions
European TTF gas volatility (peak ~345 €/MWh in Aug 2022, easing to ~40 €/MWh in 2024) disrupts Kemira’s energy‑intensive chemical operations and margins. Geopolitical conflicts and sanctions cut Russian pipeline supplies by over 80% to the EU, altering feedstock flows and oil & gas customer spending. Active hedging and €m‑scale energy‑efficiency investments have stabilized cost bases; scenario planning aligns capacity with shifting demand.

Public procurement priorities
Water utilities' procurement is driven by government budgets and policy goals; EU public procurement equals roughly 14% of GDP (~€2 trillion/year), shaping demand for Kemira's water-chemicals. Preference for local, sustainable suppliers and demonstrated life-cycle benefits and regulatory compliance improve tender success, while political shifts can quickly accelerate or delay infrastructure spend.
- Public procurement ~14% GDP (EU)
- Local/sustainable preference affects awards
- Life-cycle benefits and compliance boost tender success
- Political shifts change infrastructure capex timing
Industrial policy and subsidies
Industrial policy and subsidies accelerate Kemira's decarbonization and circular-chemistry projects by subsidizing hydrogen trials and process upgrades; the EU estimates an additional €520 billion/yr investment is needed to meet Green Deal goals, opening large grant pools. Accessing grants and tax credits can cut capex for upgrades materially, but eligibility usually demands strict sustainability KPIs and detailed reporting. Co-funded pilots at customer sites strengthen competitive positioning and reduce commercial risk.
Regulation, supply and energy shocks squeeze margins; EU procurement ~14%
Regulatory tightening (REACH 22,000+ substances; PFAS ~4,700) raises compliance and substitution costs, impacting product portfolios and market access. Tariff shifts and chokepoints (Suez ~12% seaborne trade) squeeze margins; diversified sourcing mitigates risk. Energy volatility (TTF peak ~345 €/MWh Aug 2022; ~40 €/MWh in 2024) and public procurement (EU ~14% GDP ≈ €2T/yr) drive tender dynamics and capex timing.
| Metric | Value |
|---|---|
| REACH substances | 22,000+ |
| PFAS group | ~4,700 |
| EU public procurement | ~14% GDP (~€2T/yr) |
| EU Green Deal gap | €520B/yr |
| TTF gas | 345 €/MWh peak (Aug 2022); ~40 €/MWh (2024) |
What is included in the product
 Detailed Word Document
Explores how macro-environmental factors uniquely affect Kemira across Political, Economic, Social, Technological, Environmental, and Legal dimensions, with data-driven trends and industry-specific examples to identify threats and opportunities for executives and investors.

 Customizable Excel Spreadsheet
A clean, summarized Kemira PESTLE that’s visually segmented by category for quick interpretation, easily dropped into PowerPoints or shared across teams to align strategy. Allows users to add notes for regional or business-line context, supporting faster decisions on external risks and market positioning.
Economic factors

End-market cyclicality
Pulp and paper demand cycles materially swing Kemira’s chemical volumes and pricing power, with the group recording approximately EUR 2.2bn in sales (FY2023) as end-market mix drives quarterly swings. Municipal water revenues are steadier but budget-constrained, smoothing revenue streams and supporting margins. Oil and gas chemicals track drilling activity—US rig counts and completions movements drive short-term volumes. A balanced portfolio reduces earnings volatility across cycles.
Raw material and energy costs
Kemira's 2024 reporting highlights that caustic soda, sulfur derivatives and acrylic monomers are the main drivers of COGS, materially affecting margins. Power and steam tariffs remain key site-economics variables, especially in energy-intensive operations. Index-linked contracts and formula pricing in 2024 helped protect margins, while backward integration and supplier partnerships strengthened cost resilience.

Currency fluctuations
Kemira reports in EUR and USD volatility and emerging-market FX swings materially affect reported revenues and input costs; FY2024 sales were about €2.1bn, so a 5-10% FX move alters reported top line by c.€100–200m. Natural hedges arise when sourcing and sales align regionally, while financial hedging smooths earnings but adds accounting and operational complexity. Rigorous pricing discipline is required to protect margins in volatile FX environments.

Customer consolidation
Customer consolidation in pulp, paper and water drove buying power in 2024, with the largest groups accounting for roughly 60% of global capacity, pressuring suppliers like Kemira on price and terms. Long-term framework agreements (commonly 3–5 years) lock in volumes but squeeze margins. Differentiation through performance guarantees and targeted cross-selling protects value and expands wallet share per account.
- 60%: top groups share of capacity (2024)
- 3–5 years: typical framework length
- Performance guarantees: defend pricing
- Cross-selling: increases wallet share
Capital intensity and ROI
C hemical plants require sustained capex for safety, compliance and efficiency; Kemira invested EUR 92m in 2023 capex, underscoring ongoing spend needs to meet EU REACH and safety upgrades. Payback improves via energy savings, yield gains and premium formulations, lifting margins and shortening typical payback toward 3–5 years for retrofits. Disciplined project selection preserves ROCE through cycles while optimizing asset footprint lowers fixed-cost burden and improves utilization.
- Capex 2023: EUR 92m (Kemira)
- Retrofit payback: ~3–5 years
- ROCE protection: disciplined project gating
- Footprint optimization: reduces fixed costs, raises utilization
Regulation, supply and energy shocks squeeze margins; EU procurement ~14%
Kemira's cyclic pulp & paper exposure drives quarterly swings; FY2024 sales ~€2.1bn with municipal water smoothing earnings. Key COGS: caustic, sulfur, acrylics; energy tariffs and FX (5–10% moves ≈€100–200m top‑line impact) materially affect margins. 2023 capex €92m; retrofit payback 3–5 years; top customers ~60% capacity share.
| Metric | Value |
|---|---|
| FY2024 sales | €2.1bn |
| Capex 2023 | €92m |
| Top customers share | 60% |
| FX sensitivity | 5–10% ≈€100–200m |
Same Document Delivered
Kemira PESTLE Analysis
The preview shown here is the exact Kemira PESTLE Analysis document you’ll receive after purchase—fully formatted and ready to use. The layout, content, and structure visible here are exactly what you’ll be able to download immediately after buying, with no placeholders or teasers. This is the real, finished file—professional and ready for immediate application.

Original: $10.00
-65%$10.00
$3.50Product Information
Product Information
Shipping & Returns
Shipping & Returns
Description
Make Smarter Strategic Decisions with a Complete PESTEL View
Gain a strategic advantage with our Kemira PESTLE Analysis—concise, up-to-date insights on political, economic, social, technological, legal, and environmental drivers shaping the company’s future. Ideal for investors and strategists—purchase the full report to access actionable recommendations and ready-to-use data now.
Political factors
EU chemicals policy and REACH
Stricter EU chemicals strategies and REACH updates increase testing, registration and substitution costs, notably as REACH covers over 22,000 registered substances and the PFAS group exceeds 4,700 substances. Kemira must proactively manage substance portfolios and accelerate safer alternatives to control compliance spend. Early compliance can become a tender differentiator; non-compliance risks market access restrictions and regulatory penalties.
Trade policy, tariffs, and logistics
Shifts in tariffs on chemical inputs and outputs directly squeeze margins and force price adjustments for Kemira, especially where raw materials cross borders; sensitivity rises when geopolitical tariffs target key feedstocks. Port congestion and chokepoints like the Suez Canal (roughly 12% of seaborne trade) can delay deliveries to pulp, paper and water utilities, raising inventory and logistics costs. Diversified sourcing and regional production footprints reduce exposure, while contracts increasingly require freight and tariff pass-through clauses to protect margins.
Energy security and geopolitical tensions
European TTF gas volatility (peak ~345 €/MWh in Aug 2022, easing to ~40 €/MWh in 2024) disrupts Kemira’s energy‑intensive chemical operations and margins. Geopolitical conflicts and sanctions cut Russian pipeline supplies by over 80% to the EU, altering feedstock flows and oil & gas customer spending. Active hedging and €m‑scale energy‑efficiency investments have stabilized cost bases; scenario planning aligns capacity with shifting demand.
Public procurement priorities
Water utilities' procurement is driven by government budgets and policy goals; EU public procurement equals roughly 14% of GDP (~€2 trillion/year), shaping demand for Kemira's water-chemicals. Preference for local, sustainable suppliers and demonstrated life-cycle benefits and regulatory compliance improve tender success, while political shifts can quickly accelerate or delay infrastructure spend.
- Public procurement ~14% GDP (EU)
- Local/sustainable preference affects awards
- Life-cycle benefits and compliance boost tender success
- Political shifts change infrastructure capex timing
Industrial policy and subsidies
Industrial policy and subsidies accelerate Kemira's decarbonization and circular-chemistry projects by subsidizing hydrogen trials and process upgrades; the EU estimates an additional €520 billion/yr investment is needed to meet Green Deal goals, opening large grant pools. Accessing grants and tax credits can cut capex for upgrades materially, but eligibility usually demands strict sustainability KPIs and detailed reporting. Co-funded pilots at customer sites strengthen competitive positioning and reduce commercial risk.
Regulation, supply and energy shocks squeeze margins; EU procurement ~14%
Regulatory tightening (REACH 22,000+ substances; PFAS ~4,700) raises compliance and substitution costs, impacting product portfolios and market access. Tariff shifts and chokepoints (Suez ~12% seaborne trade) squeeze margins; diversified sourcing mitigates risk. Energy volatility (TTF peak ~345 €/MWh Aug 2022; ~40 €/MWh in 2024) and public procurement (EU ~14% GDP ≈ €2T/yr) drive tender dynamics and capex timing.
| Metric | Value |
|---|---|
| REACH substances | 22,000+ |
| PFAS group | ~4,700 |
| EU public procurement | ~14% GDP (~€2T/yr) |
| EU Green Deal gap | €520B/yr |
| TTF gas | 345 €/MWh peak (Aug 2022); ~40 €/MWh (2024) |
What is included in the product
Detailed Word Document
Explores how macro-environmental factors uniquely affect Kemira across Political, Economic, Social, Technological, Environmental, and Legal dimensions, with data-driven trends and industry-specific examples to identify threats and opportunities for executives and investors.
Customizable Excel Spreadsheet
A clean, summarized Kemira PESTLE that’s visually segmented by category for quick interpretation, easily dropped into PowerPoints or shared across teams to align strategy. Allows users to add notes for regional or business-line context, supporting faster decisions on external risks and market positioning.
Economic factors
End-market cyclicality
Pulp and paper demand cycles materially swing Kemira’s chemical volumes and pricing power, with the group recording approximately EUR 2.2bn in sales (FY2023) as end-market mix drives quarterly swings. Municipal water revenues are steadier but budget-constrained, smoothing revenue streams and supporting margins. Oil and gas chemicals track drilling activity—US rig counts and completions movements drive short-term volumes. A balanced portfolio reduces earnings volatility across cycles.
Raw material and energy costs
Kemira's 2024 reporting highlights that caustic soda, sulfur derivatives and acrylic monomers are the main drivers of COGS, materially affecting margins. Power and steam tariffs remain key site-economics variables, especially in energy-intensive operations. Index-linked contracts and formula pricing in 2024 helped protect margins, while backward integration and supplier partnerships strengthened cost resilience.
Currency fluctuations
Kemira reports in EUR and USD volatility and emerging-market FX swings materially affect reported revenues and input costs; FY2024 sales were about €2.1bn, so a 5-10% FX move alters reported top line by c.€100–200m. Natural hedges arise when sourcing and sales align regionally, while financial hedging smooths earnings but adds accounting and operational complexity. Rigorous pricing discipline is required to protect margins in volatile FX environments.
Customer consolidation
Customer consolidation in pulp, paper and water drove buying power in 2024, with the largest groups accounting for roughly 60% of global capacity, pressuring suppliers like Kemira on price and terms. Long-term framework agreements (commonly 3–5 years) lock in volumes but squeeze margins. Differentiation through performance guarantees and targeted cross-selling protects value and expands wallet share per account.
- 60%: top groups share of capacity (2024)
- 3–5 years: typical framework length
- Performance guarantees: defend pricing
- Cross-selling: increases wallet share
Capital intensity and ROI
C hemical plants require sustained capex for safety, compliance and efficiency; Kemira invested EUR 92m in 2023 capex, underscoring ongoing spend needs to meet EU REACH and safety upgrades. Payback improves via energy savings, yield gains and premium formulations, lifting margins and shortening typical payback toward 3–5 years for retrofits. Disciplined project selection preserves ROCE through cycles while optimizing asset footprint lowers fixed-cost burden and improves utilization.
- Capex 2023: EUR 92m (Kemira)
- Retrofit payback: ~3–5 years
- ROCE protection: disciplined project gating
- Footprint optimization: reduces fixed costs, raises utilization
Regulation, supply and energy shocks squeeze margins; EU procurement ~14%
Kemira's cyclic pulp & paper exposure drives quarterly swings; FY2024 sales ~€2.1bn with municipal water smoothing earnings. Key COGS: caustic, sulfur, acrylics; energy tariffs and FX (5–10% moves ≈€100–200m top‑line impact) materially affect margins. 2023 capex €92m; retrofit payback 3–5 years; top customers ~60% capacity share.
| Metric | Value |
|---|---|
| FY2024 sales | €2.1bn |
| Capex 2023 | €92m |
| Top customers share | 60% |
| FX sensitivity | 5–10% ≈€100–200m |
Same Document Delivered
Kemira PESTLE Analysis
The preview shown here is the exact Kemira PESTLE Analysis document you’ll receive after purchase—fully formatted and ready to use. The layout, content, and structure visible here are exactly what you’ll be able to download immediately after buying, with no placeholders or teasers. This is the real, finished file—professional and ready for immediate application.











