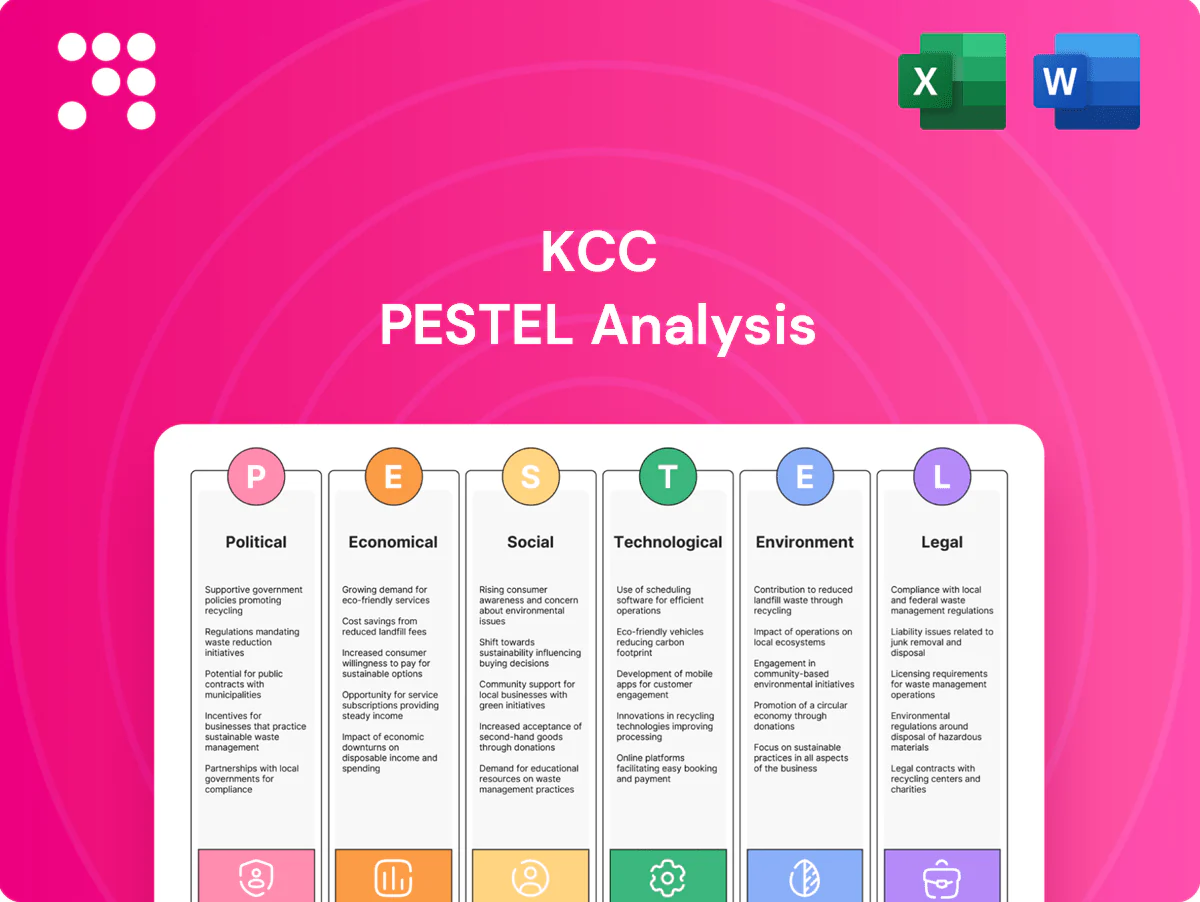
KCC PESTLE Analysis

Make Smarter Strategic Decisions with a Complete PESTEL View
Explore how political shifts, economic trends, social dynamics, and regulatory pressures are reshaping KCC's strategic outlook in our concise PESTLE snapshot—designed to spark immediate strategic action. Whether you’re an investor or strategist, the full PESTLE delivers the deeper insights and data you need to assess risk and seize opportunity. Purchase the complete analysis now for a ready-to-use, downloadable briefing.
Political factors

Trade policy and tariffs
Shifts in US–China–Korea trade ties can quickly change input costs and market access for coatings and chemicals, highlighted by US tariffs on roughly 250 billion dollars of Chinese goods reaching up to 25% since 2018. Tariffs on petrochemical feedstocks or finished paints can compress margins, so KCC must diversify sourcing and use FTAs like KORUS and RCEP to reduce tariff exposure. Active trade compliance and origin planning are essential to preserve cost structure and market access.
Geopolitical tensions
Regional security issues on the Korean Peninsula can disrupt logistics and investor confidence, with South Korea raising defense spending to about 2.8% of GDP in 2024 signaling heightened risk. Heightened tensions increase insurance, hedging and inventory carrying costs for manufacturers. Business continuity plans and multi-country production reduce exposure, while transparent stakeholder communication sustains trust.

Industrial policy incentives
Government backing for advanced materials, EVs and semiconductors fuels demand for specialty coatings; US CHIPS Act allocates about 52 billion dollars for semiconductor incentives and the Inflation Reduction Act includes roughly 369 billion dollars for clean energy, boosting market pull for suppliers like KCC. Subsidies and tax credits such as the US EV tax credit up to 7,500 dollars can lower capex for green upgrades and R&D. KCC can align with national projects and public‑private bids to capture funded contracts, and active monitoring of grant criteria raises win rates.

Public procurement standards
Public procurement increasingly embeds green and safety criteria—favoring low‑VOC paints and certified insulation—boosting eligibility for firms meeting standards; government contracts represent about 12% of GDP across OECD countries, making compliance commercially material. KCC can use eco‑labels and performance certifications to differentiate and frame bids around lifecycle cost savings to strengthen value cases.
- eco-label: leverage recognized certifications
- low-VOC: meet tender thresholds
- lifecycle: quantify total cost savings
- market impact: access public spend ≈12% GDP
Sanctions and export controls
Tighter export controls since 2022 on dual-use chemicals and high-performance materials have constrained sales into sensitive markets, with US, EU and UK regimes expanding scope through 2024–25. Compliance gaps risk license denials, fines and shipment delays; enforcement actions have risen as authorities prioritize strategic industries. KCC must implement robust screening and documentation and map its product portfolio to control lists to reduce disruptions.
- controls: US/EU/UK expansions 2022–25
- risks: license denials, fines, delays
- actions: screening, documentation
- mitigation: product mapping to control lists
Tariffs, subsidies, export controls squeeze margins; US tariffs up to 25%
Trade tensions, tariffs (US tariffs up to 25% on ~250 billion dollars of Chinese goods) and FTAs (KORUS, RCEP) directly affect KCC input costs and margins. Korea’s defense spend ~2.8% of GDP in 2024 raises security and logistics risk. Subsidies (CHIPS ~52 billion dollars, IRA ~369 billion dollars) and public procurement (~12% of GDP) drive demand for certified green coatings. Export controls expanded 2022–25, raising compliance costs.
| Factor | Key number |
|---|---|
| US tariffs | ~25% on $250bn |
| KR defense spend | 2.8% GDP (2024) |
| CHIPS / IRA | $52bn / $369bn |
| Public procurement | ~12% GDP |
What is included in the product
 Detailed Word Document
Explores how macro-environmental factors uniquely affect KCC across Political, Economic, Social, Technological, Environmental and Legal dimensions, with data-backed trends, region- and industry-specific examples, forward-looking scenario insights and practical implications to help executives, consultants and investors identify risks, opportunities and strategy priorities.

 Customizable Excel Spreadsheet
A concise, visually segmented KCC PESTLE summary that distills external risks and opportunities for quick reference in meetings or presentations, editable for region- or business-specific notes and easily dropped into slides or shared across teams.
Economic factors

Cyclical construction demand
Paints, windows and insulation sales closely follow housing starts and infrastructure cycles; the global construction sector represented about 13% of GDP in 2023, so domestic real estate slowdowns can materially cut volumes while overseas projects help offset shortfalls.
KCC therefore needs diversified end-markets and retrofit-focused offerings targeting aging building stocks and energy-efficiency programs to stabilize demand.
Flexible production and capacity scaling enable matching output to sharp cyclical swings in construction activity.
Raw material price volatility
Petrochemical feedstock and titanium dioxide, which can represent up to ~35% of paint/coating raw-material costs, directly pressure KCC gross margins as crude averaged about $82/bbl in 2024 (EIA). Currency moves versus USD amplify import cost swings for feedstocks and TiO2; a 5-10% KRW/USD shift materially alters COGS. Hedging, formula pricing and supplier diversification have reduced realized volatility, while operational efficiency and yield gains further buffer margin shocks.

Automotive and electronics cycles
OEM coatings and specialty materials track global light-vehicle production (IHS Markit: ~66.9 million units in 2023) and electronics output; EV and ADAS adoption (IEA: battery-electric share ~14% of new-car sales in 2023) shifts demand toward advanced functional coatings. KCC should deepen Tier-1 partnerships and qualify on new platforms to capture higher-spec content. Aligning capacity to growth nodes preserves utilization and margin.

Exchange rate fluctuations
KRW volatility, which saw trading roughly between 1,250–1,400 KRW/USD in 2023–H1 2025, directly alters export competitiveness and translates overseas earnings; USD-linked inputs versus KRW-priced sales have compressed margins for exporters, so natural hedging via matched currency cash flows is prudent, and scenario planning (eg ±10% FX shocks) should guide pricing and inventory policy.
- KRW range 1,250–1,400 KRW/USD (2023–H1 2025)
- USD-linked input risk compresses margins
- Natural hedging: match currency cash flows
- Use ±10% FX stress scenarios for pricing/inventory
Interest rates and financing
Tariffs, subsidies, export controls squeeze margins; US tariffs up to 25%
Construction cyclicality (global sector ~13% of GDP in 2023) drives paints/insulation demand; retrofit and exports smooth domestic slowdowns. Feedstock/TiO2 (up to ~35% of paint COGS) and crude (~$82/bbl in 2024) plus KRW 1,250–1,400/USD (2023–H1 2025) volatility materially affect margins. Higher rates (US Fed 5.25–5.50% mid‑2025) raise capex/working‑capital costs; green finance trims funding by ~10–30 bps.
| Metric | Value |
|---|---|
| Global construction | ~13% GDP (2023) |
| Crude | $82/bbl (2024) |
| TiO2 share | ~35% of raw costs |
| KRW/USD | 1,250–1,400 (2023–H1 2025) |
| Fed funds | 5.25–5.50% (mid‑2025) |
Full Version Awaits
KCC PESTLE Analysis
The preview shown here is the exact KCC PESTLE Analysis document you’ll receive after purchase—fully formatted and ready to use. The layout, content, and structure visible are exactly what you’ll download immediately after buying. No placeholders or teasers; this is the final, professionally structured file you’ll own upon checkout.

Original: $10.00
-65%$10.00
$3.50Product Information
Product Information
Shipping & Returns
Shipping & Returns
Description
Make Smarter Strategic Decisions with a Complete PESTEL View
Explore how political shifts, economic trends, social dynamics, and regulatory pressures are reshaping KCC's strategic outlook in our concise PESTLE snapshot—designed to spark immediate strategic action. Whether you’re an investor or strategist, the full PESTLE delivers the deeper insights and data you need to assess risk and seize opportunity. Purchase the complete analysis now for a ready-to-use, downloadable briefing.
Political factors
Trade policy and tariffs
Shifts in US–China–Korea trade ties can quickly change input costs and market access for coatings and chemicals, highlighted by US tariffs on roughly 250 billion dollars of Chinese goods reaching up to 25% since 2018. Tariffs on petrochemical feedstocks or finished paints can compress margins, so KCC must diversify sourcing and use FTAs like KORUS and RCEP to reduce tariff exposure. Active trade compliance and origin planning are essential to preserve cost structure and market access.
Geopolitical tensions
Regional security issues on the Korean Peninsula can disrupt logistics and investor confidence, with South Korea raising defense spending to about 2.8% of GDP in 2024 signaling heightened risk. Heightened tensions increase insurance, hedging and inventory carrying costs for manufacturers. Business continuity plans and multi-country production reduce exposure, while transparent stakeholder communication sustains trust.
Industrial policy incentives
Government backing for advanced materials, EVs and semiconductors fuels demand for specialty coatings; US CHIPS Act allocates about 52 billion dollars for semiconductor incentives and the Inflation Reduction Act includes roughly 369 billion dollars for clean energy, boosting market pull for suppliers like KCC. Subsidies and tax credits such as the US EV tax credit up to 7,500 dollars can lower capex for green upgrades and R&D. KCC can align with national projects and public‑private bids to capture funded contracts, and active monitoring of grant criteria raises win rates.
Public procurement standards
Public procurement increasingly embeds green and safety criteria—favoring low‑VOC paints and certified insulation—boosting eligibility for firms meeting standards; government contracts represent about 12% of GDP across OECD countries, making compliance commercially material. KCC can use eco‑labels and performance certifications to differentiate and frame bids around lifecycle cost savings to strengthen value cases.
- eco-label: leverage recognized certifications
- low-VOC: meet tender thresholds
- lifecycle: quantify total cost savings
- market impact: access public spend ≈12% GDP
Sanctions and export controls
Tighter export controls since 2022 on dual-use chemicals and high-performance materials have constrained sales into sensitive markets, with US, EU and UK regimes expanding scope through 2024–25. Compliance gaps risk license denials, fines and shipment delays; enforcement actions have risen as authorities prioritize strategic industries. KCC must implement robust screening and documentation and map its product portfolio to control lists to reduce disruptions.
- controls: US/EU/UK expansions 2022–25
- risks: license denials, fines, delays
- actions: screening, documentation
- mitigation: product mapping to control lists
Tariffs, subsidies, export controls squeeze margins; US tariffs up to 25%
Trade tensions, tariffs (US tariffs up to 25% on ~250 billion dollars of Chinese goods) and FTAs (KORUS, RCEP) directly affect KCC input costs and margins. Korea’s defense spend ~2.8% of GDP in 2024 raises security and logistics risk. Subsidies (CHIPS ~52 billion dollars, IRA ~369 billion dollars) and public procurement (~12% of GDP) drive demand for certified green coatings. Export controls expanded 2022–25, raising compliance costs.
| Factor | Key number |
|---|---|
| US tariffs | ~25% on $250bn |
| KR defense spend | 2.8% GDP (2024) |
| CHIPS / IRA | $52bn / $369bn |
| Public procurement | ~12% GDP |
What is included in the product
Detailed Word Document
Explores how macro-environmental factors uniquely affect KCC across Political, Economic, Social, Technological, Environmental and Legal dimensions, with data-backed trends, region- and industry-specific examples, forward-looking scenario insights and practical implications to help executives, consultants and investors identify risks, opportunities and strategy priorities.
Customizable Excel Spreadsheet
A concise, visually segmented KCC PESTLE summary that distills external risks and opportunities for quick reference in meetings or presentations, editable for region- or business-specific notes and easily dropped into slides or shared across teams.
Economic factors
Cyclical construction demand
Paints, windows and insulation sales closely follow housing starts and infrastructure cycles; the global construction sector represented about 13% of GDP in 2023, so domestic real estate slowdowns can materially cut volumes while overseas projects help offset shortfalls.
KCC therefore needs diversified end-markets and retrofit-focused offerings targeting aging building stocks and energy-efficiency programs to stabilize demand.
Flexible production and capacity scaling enable matching output to sharp cyclical swings in construction activity.
Raw material price volatility
Petrochemical feedstock and titanium dioxide, which can represent up to ~35% of paint/coating raw-material costs, directly pressure KCC gross margins as crude averaged about $82/bbl in 2024 (EIA). Currency moves versus USD amplify import cost swings for feedstocks and TiO2; a 5-10% KRW/USD shift materially alters COGS. Hedging, formula pricing and supplier diversification have reduced realized volatility, while operational efficiency and yield gains further buffer margin shocks.
Automotive and electronics cycles
OEM coatings and specialty materials track global light-vehicle production (IHS Markit: ~66.9 million units in 2023) and electronics output; EV and ADAS adoption (IEA: battery-electric share ~14% of new-car sales in 2023) shifts demand toward advanced functional coatings. KCC should deepen Tier-1 partnerships and qualify on new platforms to capture higher-spec content. Aligning capacity to growth nodes preserves utilization and margin.
Exchange rate fluctuations
KRW volatility, which saw trading roughly between 1,250–1,400 KRW/USD in 2023–H1 2025, directly alters export competitiveness and translates overseas earnings; USD-linked inputs versus KRW-priced sales have compressed margins for exporters, so natural hedging via matched currency cash flows is prudent, and scenario planning (eg ±10% FX shocks) should guide pricing and inventory policy.
- KRW range 1,250–1,400 KRW/USD (2023–H1 2025)
- USD-linked input risk compresses margins
- Natural hedging: match currency cash flows
- Use ±10% FX stress scenarios for pricing/inventory
Interest rates and financing
Tariffs, subsidies, export controls squeeze margins; US tariffs up to 25%
Construction cyclicality (global sector ~13% of GDP in 2023) drives paints/insulation demand; retrofit and exports smooth domestic slowdowns. Feedstock/TiO2 (up to ~35% of paint COGS) and crude (~$82/bbl in 2024) plus KRW 1,250–1,400/USD (2023–H1 2025) volatility materially affect margins. Higher rates (US Fed 5.25–5.50% mid‑2025) raise capex/working‑capital costs; green finance trims funding by ~10–30 bps.
| Metric | Value |
|---|---|
| Global construction | ~13% GDP (2023) |
| Crude | $82/bbl (2024) |
| TiO2 share | ~35% of raw costs |
| KRW/USD | 1,250–1,400 (2023–H1 2025) |
| Fed funds | 5.25–5.50% (mid‑2025) |
Full Version Awaits
KCC PESTLE Analysis
The preview shown here is the exact KCC PESTLE Analysis document you’ll receive after purchase—fully formatted and ready to use. The layout, content, and structure visible are exactly what you’ll download immediately after buying. No placeholders or teasers; this is the final, professionally structured file you’ll own upon checkout.











