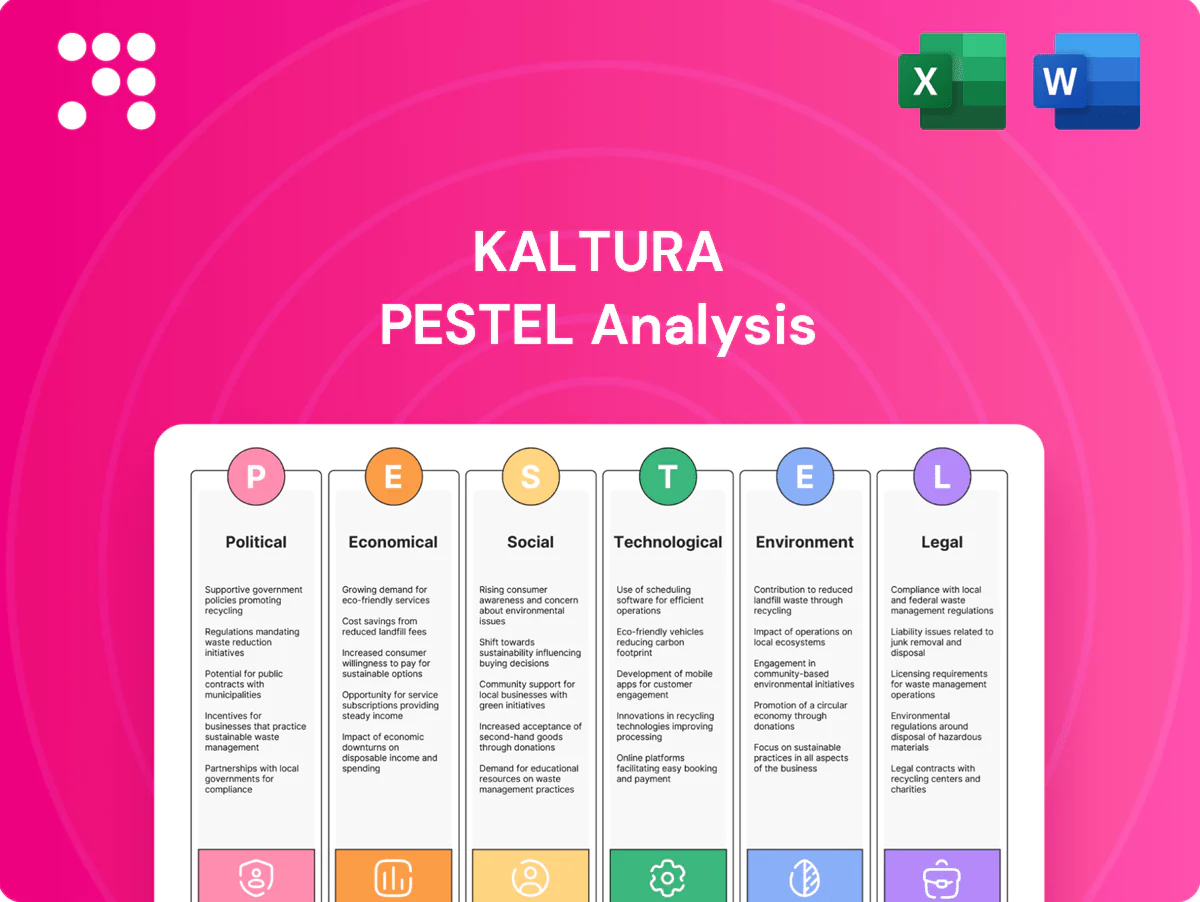
Kaltura PESTLE Analysis

Plan Smarter. Present Sharper. Compete Stronger.
Unlock how political, economic, social, technological, legal, and environmental forces are shaping Kaltura’s trajectory with our concise PESTLE snapshot. This analysis highlights key risks and growth levers to inform investment and strategy decisions. Purchase the full PESTLE for the complete, downloadable briefing and actionable recommendations.
Political factors

Data sovereignty and localization
Data sovereignty rules such as EU GDPR, China PIPL/CSL and India’s RBI 2018 payment-data localization force Kaltura to place video and user data in-country, shaping cloud architecture and CDN edge-node deployment. Global cloud market concentration (AWS ~31%, Azure ~24%, GCP ~11% in 2024) narrows vendor choices and regions. Compliance raises infrastructure and operational costs but serves as a competitive differentiator in regulated markets. Political shifts expanding or easing localization mandates directly affect Kaltura’s go-to-market speed and capital allocation.
Public sector digital strategies
Government funding for digital education—notably the US ARP program’s roughly $122 billion K-12 relief—plus pandemic-era telehealth investments have accelerated lecture capture and virtual events adoption; procurement rules and accreditation timelines lengthen sales cycles; political pushes for digital inclusion create grant and RFP opportunities; budget cuts or policy reversals can abruptly delay or cancel deployments.

Trade relations and export controls
Cloud restrictions on encryption, streaming codecs and AI capabilities in several jurisdictions constrain Kaltura's feature set and deployments; regulatory divergence grew as over 130 countries had data protection laws by 2024. Tariff shifts and sanctions since 2022 have strained partnerships with regional resellers and ISPs, while geopolitical tensions increasingly disrupt cross-border data flows and edge delivery. Diversifying markets reduces exposure to any single political regime.

Net neutrality and platform regulation
Policy on traffic prioritization directly affects video QoS and CDN economics: video accounted for about 82% of internet traffic (Cisco, 2022), so prioritization raises or lowers costs for high‑bitrate delivery. Platform rules (EU DMA 2023; US regulatory patchwork after FCC 2018 repeal) can spill into enterprise/education services, while lobbying shapes egress and peering cost structures; neutral, stable rules enable predictable live‑event QoS.
- Traffic share: video ~82% (Cisco 2022)
- Regulatory drivers: EU DMA 2023; US state-level patchwork
- Cost impact: prioritization changes CDN/egress economics
- Stability: neutral policy = predictable QoS for live events
Education policy and accreditation
National policies on online learning standards shape LMS integrations and lecture capture requirements, with the global e-learning market estimated at about $338 billion in 2024, increasing demand for compliant platforms. Accreditation bodies increasingly require accessibility and assessment features tied to video, forcing Kaltura to prioritize compliance in its product roadmap. Harmonized policies across regions can significantly streamline multi-campus rollouts and reduce implementation friction.
- Policy-driven LMS integration mandates
- Accreditation-linked accessibility and assessment
- Compliance-focused roadmap prioritization
- Regional harmonization eases multi-campus rollouts
Cloud concentration (AWS 31/24/11%) and video 82% raise CDN & infra costs
Political: data‑sovereignty (GDPR, PIPL) forces in‑country hosting and higher infra costs; cloud concentration (AWS 31%, Azure 24%, GCP 11% in 2024) narrows vendor choice; video ~82% of internet traffic raises CDN/egress risk; e‑learning ~$338B (2024) and US ARP ~$122B boost demand but politicized budgets create deployment uncertainty.
| Metric | Value | Impact |
|---|---|---|
| Cloud share | AWS 31%/Azure 24%/GCP 11% (2024) | Vendor risk |
| Video traffic | ~82% (Cisco 2022) | CDN costs |
| E‑learning | $338B (2024) | Demand |
| US ARP | $122B | Procurement |
What is included in the product
 Detailed Word Document
Explores how Political, Economic, Social, Technological, Environmental and Legal forces uniquely impact Kaltura’s video-platform business, with data-driven, region- and industry-specific insights to guide executives, investors and strategists in identifying risks, opportunities and forward-looking scenarios for growth and compliance.

 Customizable Excel Spreadsheet
A concise, visually segmented Kaltura PESTLE summary that removes analysis overload by presenting external risks and opportunities in plain language, easily editable for region- or product-specific notes and ready to drop into presentations or share across teams for fast alignment.
Economic factors

IT spending cycles and macro conditions
Enterprise and university budgets expand or contract with GDP and enrollment; global IT spending reached about $4.5 trillion in 2024 (Gartner) while US higher‑education enrollment fell roughly 4% from 2019–2023 (NCES). Video platforms sold as OPEX subscriptions face cyclical churn and downsell risk, with enterprise SaaS annual churn typically around 5–7%. Strong macro growth in 2023–24 accelerated upgrades to higher tiers and add‑ons, while recessions favor vendors that demonstrably cut training, marketing, or support costs with clear ROI.
Bandwidth and cloud infrastructure costs
CDN, storage and transcoding are major COGS drivers for video — for example AWS S3 standard in US East was $0.023 per GB-month (2024) while CDN egress often dominates delivery spend. AV1 can reduce bitrate roughly 30–50% versus H.264, cutting bandwidth costs, and just-in-time packaging avoids storing multiple renditions. Long-term capacity contracts hedge hyperscaler price volatility but constrain operational flexibility.

Pricing power and competition
Freemium and bundled offers from hyperscalers and UCaaS platforms — with roughly 300 million combined users on major services — compress Kaltura’s ARPU, forcing parity promotions and lower entry pricing. Differentiation through education tools, rich interactivity and analytics enables premium pricing and higher retention (benchmarks show 15–25% revenue uplift for feature-led tiers). Tiered, usage-based models must trade rapid adoption for predictable revenue, while aggressive competitor responses can trigger discounting or packaging shifts.

Customer acquisition and retention costs
Long sales cycles in education and enterprise (commonly 6–18 months) push up Kaltura’s CAC; deep integrations with LMS, CRM and collaboration suites typically boost customer stickiness and can raise LTV by ~20–40% in comparable edtech deployments (2024–25 data). Economies of scale in support and onboarding can cut unit costs roughly 25–35% as installations scale, while upsell into virtual events and monetization features has driven ARPU uplifts of ~15–30%, helping offset churn in legacy modules.
- Sales cycles: 6–18 months
- Integration LTV uplift: ~20–40%
- Onboarding cost reduction: ~25–35%
- ARPU uplift from upsells: ~15–30%
Currency fluctuations and international sales
Global contracts expose Kaltura revenues to FX volatility, increasing reported revenue swings across quarters and complicating margin forecasting. Local pricing and billing lower adoption friction in target markets but raise operational complexity for invoicing and tax compliance. Proactive hedging of receivables and USD-denominated infrastructure commitments can stabilize cash flows and CAPEX planning. FX movements alter the relative attractiveness of regional expansion by shifting local revenue value.
- FX exposure: revenue translation risk
- Local billing: higher churn reduction, higher ops cost
- Hedging: stabilizes infrastructure spend
- Expansion: FX shifts market ROI
Cloud concentration (AWS 31/24/11%) and video 82% raise CDN & infra costs
Enterprise/university budgets follow GDP; global IT spend ~$4.5T (Gartner 2024) and US higher-ed enrollment -4% (2019–23, NCES). CDN/storage drive COGS; AWS S3 $0.023/GB‑mo (US East, 2024) and AV1 cuts bitrate 30–50%. Enterprise SaaS churn ~5–7%; feature-led upsells lift revenue 15–30%.
| Metric | Value |
|---|---|
| Global IT spend | $4.5T (2024) |
| US higher‑ed enrollment | -4% (2019–23) |
| AWS S3 | $0.023/GB‑mo (2024) |
| SaaS churn | 5–7% |
| ARPU uplift | 15–30% |
Same Document Delivered
Kaltura PESTLE Analysis
The preview shown here is the exact Kaltura PESTLE Analysis you'll receive after purchase—fully formatted and ready to use. This real, final file contains the same structured political, economic, social, technological, legal and environmental insights displayed here. No placeholders, no surprises.

Product Information
Product Information
Shipping & Returns
Shipping & Returns
Description
Plan Smarter. Present Sharper. Compete Stronger.
Unlock how political, economic, social, technological, legal, and environmental forces are shaping Kaltura’s trajectory with our concise PESTLE snapshot. This analysis highlights key risks and growth levers to inform investment and strategy decisions. Purchase the full PESTLE for the complete, downloadable briefing and actionable recommendations.
Political factors
Data sovereignty and localization
Data sovereignty rules such as EU GDPR, China PIPL/CSL and India’s RBI 2018 payment-data localization force Kaltura to place video and user data in-country, shaping cloud architecture and CDN edge-node deployment. Global cloud market concentration (AWS ~31%, Azure ~24%, GCP ~11% in 2024) narrows vendor choices and regions. Compliance raises infrastructure and operational costs but serves as a competitive differentiator in regulated markets. Political shifts expanding or easing localization mandates directly affect Kaltura’s go-to-market speed and capital allocation.
Public sector digital strategies
Government funding for digital education—notably the US ARP program’s roughly $122 billion K-12 relief—plus pandemic-era telehealth investments have accelerated lecture capture and virtual events adoption; procurement rules and accreditation timelines lengthen sales cycles; political pushes for digital inclusion create grant and RFP opportunities; budget cuts or policy reversals can abruptly delay or cancel deployments.
Trade relations and export controls
Cloud restrictions on encryption, streaming codecs and AI capabilities in several jurisdictions constrain Kaltura's feature set and deployments; regulatory divergence grew as over 130 countries had data protection laws by 2024. Tariff shifts and sanctions since 2022 have strained partnerships with regional resellers and ISPs, while geopolitical tensions increasingly disrupt cross-border data flows and edge delivery. Diversifying markets reduces exposure to any single political regime.
Net neutrality and platform regulation
Policy on traffic prioritization directly affects video QoS and CDN economics: video accounted for about 82% of internet traffic (Cisco, 2022), so prioritization raises or lowers costs for high‑bitrate delivery. Platform rules (EU DMA 2023; US regulatory patchwork after FCC 2018 repeal) can spill into enterprise/education services, while lobbying shapes egress and peering cost structures; neutral, stable rules enable predictable live‑event QoS.
- Traffic share: video ~82% (Cisco 2022)
- Regulatory drivers: EU DMA 2023; US state-level patchwork
- Cost impact: prioritization changes CDN/egress economics
- Stability: neutral policy = predictable QoS for live events
Education policy and accreditation
National policies on online learning standards shape LMS integrations and lecture capture requirements, with the global e-learning market estimated at about $338 billion in 2024, increasing demand for compliant platforms. Accreditation bodies increasingly require accessibility and assessment features tied to video, forcing Kaltura to prioritize compliance in its product roadmap. Harmonized policies across regions can significantly streamline multi-campus rollouts and reduce implementation friction.
- Policy-driven LMS integration mandates
- Accreditation-linked accessibility and assessment
- Compliance-focused roadmap prioritization
- Regional harmonization eases multi-campus rollouts
Cloud concentration (AWS 31/24/11%) and video 82% raise CDN & infra costs
Political: data‑sovereignty (GDPR, PIPL) forces in‑country hosting and higher infra costs; cloud concentration (AWS 31%, Azure 24%, GCP 11% in 2024) narrows vendor choice; video ~82% of internet traffic raises CDN/egress risk; e‑learning ~$338B (2024) and US ARP ~$122B boost demand but politicized budgets create deployment uncertainty.
| Metric | Value | Impact |
|---|---|---|
| Cloud share | AWS 31%/Azure 24%/GCP 11% (2024) | Vendor risk |
| Video traffic | ~82% (Cisco 2022) | CDN costs |
| E‑learning | $338B (2024) | Demand |
| US ARP | $122B | Procurement |
What is included in the product
Detailed Word Document
Explores how Political, Economic, Social, Technological, Environmental and Legal forces uniquely impact Kaltura’s video-platform business, with data-driven, region- and industry-specific insights to guide executives, investors and strategists in identifying risks, opportunities and forward-looking scenarios for growth and compliance.
Customizable Excel Spreadsheet
A concise, visually segmented Kaltura PESTLE summary that removes analysis overload by presenting external risks and opportunities in plain language, easily editable for region- or product-specific notes and ready to drop into presentations or share across teams for fast alignment.
Economic factors
IT spending cycles and macro conditions
Enterprise and university budgets expand or contract with GDP and enrollment; global IT spending reached about $4.5 trillion in 2024 (Gartner) while US higher‑education enrollment fell roughly 4% from 2019–2023 (NCES). Video platforms sold as OPEX subscriptions face cyclical churn and downsell risk, with enterprise SaaS annual churn typically around 5–7%. Strong macro growth in 2023–24 accelerated upgrades to higher tiers and add‑ons, while recessions favor vendors that demonstrably cut training, marketing, or support costs with clear ROI.
Bandwidth and cloud infrastructure costs
CDN, storage and transcoding are major COGS drivers for video — for example AWS S3 standard in US East was $0.023 per GB-month (2024) while CDN egress often dominates delivery spend. AV1 can reduce bitrate roughly 30–50% versus H.264, cutting bandwidth costs, and just-in-time packaging avoids storing multiple renditions. Long-term capacity contracts hedge hyperscaler price volatility but constrain operational flexibility.
Pricing power and competition
Freemium and bundled offers from hyperscalers and UCaaS platforms — with roughly 300 million combined users on major services — compress Kaltura’s ARPU, forcing parity promotions and lower entry pricing. Differentiation through education tools, rich interactivity and analytics enables premium pricing and higher retention (benchmarks show 15–25% revenue uplift for feature-led tiers). Tiered, usage-based models must trade rapid adoption for predictable revenue, while aggressive competitor responses can trigger discounting or packaging shifts.
Customer acquisition and retention costs
Long sales cycles in education and enterprise (commonly 6–18 months) push up Kaltura’s CAC; deep integrations with LMS, CRM and collaboration suites typically boost customer stickiness and can raise LTV by ~20–40% in comparable edtech deployments (2024–25 data). Economies of scale in support and onboarding can cut unit costs roughly 25–35% as installations scale, while upsell into virtual events and monetization features has driven ARPU uplifts of ~15–30%, helping offset churn in legacy modules.
- Sales cycles: 6–18 months
- Integration LTV uplift: ~20–40%
- Onboarding cost reduction: ~25–35%
- ARPU uplift from upsells: ~15–30%
Currency fluctuations and international sales
Global contracts expose Kaltura revenues to FX volatility, increasing reported revenue swings across quarters and complicating margin forecasting. Local pricing and billing lower adoption friction in target markets but raise operational complexity for invoicing and tax compliance. Proactive hedging of receivables and USD-denominated infrastructure commitments can stabilize cash flows and CAPEX planning. FX movements alter the relative attractiveness of regional expansion by shifting local revenue value.
- FX exposure: revenue translation risk
- Local billing: higher churn reduction, higher ops cost
- Hedging: stabilizes infrastructure spend
- Expansion: FX shifts market ROI
Cloud concentration (AWS 31/24/11%) and video 82% raise CDN & infra costs
Enterprise/university budgets follow GDP; global IT spend ~$4.5T (Gartner 2024) and US higher-ed enrollment -4% (2019–23, NCES). CDN/storage drive COGS; AWS S3 $0.023/GB‑mo (US East, 2024) and AV1 cuts bitrate 30–50%. Enterprise SaaS churn ~5–7%; feature-led upsells lift revenue 15–30%.
| Metric | Value |
|---|---|
| Global IT spend | $4.5T (2024) |
| US higher‑ed enrollment | -4% (2019–23) |
| AWS S3 | $0.023/GB‑mo (2024) |
| SaaS churn | 5–7% |
| ARPU uplift | 15–30% |
Same Document Delivered
Kaltura PESTLE Analysis
The preview shown here is the exact Kaltura PESTLE Analysis you'll receive after purchase—fully formatted and ready to use. This real, final file contains the same structured political, economic, social, technological, legal and environmental insights displayed here. No placeholders, no surprises.











