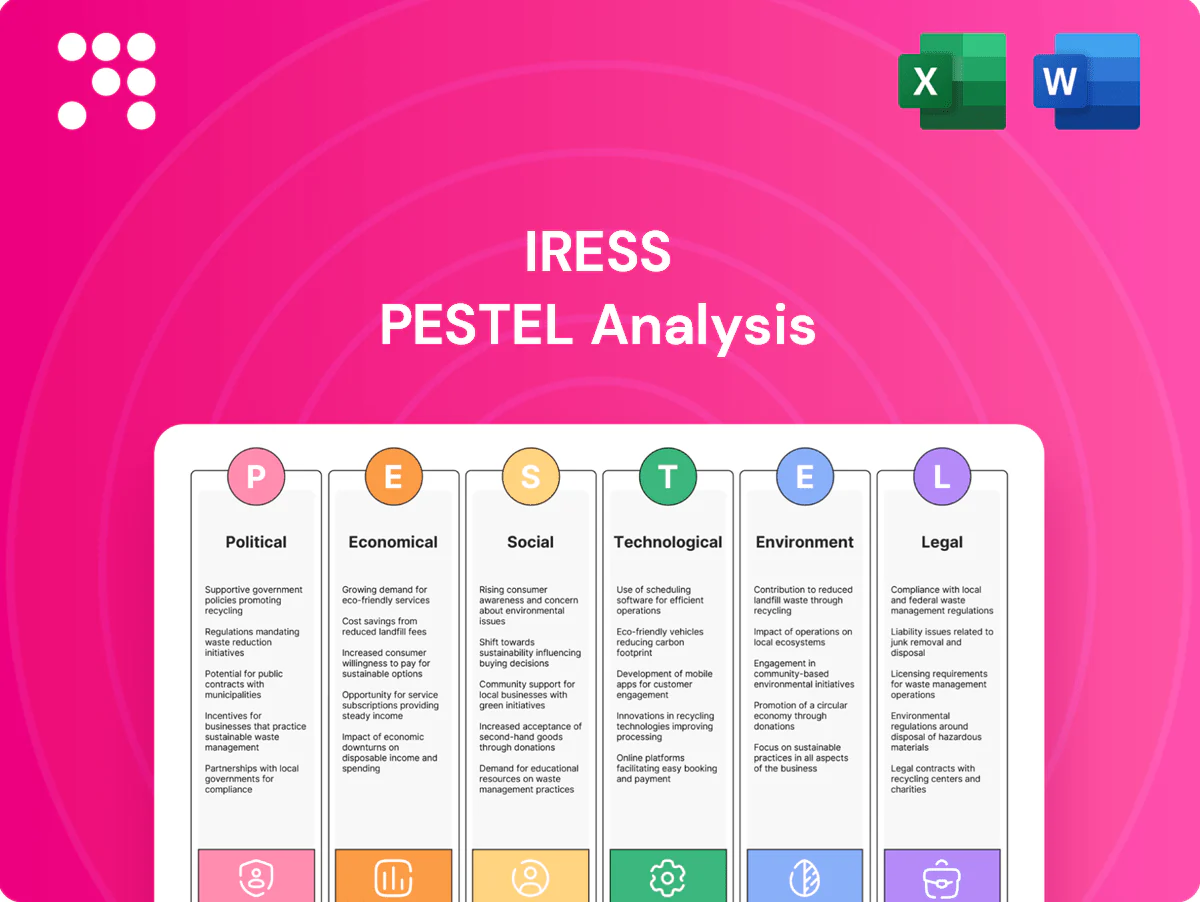
IRESS PESTLE Analysis

Skip the Research. Get the Strategy.
Discover how political shifts, economic cycles, and rapid fintech innovation are shaping IRESS’s strategic outlook in our focused PESTLE snapshot. This concise analysis highlights immediate risks and opportunities for investors and advisors. Purchase the full PESTLE to unlock the complete, actionable intelligence and ready-to-use insights.
Political factors

Regulatory stability
Financial software adoption depends on predictable policy environments across key markets, as clients plan multi-year (3-5 year) deployments. Sudden shifts in oversight of trading, advice or pensions can delay client projects, often pushing timelines by 6-12 months. Political turnover raises backlog and revenue timing risks, increasing forecasting variance and capex phasing.
Gov’t digital agendas
Public support for fintech and open finance—backed by over 60% of major regulators—has accelerated standards and funding, with the global open banking market estimated at $11.5bn in 2024. Mandates like PSD2 and national open banking rules expand integration across 30+ jurisdictions. Conversely, underfunded digital programs delay modernization; IRESS can align offerings to policy priorities to improve tender win rates.

Cross‑border relations
Cross‑border trade relations shape IRESS’s data residency, talent mobility and sales cycles; for example GDPR across 27 EU states forces local hosting and contractual changes. Geopolitical friction raises compliance and hosting costs via multi‑jurisdiction audits and localisation. Friendly ties lower barriers to market entry and vendor certification, while sanctions and export controls from major regimes (US, EU, UK) can restrict market data flows and client eligibility.

Public sector procurement
Government and quasi‑public superannuation schemes — holding roughly AUD 3.5 trillion in assets in 2024 (APRA) — materially influence demand for IRESS platforms, driving preference for secure, standards‑compliant vendors with proven local support. Procurement rules and long tender cycles (often 12–24 months) favor incumbents with strong onshore presence; once onboarded revenue tends to be sticky due to integration and switching costs. Budget shifts or policy reprioritisations can rapidly divert digital spend away from vendor roadmaps.
- Procurement bias: secure, standards‑compliant vendors with local teams
- Sales dynamics: long cycles (12–24 months) but high retention once contracted
- Risk: policy or budget shifts can reallocate digital funding quickly
Tax and incentives
R&D credits and tech incentives cut development costs—R&D reliefs commonly cover 10–30% of eligible spend across key markets, lowering IRESS’s effective R&D outlay.
Shifts in corporate tax rates matter: OECD average statutory rate ~22% in 2024, so a 1–2pp change meaningfully alters post-tax margins and pricing flexibility.
Global operations raise transfer pricing scrutiny (OECD MAP cases rose ~8% in 2023); cloud-adoption incentives and tax deductions, alongside 2023 cloud spending growth over 20%, accelerate client migrations.
- R&D credits: 10–30% of eligible spend
- OECD avg CIT: ~22% (2024)
- MAP cases change: +8% (2023)
- Cloud spend growth: >20% (2023)
Political risk prolongs sales cycles; open finance growth boosts compliance and localisation costs
Political risk drives multi‑year sales cycles and backlog volatility, with policy shifts often delaying deployments 6–12 months. Open finance mandates and regulator support (open banking market $11.5bn in 2024) expand integration but raise compliance costs. Trade rules, sanctions and GDPR force localisation and add audit costs. Public pensions (AU AUM AUD3.5tn) and procurement bias favor local, standards‑compliant vendors.
| Metric | 2024 |
|---|---|
| Open banking market | $11.5bn |
| Superannuation AUM (AU) | AUD3.5tn |
| OECD avg CIT | 22% |
What is included in the product
 Detailed Word Document
Explores how macro-environmental factors uniquely affect IRESS across Political, Economic, Social, Technological, Environmental, and Legal dimensions, with data-backed trends and region-specific regulatory context; designed for executives, consultants, and investors to identify risks, opportunities, and forward-looking scenarios, delivered in clean, report-ready format with actionable sub-points for strategy and funding discussions.

 Customizable Excel Spreadsheet
Clean, visually segmented IRESS PESTLE summaries condense external risks and market drivers into an editable, shareable format ideal for quick alignment in meetings or slide decks, helping teams and consultants rapidly contextualize strategy and support planning discussions.
Economic factors

Market volatility
Market volatility drives higher trading and market data usage, with spikes like the 2022 VIX peak near 36 increasing activity and fees. Higher activity can boost transactional and data revenues—firms reported double-digit volume uplifts during spikes. Prolonged calm (VIX ~16 in 2024) can compress volumes and pricing. Product mix should balance cyclical transaction income with stable subscription streams to smooth revenue.
Interest rate cycles
Interest rate cycles (Fed funds 5.25–5.50% mid‑2025; RBA ~4.35%) redirect wealth flows, shifting demand for advice and pushing clients from equities to bonds or cash, altering asset allocation. Client IT budgets expand in growth phases and constrict in downturns, while compulsory superannuation at 12% (Australia, 2025) sustains inflows but investment projects may stagger. Pricing models should incorporate rate sensitivity and hedge macro swings.

FX exposure
Multi-currency revenues and costs expose IRESS to translation risk; in FY24 IRESS reported A$512.4m revenue with roughly half generated outside Australia, so AUD strength can compress reported sales. Natural hedges from offshore costs and localized subsidiaries reduce but do not eliminate volatility. Active hedging policies and localized pricing strategies are used to mitigate FX impact on margins.

Consolidation of clients
Mergers among brokers, wealth firms and pension funds are shrinking customer logos, pushing surviving clients to demand deeper integrations and sharper pricing; this drives IRESS to prioritize scalable enterprise modules and value-based pricing. Consolidation creates upside through larger enterprise deals, but post‑merger system rationalization often triggers short‑term churn or selective platform expansion as acquirers standardize stacks.
- Consolidation reduces logos, increases deal size
- Clients demand deeper integrations and pressure on pricing
- Opportunity: larger enterprise contracts
- Risk: post‑merger rationalization causes churn or selective expansion
IT spend cycles
Enterprises cycle between build and buy phases, with cloud OPEX models increasingly competing against legacy CAPEX budgets; Gartner estimated worldwide IT spending at about US$5.1 trillion in 2024 while public cloud services exceeded roughly US$600 billion, shifting procurement to subscription economics. Clear ROI on compliance and efficiency keeps spend resilient during slowdowns, and widespread project deferrals in downturns create measurable pent‑up demand.
- Build vs buy: procurement swings impact vendor demand
- Cloud OPEX ~US$600B market pressures CAPEX
- Compliance ROI sustains spend in slowdowns
- Deferred projects = future pent‑up demand
Political risk prolongs sales cycles; open finance growth boosts compliance and localisation costs
Market volatility lifts transaction and data revenue (VIX spiking to ~36 in 2022, calmer ~16 in 2024); rates (Fed 5.25–5.50% mid‑2025; RBA ~4.35%) shift asset allocation and IT budgets; FX (IRESS FY24 A$512.4m, ~50% offshore) creates translation risk; consolidation and cloud OPEX (global IT spend US$5.1T, public cloud ~US$600B in 2024) reshape buying patterns.
| Metric | Value |
|---|---|
| VIX | 36 (2022 peak) / ~16 (2024) |
| Fed funds (mid‑2025) | 5.25–5.50% |
| RBA | ~4.35% |
| IRESS FY24 revenue | A$512.4m (~50% offshore) |
| Superannuation (AUS 2025) | 12% |
| Global IT spend (2024) | US$5.1T; public cloud ~US$600B |
Same Document Delivered
IRESS PESTLE Analysis
The preview of the IRESS PESTLE Analysis shown here is the exact, fully formatted document you’ll receive after purchase—no placeholders or teasers. The content, layout and structure are final and ready to download and use immediately upon payment.

Original: $10.00
-65%$10.00
$3.50Product Information
Product Information
Shipping & Returns
Shipping & Returns
Description
Skip the Research. Get the Strategy.
Discover how political shifts, economic cycles, and rapid fintech innovation are shaping IRESS’s strategic outlook in our focused PESTLE snapshot. This concise analysis highlights immediate risks and opportunities for investors and advisors. Purchase the full PESTLE to unlock the complete, actionable intelligence and ready-to-use insights.
Political factors
Regulatory stability
Financial software adoption depends on predictable policy environments across key markets, as clients plan multi-year (3-5 year) deployments. Sudden shifts in oversight of trading, advice or pensions can delay client projects, often pushing timelines by 6-12 months. Political turnover raises backlog and revenue timing risks, increasing forecasting variance and capex phasing.
Gov’t digital agendas
Public support for fintech and open finance—backed by over 60% of major regulators—has accelerated standards and funding, with the global open banking market estimated at $11.5bn in 2024. Mandates like PSD2 and national open banking rules expand integration across 30+ jurisdictions. Conversely, underfunded digital programs delay modernization; IRESS can align offerings to policy priorities to improve tender win rates.
Cross‑border relations
Cross‑border trade relations shape IRESS’s data residency, talent mobility and sales cycles; for example GDPR across 27 EU states forces local hosting and contractual changes. Geopolitical friction raises compliance and hosting costs via multi‑jurisdiction audits and localisation. Friendly ties lower barriers to market entry and vendor certification, while sanctions and export controls from major regimes (US, EU, UK) can restrict market data flows and client eligibility.
Public sector procurement
Government and quasi‑public superannuation schemes — holding roughly AUD 3.5 trillion in assets in 2024 (APRA) — materially influence demand for IRESS platforms, driving preference for secure, standards‑compliant vendors with proven local support. Procurement rules and long tender cycles (often 12–24 months) favor incumbents with strong onshore presence; once onboarded revenue tends to be sticky due to integration and switching costs. Budget shifts or policy reprioritisations can rapidly divert digital spend away from vendor roadmaps.
- Procurement bias: secure, standards‑compliant vendors with local teams
- Sales dynamics: long cycles (12–24 months) but high retention once contracted
- Risk: policy or budget shifts can reallocate digital funding quickly
Tax and incentives
R&D credits and tech incentives cut development costs—R&D reliefs commonly cover 10–30% of eligible spend across key markets, lowering IRESS’s effective R&D outlay.
Shifts in corporate tax rates matter: OECD average statutory rate ~22% in 2024, so a 1–2pp change meaningfully alters post-tax margins and pricing flexibility.
Global operations raise transfer pricing scrutiny (OECD MAP cases rose ~8% in 2023); cloud-adoption incentives and tax deductions, alongside 2023 cloud spending growth over 20%, accelerate client migrations.
- R&D credits: 10–30% of eligible spend
- OECD avg CIT: ~22% (2024)
- MAP cases change: +8% (2023)
- Cloud spend growth: >20% (2023)
Political risk prolongs sales cycles; open finance growth boosts compliance and localisation costs
Political risk drives multi‑year sales cycles and backlog volatility, with policy shifts often delaying deployments 6–12 months. Open finance mandates and regulator support (open banking market $11.5bn in 2024) expand integration but raise compliance costs. Trade rules, sanctions and GDPR force localisation and add audit costs. Public pensions (AU AUM AUD3.5tn) and procurement bias favor local, standards‑compliant vendors.
| Metric | 2024 |
|---|---|
| Open banking market | $11.5bn |
| Superannuation AUM (AU) | AUD3.5tn |
| OECD avg CIT | 22% |
What is included in the product
Detailed Word Document
Explores how macro-environmental factors uniquely affect IRESS across Political, Economic, Social, Technological, Environmental, and Legal dimensions, with data-backed trends and region-specific regulatory context; designed for executives, consultants, and investors to identify risks, opportunities, and forward-looking scenarios, delivered in clean, report-ready format with actionable sub-points for strategy and funding discussions.
Customizable Excel Spreadsheet
Clean, visually segmented IRESS PESTLE summaries condense external risks and market drivers into an editable, shareable format ideal for quick alignment in meetings or slide decks, helping teams and consultants rapidly contextualize strategy and support planning discussions.
Economic factors
Market volatility
Market volatility drives higher trading and market data usage, with spikes like the 2022 VIX peak near 36 increasing activity and fees. Higher activity can boost transactional and data revenues—firms reported double-digit volume uplifts during spikes. Prolonged calm (VIX ~16 in 2024) can compress volumes and pricing. Product mix should balance cyclical transaction income with stable subscription streams to smooth revenue.
Interest rate cycles
Interest rate cycles (Fed funds 5.25–5.50% mid‑2025; RBA ~4.35%) redirect wealth flows, shifting demand for advice and pushing clients from equities to bonds or cash, altering asset allocation. Client IT budgets expand in growth phases and constrict in downturns, while compulsory superannuation at 12% (Australia, 2025) sustains inflows but investment projects may stagger. Pricing models should incorporate rate sensitivity and hedge macro swings.
FX exposure
Multi-currency revenues and costs expose IRESS to translation risk; in FY24 IRESS reported A$512.4m revenue with roughly half generated outside Australia, so AUD strength can compress reported sales. Natural hedges from offshore costs and localized subsidiaries reduce but do not eliminate volatility. Active hedging policies and localized pricing strategies are used to mitigate FX impact on margins.
Consolidation of clients
Mergers among brokers, wealth firms and pension funds are shrinking customer logos, pushing surviving clients to demand deeper integrations and sharper pricing; this drives IRESS to prioritize scalable enterprise modules and value-based pricing. Consolidation creates upside through larger enterprise deals, but post‑merger system rationalization often triggers short‑term churn or selective platform expansion as acquirers standardize stacks.
- Consolidation reduces logos, increases deal size
- Clients demand deeper integrations and pressure on pricing
- Opportunity: larger enterprise contracts
- Risk: post‑merger rationalization causes churn or selective expansion
IT spend cycles
Enterprises cycle between build and buy phases, with cloud OPEX models increasingly competing against legacy CAPEX budgets; Gartner estimated worldwide IT spending at about US$5.1 trillion in 2024 while public cloud services exceeded roughly US$600 billion, shifting procurement to subscription economics. Clear ROI on compliance and efficiency keeps spend resilient during slowdowns, and widespread project deferrals in downturns create measurable pent‑up demand.
- Build vs buy: procurement swings impact vendor demand
- Cloud OPEX ~US$600B market pressures CAPEX
- Compliance ROI sustains spend in slowdowns
- Deferred projects = future pent‑up demand
Political risk prolongs sales cycles; open finance growth boosts compliance and localisation costs
Market volatility lifts transaction and data revenue (VIX spiking to ~36 in 2022, calmer ~16 in 2024); rates (Fed 5.25–5.50% mid‑2025; RBA ~4.35%) shift asset allocation and IT budgets; FX (IRESS FY24 A$512.4m, ~50% offshore) creates translation risk; consolidation and cloud OPEX (global IT spend US$5.1T, public cloud ~US$600B in 2024) reshape buying patterns.
| Metric | Value |
|---|---|
| VIX | 36 (2022 peak) / ~16 (2024) |
| Fed funds (mid‑2025) | 5.25–5.50% |
| RBA | ~4.35% |
| IRESS FY24 revenue | A$512.4m (~50% offshore) |
| Superannuation (AUS 2025) | 12% |
| Global IT spend (2024) | US$5.1T; public cloud ~US$600B |
Same Document Delivered
IRESS PESTLE Analysis
The preview of the IRESS PESTLE Analysis shown here is the exact, fully formatted document you’ll receive after purchase—no placeholders or teasers. The content, layout and structure are final and ready to download and use immediately upon payment.











