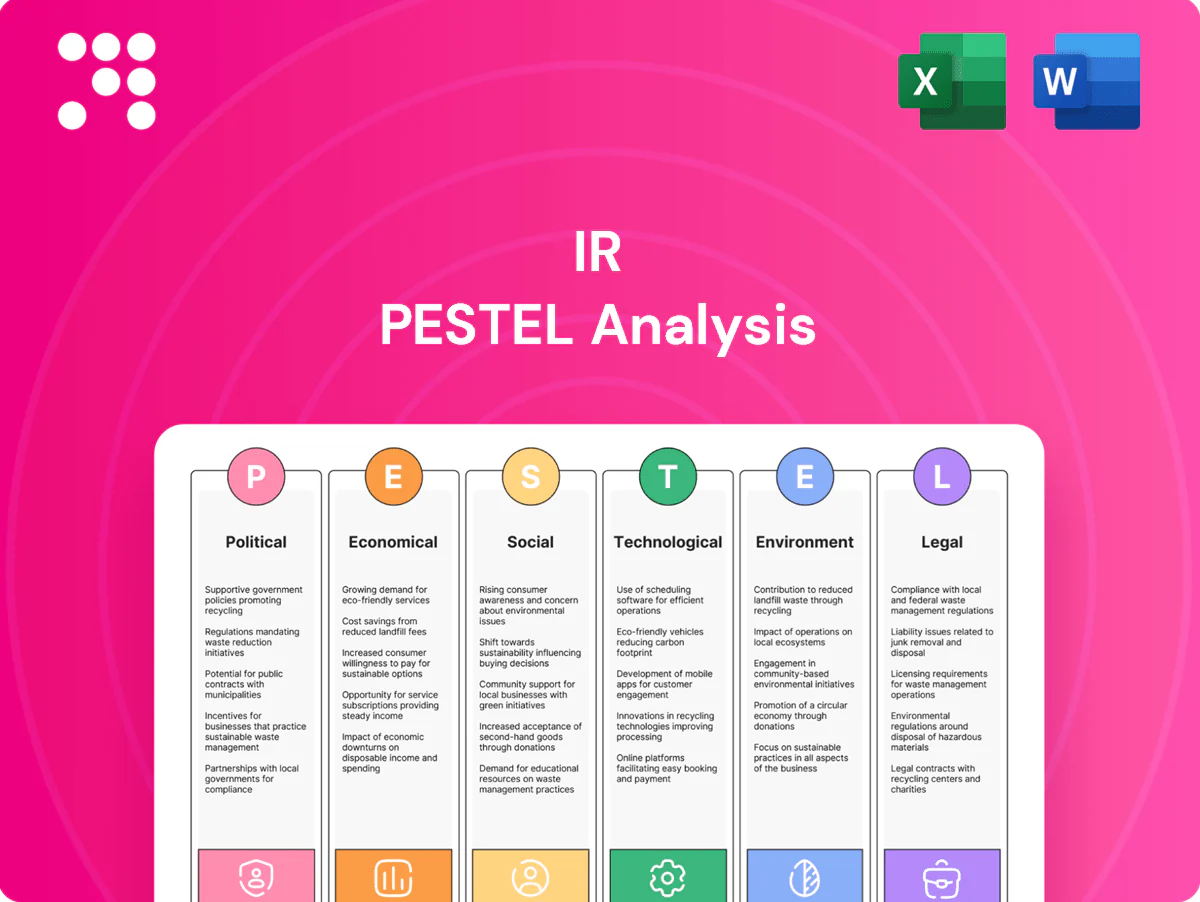
IR PESTLE Analysis

Plan Smarter. Present Sharper. Compete Stronger.
Discover how political, economic, social, technological, legal and environmental forces shape IR’s trajectory and reveal both risks and growth opportunities. Our concise PESTLE distils market-moving trends into actionable insights for investors, analysts and strategists. Purchase the full, editable report to access the complete breakdown and make smarter, faster decisions today.
Political factors

Trade policy volatility
IR’s global supply chain for compressors, pumps and tools is highly sensitive to tariffs and export controls; shifts in U.S.‑China and EU trade relations—including U.S. Section 301 tariffs up to 25%—can raise input costs and extend delivery lead times. Proactive sourcing diversification and tariff engineering reduce exposure. U.S. incentives such as the $369 billion Inflation Reduction Act could accelerate reshoring and realign manufacturing footprints.
Infrastructure and industrial policy
Public spending on infrastructure, energy, water and healthcare—e.g., the U.S. IIJA total package of roughly $1.2 trillion (about $550 billion new spending) and EPA estimates of ~$744 billion water-system needs—drives demand for pumps, compressors and other flow-creation equipment. Global programs such as NextGenerationEU (~€807 billion) and a Global Infrastructure Hub estimate of $94 trillion to 2040 catalyze capex cycles. IR should align product roadmaps to funded projects and emerging standards, while noting that project delays or political turnover can stall procurement pipelines and shift revenue timing.

Geopolitical risk and sanctions
Conflict zones and expanding sanction regimes increasingly restrict market access and service delivery, with consolidated US/EU lists now covering over 4,000 entities and individuals (2024). IR teams must monitor end-use and counterparties in real time to avoid fines and debarment. Regionalization pressures push firms toward localized assembly and service hubs to preserve market presence. Political risk insurance and scenario plans preserve revenue continuity amid embargoes and export controls.

Government sustainability agendas
Government net-zero and energy-efficiency agendas—over 140 countries covering about 85% of global emissions have net-zero pledges—drive demand for high-efficiency compressors and vacuum systems; global clean-energy investment topped $1 trillion in 2023 and US IRA tax credits (~$370bn) boost low-emission tech adoption. Subsidies and green procurement favor certified solutions, but policy reversals can rapidly change incentive economics.
- Net-zero: 140+ countries (~85% emissions)
- Investment: >$1T clean energy (2023)
- US IRA: ~$370bn credits
- Opportunity: certifications win tenders
- Risk: policy reversals alter ROI
Public health and safety preparedness
Healthcare and biopharma policies drive demand for sterile air and vacuum systems as hospitals and manufacturers adopt stricter contamination controls; pandemic preparedness funding, including the World Bank/WHO Pandemic Fund with roughly 1.8 billion USD pledged by 2024, accelerates capacity expansions. IR can position validated, compliant solutions for regulated environments, while cross-border health regulations lengthen service mobilization and lead times.
- Regulatory-driven demand up for sterile systems
- ~1.8B USD Pandemic Fund (2024) boosts capex
- Validated IR solutions fit regulated sites
- Cross-border rules increase lead times
Tariffs ≤ 25%, sanctions force reshoring vs $369B
IR faces tariff and export-control risk (US Section 301 up to 25%), prompting sourcing diversification and reshoring driven by US IRA (~$369B). Large public capex—IIJA ~$1.2T (≈$550B new), NextGenerationEU €807B—boosts demand but procurement timing is political. Sanctions (>4,000 entities, 2024) and 140+ net‑zero countries (~85% emissions) favor high‑efficiency certified products; policy reversals remain a key risk.
| Factor | Key data | Implication |
|---|---|---|
| Trade | Section 301 ≤25% | Higher input costs, diversify sourcing |
| Infrastructure | IIJA ~$1.2T; NextGenEU €807B | Capex tailwinds, timing risk |
| Sanctions | >4,000 entities (2024) | Compliance, market access limits |
| Climate policy | 140+ net‑zero (~85% emissions) | Demand for efficiency, subsidy-driven wins |
What is included in the product
 Detailed Word Document
Explores how external macro-environmental factors uniquely affect the IR across six dimensions—Political, Economic, Social, Technological, Environmental, and Legal—providing data-backed trends, region- and industry-specific examples, forward-looking scenarios, and actionable implications to help executives, investors, and consultants identify risks, opportunities, and strategic responses.

 Customizable Excel Spreadsheet
Condensed IR PESTLE that’s visually segmented for investor relations—quick to reference in meetings or presentations, easily annotated for region- or business-specific context, and formatted for seamless sharing across teams.
Economic factors

Industrial production cycles
IR’s revenue closely follows global PMI and capex cycles—global manufacturing PMI hovered around 50 in H1 2025—driving demand across manufacturing, energy and infrastructure; capex upticks lift new-equipment sales while downturns postpone buys but increase service and parts work. Strong backlog levels and an aftermarket mix (roughly 30%–40% of revenues for peer industrials) buffer near-term volatility, while regional PMI divergence lets IR rebalance its portfolio geographically.
Interest rates and financing costs
Higher interest rates—US Fed funds around 5.25–5.50% in mid-2025—increase customer hurdle rates and commonly defer large equipment purchases. IR’s WACC and M&A capacity are rate-sensitive, tightening deal activity and valuation multiples. Offering financing or outcome-based contracts mitigates customer capex constraints. Rate cuts usually unlock substantial deferred demand.

Commodity and logistics costs
Rising steel and aluminum input costs and surging rare-earth prices in 2024-25, together with freight volatility—reflected in container surcharges often ranging 5-12%—compressed OEM margins. Dynamic pricing and fuel/peak surcharges helped recover inflationary pressure, stabilizing gross margins. Dual-sourcing and localized inventories cut disruption exposure, while design-to-cost and material substitution improved unit economics, often trimming 2-5% of BOM cost.

Currency fluctuations
- FX scale: BIS 7.5T daily
- Natural hedge: local costs lower translation risk
- Financial hedge: forwards/options stabilize EPS
- Pricing discipline: required for volatile EM currencies
M&A and portfolio optimization
Industry fragmentation in vacuum, blowers and services creates tuck-in targets that typically boost consolidated EBITDA margins by 100–300 bps and unlock channel leverage and shared components for 5–15% cost synergies; private-equity and strategic buyers timed deals around 2024 multiples (~7–11x EBITDA) as macro shifts compressed values.
- tuck-in targets: niche vacuum/blower/service firms
- synergies: channel leverage, shared components, 5–15% cost saves
- EBITDA uplift: +100–300 bps
- 2024 multiples: ~7–11x EBITDA
- pruning: focus on non-core divestitures to sharpen ROIC
Tariffs ≤ 25%, sanctions force reshoring vs $369B
IR revenue tracks global PMI (~50 H1 2025); capex ups lift new-equipment while downturns boost aftermarket (30–40% rev). Higher rates (Fed 5.25–5.50% mid-2025) raise customer hurdles and tighten WACC/M&A; financing mitigates. Input inflation (steel/aluminum +8–15% 2024–25; container surcharges 5–12%) squeezed margins; hedging and pricing restored most losses.
| Metric | Value |
|---|---|
| Global PMI | ~50 (H1 2025) |
| Fed funds | 5.25–5.50% (mid‑2025) |
| Aftermarket | 30–40% rev |
| Input inflation | steel/alum +8–15% (24–25) |
| Container surcharges | 5–12% |
| FX turnover (BIS) | USD 7.5T daily (2022) |
| 2024 M&A multiples | ~7–11x EBITDA |
Preview the Actual Deliverable
IR PESTLE Analysis
The preview shown here is the exact IR PESTLE Analysis document you’ll receive after purchase — fully formatted, professionally structured, and ready to use. This is the real file, not a teaser or placeholder, so the content and layout you see are what you’ll download. After checkout you’ll instantly get this same finished document with no surprises.

Product Information
Product Information
Shipping & Returns
Shipping & Returns
Description
Plan Smarter. Present Sharper. Compete Stronger.
Discover how political, economic, social, technological, legal and environmental forces shape IR’s trajectory and reveal both risks and growth opportunities. Our concise PESTLE distils market-moving trends into actionable insights for investors, analysts and strategists. Purchase the full, editable report to access the complete breakdown and make smarter, faster decisions today.
Political factors
Trade policy volatility
IR’s global supply chain for compressors, pumps and tools is highly sensitive to tariffs and export controls; shifts in U.S.‑China and EU trade relations—including U.S. Section 301 tariffs up to 25%—can raise input costs and extend delivery lead times. Proactive sourcing diversification and tariff engineering reduce exposure. U.S. incentives such as the $369 billion Inflation Reduction Act could accelerate reshoring and realign manufacturing footprints.
Infrastructure and industrial policy
Public spending on infrastructure, energy, water and healthcare—e.g., the U.S. IIJA total package of roughly $1.2 trillion (about $550 billion new spending) and EPA estimates of ~$744 billion water-system needs—drives demand for pumps, compressors and other flow-creation equipment. Global programs such as NextGenerationEU (~€807 billion) and a Global Infrastructure Hub estimate of $94 trillion to 2040 catalyze capex cycles. IR should align product roadmaps to funded projects and emerging standards, while noting that project delays or political turnover can stall procurement pipelines and shift revenue timing.
Geopolitical risk and sanctions
Conflict zones and expanding sanction regimes increasingly restrict market access and service delivery, with consolidated US/EU lists now covering over 4,000 entities and individuals (2024). IR teams must monitor end-use and counterparties in real time to avoid fines and debarment. Regionalization pressures push firms toward localized assembly and service hubs to preserve market presence. Political risk insurance and scenario plans preserve revenue continuity amid embargoes and export controls.
Government sustainability agendas
Government net-zero and energy-efficiency agendas—over 140 countries covering about 85% of global emissions have net-zero pledges—drive demand for high-efficiency compressors and vacuum systems; global clean-energy investment topped $1 trillion in 2023 and US IRA tax credits (~$370bn) boost low-emission tech adoption. Subsidies and green procurement favor certified solutions, but policy reversals can rapidly change incentive economics.
- Net-zero: 140+ countries (~85% emissions)
- Investment: >$1T clean energy (2023)
- US IRA: ~$370bn credits
- Opportunity: certifications win tenders
- Risk: policy reversals alter ROI
Public health and safety preparedness
Healthcare and biopharma policies drive demand for sterile air and vacuum systems as hospitals and manufacturers adopt stricter contamination controls; pandemic preparedness funding, including the World Bank/WHO Pandemic Fund with roughly 1.8 billion USD pledged by 2024, accelerates capacity expansions. IR can position validated, compliant solutions for regulated environments, while cross-border health regulations lengthen service mobilization and lead times.
- Regulatory-driven demand up for sterile systems
- ~1.8B USD Pandemic Fund (2024) boosts capex
- Validated IR solutions fit regulated sites
- Cross-border rules increase lead times
Tariffs ≤ 25%, sanctions force reshoring vs $369B
IR faces tariff and export-control risk (US Section 301 up to 25%), prompting sourcing diversification and reshoring driven by US IRA (~$369B). Large public capex—IIJA ~$1.2T (≈$550B new), NextGenerationEU €807B—boosts demand but procurement timing is political. Sanctions (>4,000 entities, 2024) and 140+ net‑zero countries (~85% emissions) favor high‑efficiency certified products; policy reversals remain a key risk.
| Factor | Key data | Implication |
|---|---|---|
| Trade | Section 301 ≤25% | Higher input costs, diversify sourcing |
| Infrastructure | IIJA ~$1.2T; NextGenEU €807B | Capex tailwinds, timing risk |
| Sanctions | >4,000 entities (2024) | Compliance, market access limits |
| Climate policy | 140+ net‑zero (~85% emissions) | Demand for efficiency, subsidy-driven wins |
What is included in the product
Detailed Word Document
Explores how external macro-environmental factors uniquely affect the IR across six dimensions—Political, Economic, Social, Technological, Environmental, and Legal—providing data-backed trends, region- and industry-specific examples, forward-looking scenarios, and actionable implications to help executives, investors, and consultants identify risks, opportunities, and strategic responses.
Customizable Excel Spreadsheet
Condensed IR PESTLE that’s visually segmented for investor relations—quick to reference in meetings or presentations, easily annotated for region- or business-specific context, and formatted for seamless sharing across teams.
Economic factors
Industrial production cycles
IR’s revenue closely follows global PMI and capex cycles—global manufacturing PMI hovered around 50 in H1 2025—driving demand across manufacturing, energy and infrastructure; capex upticks lift new-equipment sales while downturns postpone buys but increase service and parts work. Strong backlog levels and an aftermarket mix (roughly 30%–40% of revenues for peer industrials) buffer near-term volatility, while regional PMI divergence lets IR rebalance its portfolio geographically.
Interest rates and financing costs
Higher interest rates—US Fed funds around 5.25–5.50% in mid-2025—increase customer hurdle rates and commonly defer large equipment purchases. IR’s WACC and M&A capacity are rate-sensitive, tightening deal activity and valuation multiples. Offering financing or outcome-based contracts mitigates customer capex constraints. Rate cuts usually unlock substantial deferred demand.
Commodity and logistics costs
Rising steel and aluminum input costs and surging rare-earth prices in 2024-25, together with freight volatility—reflected in container surcharges often ranging 5-12%—compressed OEM margins. Dynamic pricing and fuel/peak surcharges helped recover inflationary pressure, stabilizing gross margins. Dual-sourcing and localized inventories cut disruption exposure, while design-to-cost and material substitution improved unit economics, often trimming 2-5% of BOM cost.
Currency fluctuations
- FX scale: BIS 7.5T daily
- Natural hedge: local costs lower translation risk
- Financial hedge: forwards/options stabilize EPS
- Pricing discipline: required for volatile EM currencies
M&A and portfolio optimization
Industry fragmentation in vacuum, blowers and services creates tuck-in targets that typically boost consolidated EBITDA margins by 100–300 bps and unlock channel leverage and shared components for 5–15% cost synergies; private-equity and strategic buyers timed deals around 2024 multiples (~7–11x EBITDA) as macro shifts compressed values.
- tuck-in targets: niche vacuum/blower/service firms
- synergies: channel leverage, shared components, 5–15% cost saves
- EBITDA uplift: +100–300 bps
- 2024 multiples: ~7–11x EBITDA
- pruning: focus on non-core divestitures to sharpen ROIC
Tariffs ≤ 25%, sanctions force reshoring vs $369B
IR revenue tracks global PMI (~50 H1 2025); capex ups lift new-equipment while downturns boost aftermarket (30–40% rev). Higher rates (Fed 5.25–5.50% mid-2025) raise customer hurdles and tighten WACC/M&A; financing mitigates. Input inflation (steel/aluminum +8–15% 2024–25; container surcharges 5–12%) squeezed margins; hedging and pricing restored most losses.
| Metric | Value |
|---|---|
| Global PMI | ~50 (H1 2025) |
| Fed funds | 5.25–5.50% (mid‑2025) |
| Aftermarket | 30–40% rev |
| Input inflation | steel/alum +8–15% (24–25) |
| Container surcharges | 5–12% |
| FX turnover (BIS) | USD 7.5T daily (2022) |
| 2024 M&A multiples | ~7–11x EBITDA |
Preview the Actual Deliverable
IR PESTLE Analysis
The preview shown here is the exact IR PESTLE Analysis document you’ll receive after purchase — fully formatted, professionally structured, and ready to use. This is the real file, not a teaser or placeholder, so the content and layout you see are what you’ll download. After checkout you’ll instantly get this same finished document with no surprises.











