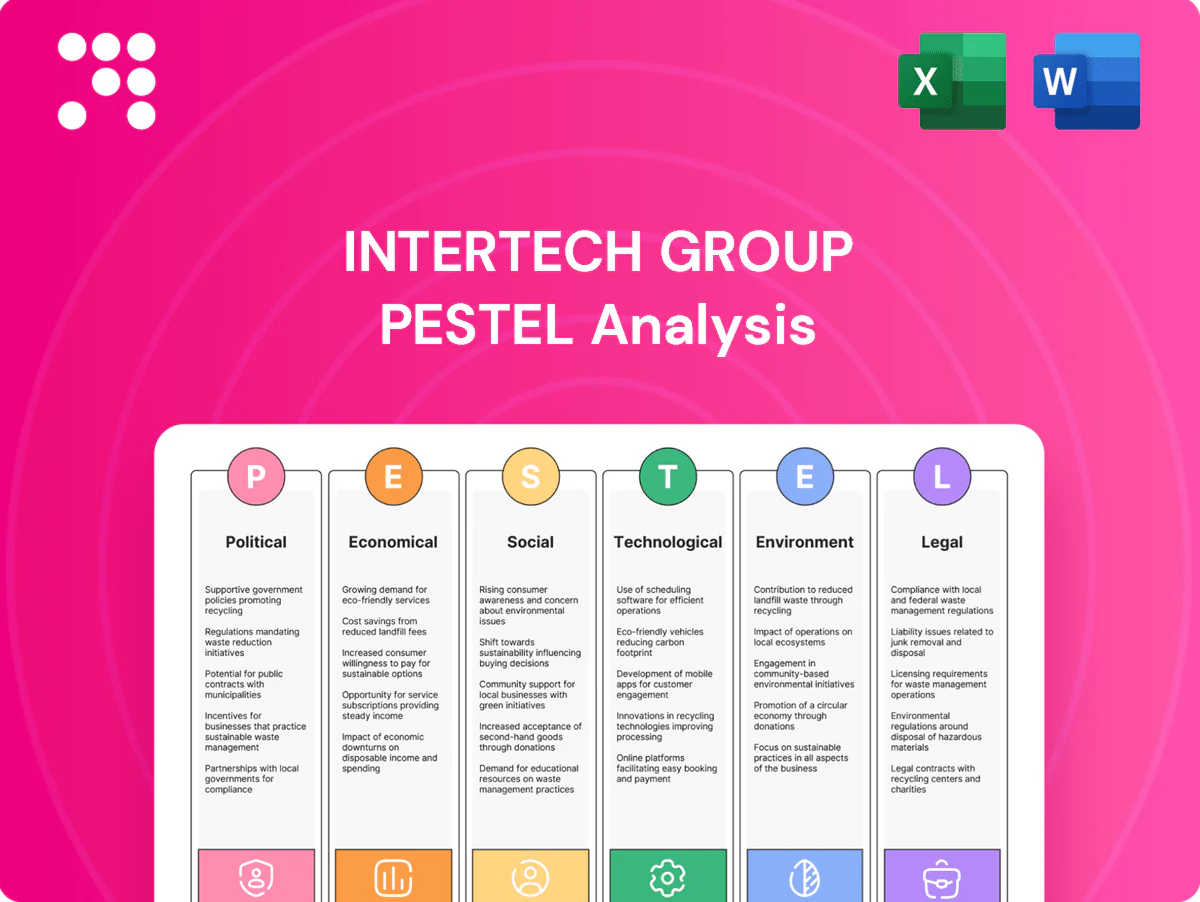
InterTech Group PESTLE Analysis

Your Shortcut to Market Insight Starts Here
Unlock actionable insight with our PESTLE analysis of InterTech Group—three to five external forces distilled into strategic implications you can use today. Understand how political shifts, economic trends, social dynamics, technology disruption, legal changes, and environmental pressures shape risk and opportunity. Buy the full report for the complete, editable breakdown and immediately strengthen your investment thesis or strategic plan.
Political factors

Trade and tariffs
Shifts in trade policy and tariffs—notably US Section 301 measures covering around 370 billion dollars of Chinese goods—directly affect InterTech’s input costs and market access for chemicals and materials. Tariff volatility can compress margins or force costly supply‑chain rerouting; hedging exposures and diversifying sourcing reduce this risk. Active policy monitoring enables proactive pricing and procurement adjustments to protect margins.
Industrial policy incentives
Industrial policy incentives such as the US CHIPS and Science Act's $52 billion and the Inflation Reduction Act's roughly $369 billion in climate and energy investments can materially boost project IRRs. Portfolio companies can tap federal grants and tax credits to fund process upgrades and R&D, with programs allocating billions annually. Aligning roadmaps to national priorities unlocks co-investment and concessional financing. Rigorous policy compliance and ESG reporting are essential to secure and retain incentives.

Geopolitical risk
Conflicts and sanctions disrupt commodity flows and logistics, with sanctions from 50+ jurisdictions by 2024 targeting energy and tech sectors and forcing route diversions and higher freight volatility. Dual‑use materials increasingly face export controls, raising compliance costs and delaying shipments. Scenario planning and multi‑region capacity reduce downtime and preserve revenue continuity. Insurance and tightened contractual protections mitigate counterparty and payment risk.

Regulatory regime shifts
Regulatory regime shifts—notably ongoing REACH revisions and intensified PFAS scrutiny through 2024—reshape chemical approvals and consumer-product standards, forcing product roadmaps to change; faster cycles demand agile compliance, centralized regulatory intelligence across InterTech holdings, and early regulator engagement to lower approval risk.
- Action: centralize regulatory intelligence
- Benefit: reduce approval delays
- Priority: engage regulators early
FDI and review bodies
National-security FDI reviews can materially delay cross-border deals; OECD notes 60+ screening regimes as of 2024. CFIUS-like scrutiny explicitly covers advanced materials and data-rich assets, making tech and IP-intensive targets higher risk. Thoughtful deal structuring and mitigation agreements preserve transaction certainty, while pre-filing strategies commonly accelerate timelines.
- Delays: national-security reviews
- Scope: advanced materials, data-rich assets
- Mitigation: preserves certainty
- Pre-filing: shortens review timelines
Centralize regulatory intel to protect margins amid tariffs, subsidies, sanctions
Trade tariffs (US Section 301 ~$370B) and tariff volatility raise input costs and force sourcing shifts; industrial policies (CHIPS $52B, IRA ~$369B) unlock grant/tax credit opportunities; sanctions (50+ jurisdictions by 2024) and 60+ FDI screening regimes delay deals and raise compliance costs. Centralize regulatory intelligence and pre‑filing to protect margins and transactability.
| Political Factor | 2024/25 Metric |
|---|---|
| US Section 301 | $~370B goods |
| CHIPS / IRA | $52B / ~$369B |
| Sanctions regimes | 50+ jurisdictions |
| FDI screening | 60+ regimes |
What is included in the product
 Detailed Word Document
Provides a concise PESTLE evaluation of InterTech Group, detailing Political, Economic, Social, Technological, Environmental and Legal drivers with data-backed trends and region-specific regulatory insights; designed for executives and advisors to identify strategic threats, opportunities and forward-looking scenarios ready for reports or pitch decks.

 Customizable Excel Spreadsheet
Provides a clean, editable PESTLE summary of InterTech Group that’s visually segmented for quick interpretation, easily drop‑in for presentations or strategy sessions and shareable across teams to speed alignment on external risks and market positioning.
Economic factors

Interest rate cycles
Elevated policy rates—US fed funds around 5.25–5.50% and 10-year Treasury near 4.0–4.5% in mid-2025—raise acquisition financing costs and can compress valuation multiples, shifting buyer preference from leverage to cash-flow-based pricing. Higher rates favor operational value creation over leverage, reducing reliance on LBO structures. InterTech should stagger maturities, increase use of fixed-rate instruments and run stress tests assuming 200–300 bps tighter credit conditions.
Commodity price volatility
Petrochemical, energy and feedstock swings directly lift InterTech Group COGS—Brent crude averaged about $86/barrel in 2024, driving naphtha and LPG feedstock volatility that pressured margins by as much as 15–20% in 2024. Dynamic pricing and formula-based contracts have stabilized selling margins by linking prices to feedstock indices. Active hedging and inventory optimization reduced raw-material exposure and cash-flow volatility. Vertical integration secures critical inputs and lowers procurement risk.

Global demand cycles
Industrial and consumer end-markets remain cyclical, with the global manufacturing PMI dipping below 50 in 2024 indicating mild contraction. Counter-cyclical capital deployment can capture attractive entry points as valuations reset. Diversification across sectors cushions revenue and margin volatility during downturns. Leading indicators such as PMIs and inventory-to-sales ratios guide capacity and working capital plans.

FX fluctuations
- Tag: translation risk
- Tag: transaction risk
- Tag: natural hedges
- Tag: hedging programs
- Tag: local pricing
- Tag: standardized FX limits
Labor and productivity
Tight labor markets (US unemployment ~3.7% in 2024; average hourly earnings up ~4.1% y/y) are raising wage costs and turnover for InterTech, increasing recruitment and retention spend; lean, automation, and targeted training have demonstrably improved throughput and unit labor productivity in manufacturing settings. Shared services and HT automation can cut SG&A by reducing duplicate functions; incentive plans linking cash and quality metrics align teams to throughput and margin goals.
- Labor tightness: US unemployment 3.7% (2024)
- Wage pressure: AHE +4.1% (2024)
- SG&A leverage: shared services reduce duplicative costs
- Incentives: tie rewards to cash and quality KPIs
Centralize regulatory intel to protect margins amid tariffs, subsidies, sanctions
Higher policy rates (fed funds ~5.25–5.50% mid‑2025) raise financing costs, shifting value to cash‑flow generation; Brent averaged ~$86/bbl in 2024, driving feedstock COGS volatility; global manufacturing PMI dipped below 50 in 2024, signaling softness; FX and tight labor (US unemployment ~3.7%, AHE +4.1% y/y) pressure margins, prompting hedging and automation.
| Metric | 2024/2025 |
|---|---|
| Fed funds | 5.25–5.50% |
| Brent | $86/bbl (2024) |
| Manufacturing PMI | <50 (2024) |
| US unemployment / AHE | 3.7% / +4.1% |
Preview Before You Purchase
InterTech Group PESTLE Analysis
The InterTech Group PESTLE Analysis shown here is the exact document you’ll receive after purchase—fully formatted and ready to use. This preview displays the same content, structure, and professional layout you’ll download immediately after payment. No placeholders or teasers—what you see is the final, ready-to-use file for your strategic and market planning.

Original: $10.00
-65%$10.00
$3.50Product Information
Product Information
Shipping & Returns
Shipping & Returns
Description
Your Shortcut to Market Insight Starts Here
Unlock actionable insight with our PESTLE analysis of InterTech Group—three to five external forces distilled into strategic implications you can use today. Understand how political shifts, economic trends, social dynamics, technology disruption, legal changes, and environmental pressures shape risk and opportunity. Buy the full report for the complete, editable breakdown and immediately strengthen your investment thesis or strategic plan.
Political factors
Trade and tariffs
Shifts in trade policy and tariffs—notably US Section 301 measures covering around 370 billion dollars of Chinese goods—directly affect InterTech’s input costs and market access for chemicals and materials. Tariff volatility can compress margins or force costly supply‑chain rerouting; hedging exposures and diversifying sourcing reduce this risk. Active policy monitoring enables proactive pricing and procurement adjustments to protect margins.
Industrial policy incentives
Industrial policy incentives such as the US CHIPS and Science Act's $52 billion and the Inflation Reduction Act's roughly $369 billion in climate and energy investments can materially boost project IRRs. Portfolio companies can tap federal grants and tax credits to fund process upgrades and R&D, with programs allocating billions annually. Aligning roadmaps to national priorities unlocks co-investment and concessional financing. Rigorous policy compliance and ESG reporting are essential to secure and retain incentives.
Geopolitical risk
Conflicts and sanctions disrupt commodity flows and logistics, with sanctions from 50+ jurisdictions by 2024 targeting energy and tech sectors and forcing route diversions and higher freight volatility. Dual‑use materials increasingly face export controls, raising compliance costs and delaying shipments. Scenario planning and multi‑region capacity reduce downtime and preserve revenue continuity. Insurance and tightened contractual protections mitigate counterparty and payment risk.
Regulatory regime shifts
Regulatory regime shifts—notably ongoing REACH revisions and intensified PFAS scrutiny through 2024—reshape chemical approvals and consumer-product standards, forcing product roadmaps to change; faster cycles demand agile compliance, centralized regulatory intelligence across InterTech holdings, and early regulator engagement to lower approval risk.
- Action: centralize regulatory intelligence
- Benefit: reduce approval delays
- Priority: engage regulators early
FDI and review bodies
National-security FDI reviews can materially delay cross-border deals; OECD notes 60+ screening regimes as of 2024. CFIUS-like scrutiny explicitly covers advanced materials and data-rich assets, making tech and IP-intensive targets higher risk. Thoughtful deal structuring and mitigation agreements preserve transaction certainty, while pre-filing strategies commonly accelerate timelines.
- Delays: national-security reviews
- Scope: advanced materials, data-rich assets
- Mitigation: preserves certainty
- Pre-filing: shortens review timelines
Centralize regulatory intel to protect margins amid tariffs, subsidies, sanctions
Trade tariffs (US Section 301 ~$370B) and tariff volatility raise input costs and force sourcing shifts; industrial policies (CHIPS $52B, IRA ~$369B) unlock grant/tax credit opportunities; sanctions (50+ jurisdictions by 2024) and 60+ FDI screening regimes delay deals and raise compliance costs. Centralize regulatory intelligence and pre‑filing to protect margins and transactability.
| Political Factor | 2024/25 Metric |
|---|---|
| US Section 301 | $~370B goods |
| CHIPS / IRA | $52B / ~$369B |
| Sanctions regimes | 50+ jurisdictions |
| FDI screening | 60+ regimes |
What is included in the product
Detailed Word Document
Provides a concise PESTLE evaluation of InterTech Group, detailing Political, Economic, Social, Technological, Environmental and Legal drivers with data-backed trends and region-specific regulatory insights; designed for executives and advisors to identify strategic threats, opportunities and forward-looking scenarios ready for reports or pitch decks.
Customizable Excel Spreadsheet
Provides a clean, editable PESTLE summary of InterTech Group that’s visually segmented for quick interpretation, easily drop‑in for presentations or strategy sessions and shareable across teams to speed alignment on external risks and market positioning.
Economic factors
Interest rate cycles
Elevated policy rates—US fed funds around 5.25–5.50% and 10-year Treasury near 4.0–4.5% in mid-2025—raise acquisition financing costs and can compress valuation multiples, shifting buyer preference from leverage to cash-flow-based pricing. Higher rates favor operational value creation over leverage, reducing reliance on LBO structures. InterTech should stagger maturities, increase use of fixed-rate instruments and run stress tests assuming 200–300 bps tighter credit conditions.
Commodity price volatility
Petrochemical, energy and feedstock swings directly lift InterTech Group COGS—Brent crude averaged about $86/barrel in 2024, driving naphtha and LPG feedstock volatility that pressured margins by as much as 15–20% in 2024. Dynamic pricing and formula-based contracts have stabilized selling margins by linking prices to feedstock indices. Active hedging and inventory optimization reduced raw-material exposure and cash-flow volatility. Vertical integration secures critical inputs and lowers procurement risk.
Global demand cycles
Industrial and consumer end-markets remain cyclical, with the global manufacturing PMI dipping below 50 in 2024 indicating mild contraction. Counter-cyclical capital deployment can capture attractive entry points as valuations reset. Diversification across sectors cushions revenue and margin volatility during downturns. Leading indicators such as PMIs and inventory-to-sales ratios guide capacity and working capital plans.
FX fluctuations
- Tag: translation risk
- Tag: transaction risk
- Tag: natural hedges
- Tag: hedging programs
- Tag: local pricing
- Tag: standardized FX limits
Labor and productivity
Tight labor markets (US unemployment ~3.7% in 2024; average hourly earnings up ~4.1% y/y) are raising wage costs and turnover for InterTech, increasing recruitment and retention spend; lean, automation, and targeted training have demonstrably improved throughput and unit labor productivity in manufacturing settings. Shared services and HT automation can cut SG&A by reducing duplicate functions; incentive plans linking cash and quality metrics align teams to throughput and margin goals.
- Labor tightness: US unemployment 3.7% (2024)
- Wage pressure: AHE +4.1% (2024)
- SG&A leverage: shared services reduce duplicative costs
- Incentives: tie rewards to cash and quality KPIs
Centralize regulatory intel to protect margins amid tariffs, subsidies, sanctions
Higher policy rates (fed funds ~5.25–5.50% mid‑2025) raise financing costs, shifting value to cash‑flow generation; Brent averaged ~$86/bbl in 2024, driving feedstock COGS volatility; global manufacturing PMI dipped below 50 in 2024, signaling softness; FX and tight labor (US unemployment ~3.7%, AHE +4.1% y/y) pressure margins, prompting hedging and automation.
| Metric | 2024/2025 |
|---|---|
| Fed funds | 5.25–5.50% |
| Brent | $86/bbl (2024) |
| Manufacturing PMI | <50 (2024) |
| US unemployment / AHE | 3.7% / +4.1% |
Preview Before You Purchase
InterTech Group PESTLE Analysis
The InterTech Group PESTLE Analysis shown here is the exact document you’ll receive after purchase—fully formatted and ready to use. This preview displays the same content, structure, and professional layout you’ll download immediately after payment. No placeholders or teasers—what you see is the final, ready-to-use file for your strategic and market planning.











