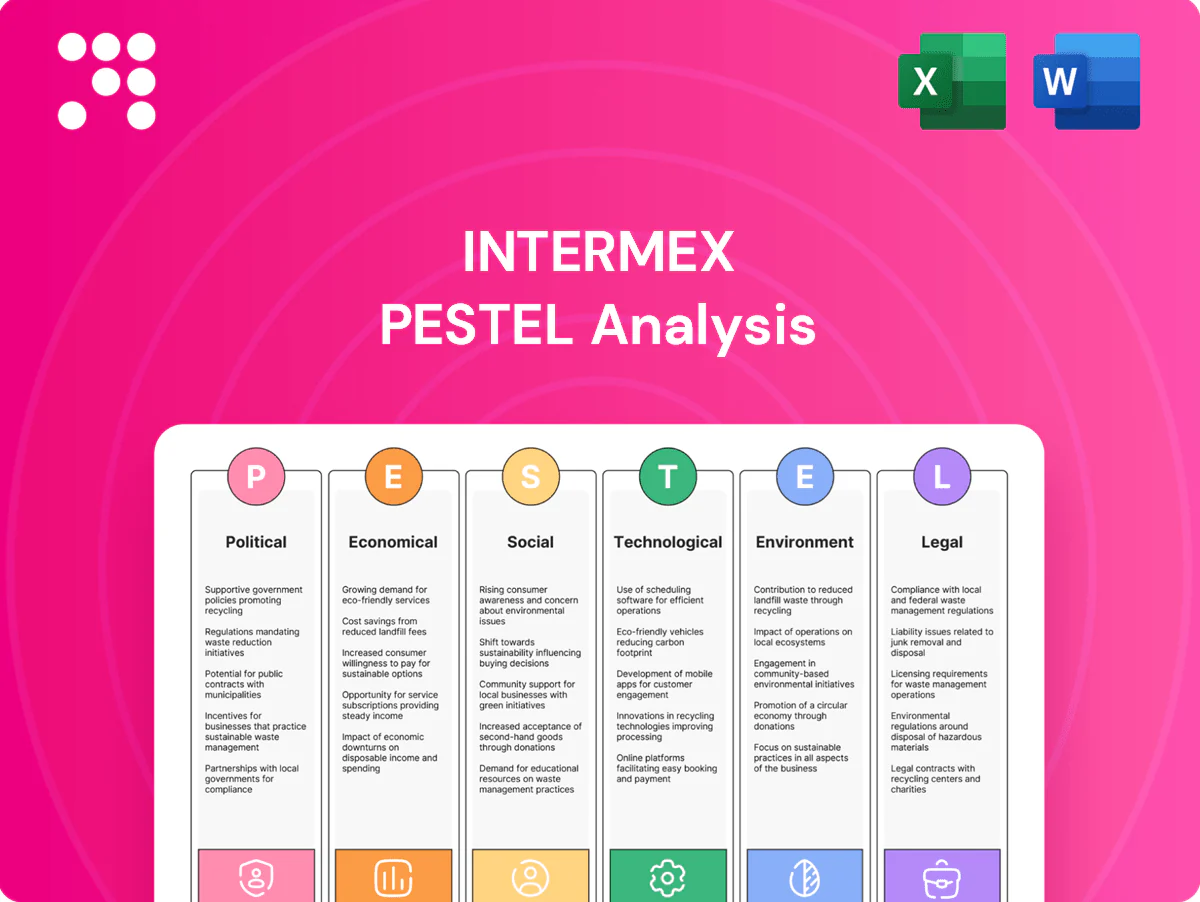
Intermex PESTLE Analysis

Your Competitive Advantage Starts with This Report
Unlock strategic clarity with our concise PESTLE Analysis of Intermex—three to five minutes of reading that reveals how political, economic, social, technological, legal, and environmental forces shape its prospects. Perfect for investors and strategists needing fast, actionable context. Purchase the full report to access detailed breakdowns, forecasts, and ready-to-use slides for immediate decision-making.
Political factors

US immigration and labor policy shifts
Changes in U.S. immigration enforcement and work authorization directly affect the size and income stability of Intermex’s core customer base, given the roughly 46 million foreign-born residents in the U.S. (Pew Research 2022). Expansions of temporary worker programs such as H-2A/H-2B (statutory H-2B cap 66,000) can boost transaction volumes, while crackdowns suppress them. Continuous monitoring of federal and state policy shifts enables proactive network and pricing adjustments, and active participation in advocacy and industry coalitions can mitigate adverse policy risk.
Cross-border diplomatic relations
Bilateral ties between the US and Latin America/Caribbean shape remittance corridors and banking partnerships, with US-Latin corridors moving over $100 billion annually (World Bank, 2023–24), directly affecting Intermex settlement flows. Improved diplomatic cooperation can streamline KYC/AML compliance and payments clearing, lowering reconciliation times and counterparty risk. Diplomatic tensions can trigger enhanced scrutiny, operational delays, and higher correspondent banking costs. Robust scenario planning preserves cross-border service continuity and liquidity across geographies.

Sanctions and geopolitics
OFAC and other sanctions regimes can restrict counterparties or entire corridors, forcing rapid compliance alignment to avoid penalties that often reach millions of dollars per violation. Geopolitical flare-ups, such as the Russia–Ukraine conflict, have triggered bank de-risking and partner exits, disrupting payout liquidity in dozens of corridors. Diversified payout networks reduce corridor-specific exposure and preserve service continuity.

Domestic politics in recipient countries
Elections, policy turnover and subsidy shifts in recipient countries can rapidly change FX controls and remittance rules, disrupting flows; World Bank estimated remittances to low- and middle-income countries at about $643 billion in 2024, increasing sensitivity to policy shifts. Political instability raises operational and security risks for agent locations, while stable regimes tend to favor formal channels and support growth.
- Country risk mapping guides resource and agent allocation
- FX rule changes driven by elections alter compliance costs
- Instability increases agent security and downtime risks
- Stable governance boosts formal channel adoption and volume
Public policy toward financial inclusion
Governments promoting digital wallets and broader bank account penetration expand Intermex's addressable market; GSMA reported over 1.5 billion mobile money accounts (2023) and World Bank Findex showed 76% of adults had an account (2021). Incentives for formal remittance channels—global remittances were $626bn in 2022—reduce cash reliance and leakage. Alignment with inclusion policy can secure partnerships and favorable regulatory treatment while demonstrated social impact strengthens stakeholder support.
- Market expansion: digital-wallet growth 1.5bn (GSMA 2023)
- Formal flows: remittances $626bn (World Bank 2022)
- Policy leverage: access to partnerships and incentives
- Stakeholder trust: social-impact metrics improve standing
Immigration policy and H-2 caps drive volatility in US-Latin remittance flows
U.S. immigration enforcement, H-2B/H-2A programs (H-2B cap 66,000) and federal/state policy shifts directly change Intermex’s customer base and transaction volumes. Bilateral US–Latin corridors move >$100bn/year (World Bank 2023–24) and remittances to LMICs reached ~$643bn (2024), heightening sensitivity to sanctions, FX controls and elections. Digital-wallet adoption (1.5bn mobile money accounts, GSMA 2023) expands formal channels but raises compliance demands.
| Metric | Value |
|---|---|
| US foreign-born | ~46M (Pew 2022) |
| US–Latin flows | >$100B (2023–24) |
| Remittances to LMICs | $643B (2024) |
| Mobile money accounts | 1.5B (GSMA 2023) |
What is included in the product
 Detailed Word Document
Explores how Political, Economic, Social, Technological, Environmental and Legal forces uniquely affect Intermex, with data-backed trends and region-specific regulatory context; designed for executives, consultants and investors to identify risks, opportunities and scenario-driven strategies, and delivered in clean, presentation-ready format for business plans and pitch decks.

 Customizable Excel Spreadsheet
A concise, visually segmented PESTLE summary tailored to Intermex that relieves briefing pain points by enabling quick interpretation, easy insertion into presentations, and editable notes for regional or business-line context to speed team alignment.
Economic factors

FX volatility and exchange spreads
USD–LATAM swings (USD–MXN ~16–20 in 2024; USD–BRL ~4.0–5.5 range 2023–24) heighten customer price sensitivity and compress margins. Intermex uses hedging and dynamic FX management to protect unit economics and limit corridor P&L volatility. Transparent posted rates and 100–300 bps exchange spreads during spikes help retain customer trust while corridor-level pricing agility preserves competitiveness.
Migrant employment and wages
Remittance volumes track U.S. service, construction and agriculture cycles; stronger hiring in those sectors boosts flows to Intermex’s corridors. U.S. unemployment fell to about 3.7% by year-end 2024, supporting higher disposable income and remittance frequency. Higher wages lift average ticket sizes, while recessions compress volumes and push customers to lower-fee channels. Ongoing labor-market monitoring refines Intermex marketing and capacity planning.

Inflation in recipient markets
Inflation in key recipient markets like Mexico and the Philippines remained elevated in 2024 (roughly 4–6%), boosting nominal remittance needs while squeezing senders’ real budgets. Customers may send more frequently in smaller amounts to smooth household cash flow, raising transaction volumes but lowering average ticket size. Intermex must balance fees to stay affordable; partnerships with payout agents can add FX or voucher services to preserve recipients’ purchasing power.

Interest rates and cost of capital
Rising rate cycles (Fed funds ~5.25–5.50% in mid‑2024) increase funding costs, compress Intermex's remittance margins and raise working capital needs for settlement rails. Higher rates can slow tech and geographic expansion as ROIC hurdles rise. Efficient treasury and faster settlement cycles reduce float; stable credit access preserves resilience during downturns.
- Higher funding costs → margin compression
- Working capital & liquidity buffers grow
- Faster settlements lower float needs
- Stable credit lines enable downturn resilience
Competitive pricing and digital disruption
Fintech entrants and big-tech wallets intensify fee pressure across corridors as global remittances hit $626B in 2023 and average transfer costs were 6.2% in Q1 2024. Intermex must differentiate via speed, reliability and customer service while leveraging scale economies and dense agent networks to protect unit costs and keep fees low through continuous cost optimization.
- Remittances: $626B (2023)
- Avg cost: 6.2% (Q1 2024)
- Focus: speed, reliability, agent density
Immigration policy and H-2 caps drive volatility in US-Latin remittance flows
USD–LATAM FX volatility (USD–MXN ~16–20 in 2024; USD–BRL ~4–5.5) raises price sensitivity and compresses margins, countered by hedging and dynamic pricing. Remittances ($626B in 2023) scale with US labor strength (unemployment ~3.7% end‑2024), boosting volumes and ticket sizes. Higher inflation (MX/PH ~4–6% in 2024) and Fed rates (~5.25–5.50% mid‑2024) increase real needs and funding costs.
| Metric | Value |
|---|---|
| Global remittances | $626B (2023) |
| Avg transfer cost | 6.2% (Q1 2024) |
| USD–MXN | 16–20 (2024) |
| Fed funds | 5.25–5.50% (mid‑2024) |
Preview the Actual Deliverable
Intermex PESTLE Analysis
The Intermex PESTLE Analysis preview shown here is the exact, fully formatted document you’ll receive after purchase. It contains the complete political, economic, social, technological, legal, and environmental evaluation as presented. No placeholders or teasers—this is the ready-to-use final file.

Original: $10.00
-65%$10.00
$3.50Product Information
Product Information
Shipping & Returns
Shipping & Returns
Description
Your Competitive Advantage Starts with This Report
Unlock strategic clarity with our concise PESTLE Analysis of Intermex—three to five minutes of reading that reveals how political, economic, social, technological, legal, and environmental forces shape its prospects. Perfect for investors and strategists needing fast, actionable context. Purchase the full report to access detailed breakdowns, forecasts, and ready-to-use slides for immediate decision-making.
Political factors
US immigration and labor policy shifts
Changes in U.S. immigration enforcement and work authorization directly affect the size and income stability of Intermex’s core customer base, given the roughly 46 million foreign-born residents in the U.S. (Pew Research 2022). Expansions of temporary worker programs such as H-2A/H-2B (statutory H-2B cap 66,000) can boost transaction volumes, while crackdowns suppress them. Continuous monitoring of federal and state policy shifts enables proactive network and pricing adjustments, and active participation in advocacy and industry coalitions can mitigate adverse policy risk.
Cross-border diplomatic relations
Bilateral ties between the US and Latin America/Caribbean shape remittance corridors and banking partnerships, with US-Latin corridors moving over $100 billion annually (World Bank, 2023–24), directly affecting Intermex settlement flows. Improved diplomatic cooperation can streamline KYC/AML compliance and payments clearing, lowering reconciliation times and counterparty risk. Diplomatic tensions can trigger enhanced scrutiny, operational delays, and higher correspondent banking costs. Robust scenario planning preserves cross-border service continuity and liquidity across geographies.
Sanctions and geopolitics
OFAC and other sanctions regimes can restrict counterparties or entire corridors, forcing rapid compliance alignment to avoid penalties that often reach millions of dollars per violation. Geopolitical flare-ups, such as the Russia–Ukraine conflict, have triggered bank de-risking and partner exits, disrupting payout liquidity in dozens of corridors. Diversified payout networks reduce corridor-specific exposure and preserve service continuity.
Domestic politics in recipient countries
Elections, policy turnover and subsidy shifts in recipient countries can rapidly change FX controls and remittance rules, disrupting flows; World Bank estimated remittances to low- and middle-income countries at about $643 billion in 2024, increasing sensitivity to policy shifts. Political instability raises operational and security risks for agent locations, while stable regimes tend to favor formal channels and support growth.
- Country risk mapping guides resource and agent allocation
- FX rule changes driven by elections alter compliance costs
- Instability increases agent security and downtime risks
- Stable governance boosts formal channel adoption and volume
Public policy toward financial inclusion
Governments promoting digital wallets and broader bank account penetration expand Intermex's addressable market; GSMA reported over 1.5 billion mobile money accounts (2023) and World Bank Findex showed 76% of adults had an account (2021). Incentives for formal remittance channels—global remittances were $626bn in 2022—reduce cash reliance and leakage. Alignment with inclusion policy can secure partnerships and favorable regulatory treatment while demonstrated social impact strengthens stakeholder support.
- Market expansion: digital-wallet growth 1.5bn (GSMA 2023)
- Formal flows: remittances $626bn (World Bank 2022)
- Policy leverage: access to partnerships and incentives
- Stakeholder trust: social-impact metrics improve standing
Immigration policy and H-2 caps drive volatility in US-Latin remittance flows
U.S. immigration enforcement, H-2B/H-2A programs (H-2B cap 66,000) and federal/state policy shifts directly change Intermex’s customer base and transaction volumes. Bilateral US–Latin corridors move >$100bn/year (World Bank 2023–24) and remittances to LMICs reached ~$643bn (2024), heightening sensitivity to sanctions, FX controls and elections. Digital-wallet adoption (1.5bn mobile money accounts, GSMA 2023) expands formal channels but raises compliance demands.
| Metric | Value |
|---|---|
| US foreign-born | ~46M (Pew 2022) |
| US–Latin flows | >$100B (2023–24) |
| Remittances to LMICs | $643B (2024) |
| Mobile money accounts | 1.5B (GSMA 2023) |
What is included in the product
Detailed Word Document
Explores how Political, Economic, Social, Technological, Environmental and Legal forces uniquely affect Intermex, with data-backed trends and region-specific regulatory context; designed for executives, consultants and investors to identify risks, opportunities and scenario-driven strategies, and delivered in clean, presentation-ready format for business plans and pitch decks.
Customizable Excel Spreadsheet
A concise, visually segmented PESTLE summary tailored to Intermex that relieves briefing pain points by enabling quick interpretation, easy insertion into presentations, and editable notes for regional or business-line context to speed team alignment.
Economic factors
FX volatility and exchange spreads
USD–LATAM swings (USD–MXN ~16–20 in 2024; USD–BRL ~4.0–5.5 range 2023–24) heighten customer price sensitivity and compress margins. Intermex uses hedging and dynamic FX management to protect unit economics and limit corridor P&L volatility. Transparent posted rates and 100–300 bps exchange spreads during spikes help retain customer trust while corridor-level pricing agility preserves competitiveness.
Migrant employment and wages
Remittance volumes track U.S. service, construction and agriculture cycles; stronger hiring in those sectors boosts flows to Intermex’s corridors. U.S. unemployment fell to about 3.7% by year-end 2024, supporting higher disposable income and remittance frequency. Higher wages lift average ticket sizes, while recessions compress volumes and push customers to lower-fee channels. Ongoing labor-market monitoring refines Intermex marketing and capacity planning.
Inflation in recipient markets
Inflation in key recipient markets like Mexico and the Philippines remained elevated in 2024 (roughly 4–6%), boosting nominal remittance needs while squeezing senders’ real budgets. Customers may send more frequently in smaller amounts to smooth household cash flow, raising transaction volumes but lowering average ticket size. Intermex must balance fees to stay affordable; partnerships with payout agents can add FX or voucher services to preserve recipients’ purchasing power.
Interest rates and cost of capital
Rising rate cycles (Fed funds ~5.25–5.50% in mid‑2024) increase funding costs, compress Intermex's remittance margins and raise working capital needs for settlement rails. Higher rates can slow tech and geographic expansion as ROIC hurdles rise. Efficient treasury and faster settlement cycles reduce float; stable credit access preserves resilience during downturns.
- Higher funding costs → margin compression
- Working capital & liquidity buffers grow
- Faster settlements lower float needs
- Stable credit lines enable downturn resilience
Competitive pricing and digital disruption
Fintech entrants and big-tech wallets intensify fee pressure across corridors as global remittances hit $626B in 2023 and average transfer costs were 6.2% in Q1 2024. Intermex must differentiate via speed, reliability and customer service while leveraging scale economies and dense agent networks to protect unit costs and keep fees low through continuous cost optimization.
- Remittances: $626B (2023)
- Avg cost: 6.2% (Q1 2024)
- Focus: speed, reliability, agent density
Immigration policy and H-2 caps drive volatility in US-Latin remittance flows
USD–LATAM FX volatility (USD–MXN ~16–20 in 2024; USD–BRL ~4–5.5) raises price sensitivity and compresses margins, countered by hedging and dynamic pricing. Remittances ($626B in 2023) scale with US labor strength (unemployment ~3.7% end‑2024), boosting volumes and ticket sizes. Higher inflation (MX/PH ~4–6% in 2024) and Fed rates (~5.25–5.50% mid‑2024) increase real needs and funding costs.
| Metric | Value |
|---|---|
| Global remittances | $626B (2023) |
| Avg transfer cost | 6.2% (Q1 2024) |
| USD–MXN | 16–20 (2024) |
| Fed funds | 5.25–5.50% (mid‑2024) |
Preview the Actual Deliverable
Intermex PESTLE Analysis
The Intermex PESTLE Analysis preview shown here is the exact, fully formatted document you’ll receive after purchase. It contains the complete political, economic, social, technological, legal, and environmental evaluation as presented. No placeholders or teasers—this is the ready-to-use final file.











