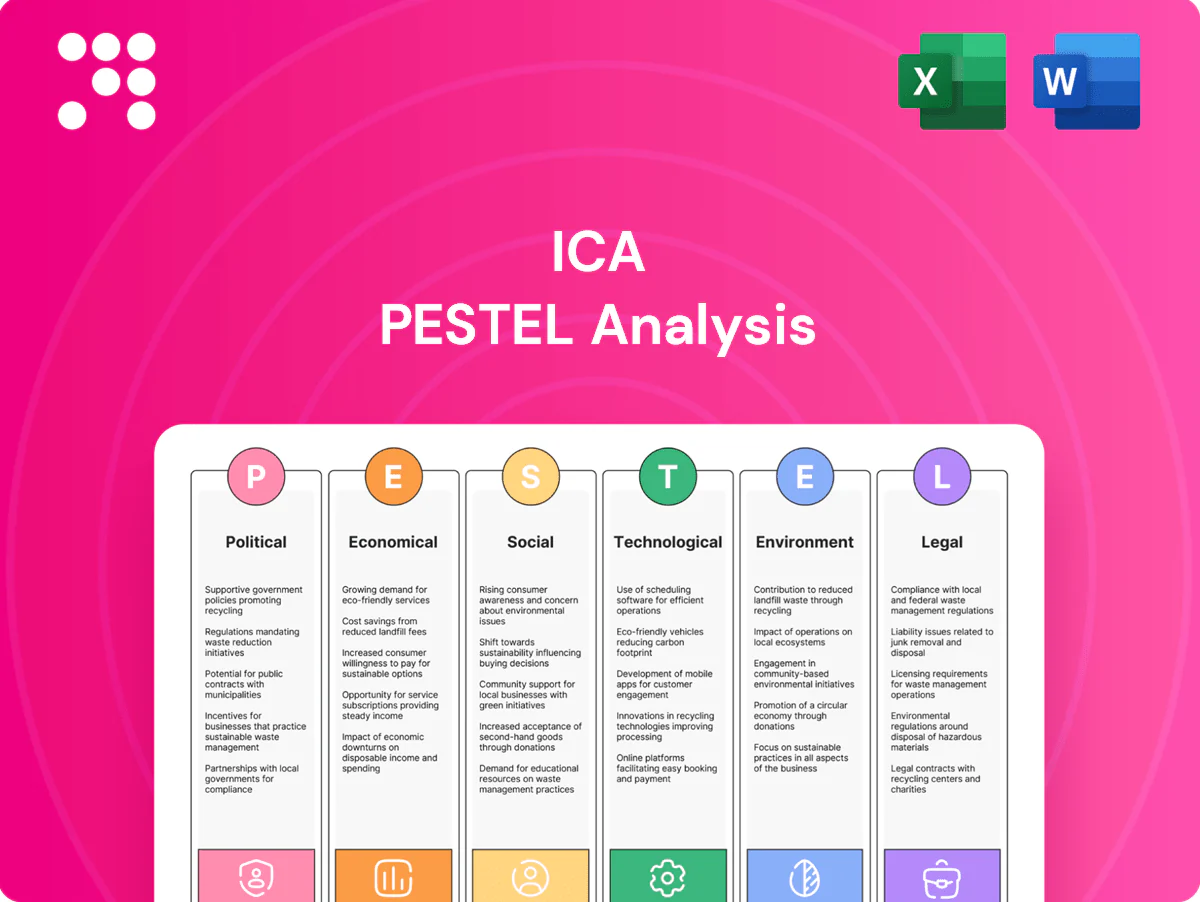
ICA PESTLE Analysis

Your Competitive Advantage Starts with This Report
Unlock how political shifts, economic trends, and tech disruption are reshaping ICA’s strategic landscape with our concise PESTLE snapshot—ideal for investors and planners. For the full, actionable breakdown and editable charts, purchase the complete PESTLE now and make faster, smarter decisions.
Political factors

Public infrastructure priorities
Shifts in federal and state priorities directly drive ICA’s highway, rail, water and energy pipelines. Post-election policy changes can re-sequence or cancel projects, disrupting backlog and resource allocation. Active alignment with National Infrastructure Programs—notably the IIJA’s $1.2 trillion package including $550 billion in new spending—and state investment plans reduces volatility and sharpens bid targeting. Stakeholder mapping across ministries and state secretariats is essential for predictable delivery.
PPP and concession policy
Regulatory stance toward public–private partnerships dictates concession flow, risk allocation, and expected returns, and global infrastructure shortfalls—McKinsey estimates a roughly 15 trillion dollar gap to 2040—heighten demand for bankable PPPs. Clear frameworks on availability payments, toll indexation, and revenue guarantees are decisive for project bankability. ICA’s integrated concession plus O&M model benefits from stable PPP rules and transparent tendering. Policy tightening or moratoria would compress the pipeline and raise financing costs.

Procurement transparency and anti-corruption
Strengthened procurement oversight raises compliance burdens for ICA, increasing documentation and third‑party due diligence but improving competitive fairness. Enhanced disclosure, higher audit intensity and expanded blacklist regimes—in a public procurement market that OECD estimates at about 12% of GDP—force more selective bidding and JV selection. Robust integrity systems are now prerequisites for large tenders; past controversies have amplified scrutiny, making governance performance a clear differentiator.

Federal–state coordination
Project execution often hinges on multi-level approvals, right-of-way and matching funds; the Bipartisan Infrastructure Law (2021) allocates about 550 billion USD in new spending, intensifying federal–state coordination needs. Misalignment between agencies and states delays mobilization and payments; building local coalitions eases permit bottlenecks. Regional political stability affects site security and schedule reliability.
- Multi-level approvals: common cause of delays
- Matching funds: local fiscal capacity critical
- Coalitions reduce permitting time
- Stability influences schedule risk
Security and public order
Construction corridors face elevated security risks that can drive cost overruns and delays; major infrastructure studies report average cost overruns near 28% for large projects, with security incidents a frequent driver of schedule slippage.
Government security cooperation and targeted social programs have reduced incidents in project zones, lowering incident rates and stabilizing timelines when coordinated with implementers.
Where extortion or theft risk is elevated, risk-adjusted bids and political violence/asset insurance are standard; community engagement programs further reduce tensions and protect assets, cutting local incident rates in documented cases.
- Cost overrun: ~28% (major infrastructure studies)
- Mitigation: security cooperation + social programs reduce incidents
- Finance: risk-adjusted bids and insurance required in high-risk corridors
- Community: engagement lowers tensions and asset loss
Policy shifts reshape projects: 15T USD, ~28% overruns
Federal and state policy shifts (IIJA 1.2T USD; 550B new) re-sequence ICA’s pipeline, making alignment with national/state programs essential. PPP frameworks, availability payments and guarantees determine bankability amid a McKinsey-estimated 15T USD infra gap to 2040. Procurement tightening (OECD: public procurement ~12% GDP) and security-driven cost overruns (~28%) raise compliance and financing costs.
| Metric | Value |
|---|---|
| IIJA | 1.2T USD (550B new) |
| Infra gap | 15T USD to 2040 |
| Procurement % GDP | ~12% |
| Avg cost overrun | ~28% |
What is included in the product
 Detailed Word Document
Explores how external macro-environmental factors uniquely affect the ICA across six dimensions—Political, Economic, Social, Technological, Environmental, and Legal—backed by current data and forward-looking insights to inform scenario planning, highlight threats and opportunities, and support executives, consultants, and investors with ready-to-use analysis for strategy, funding, and reporting.

 Customizable Excel Spreadsheet
ICA PESTLE Analysis condenses external factors into a clear, category-segmented summary for quick reference in meetings or presentations, enabling teams to align on risks and opportunities rapidly and adapt strategy with minimal preparation.
Economic factors

GDP cycle and fiscal space
Infrastructure outlays typically move with GDP and tax receipts, so IMF-projected global growth of 3.3% in 2025 and 3.0% in 2024 influence capex and deficit limits; slowdowns defer projects and lengthen receivable cycles, while expansions unlock megaprojects. ICA’s sectoral and regional diversification can smooth this cyclicality, and countercyclical public investment programs—many countries running deficits of about 3–5% of GDP in 2024—partially buffer demand swings.
Interest rates and FX (MXN/USD)
Rising real rates—Banxico policy at 11.25% (mid‑2025) and global yields near Fed funds ~5.25%—lift WACC and compress concession valuations, while USD/MXN around 17.5 increases costs for imported inputs and USD‑denominated debt servicing. Active hedging and local‑currency financing materially reduce volatility; tolls indexed to inflation or FX provide partial revenue offsets. Tender bids must embed macro scenarios, FX sensitivities and explicit contingencies.

Input cost inflation
Input-cost inflation from cement (+7% YoY 2024), steel rebar volatility (~±12% 2024–H1 2025), fuel (Brent ~85 USD/bbl in H1 2025) and asphalt (+9% YoY 2024) compresses margins on ICA projects. Escalation clauses and indexed contracts have become critical for multi-year builds to transfer price risk. Strategic procurement, long-term supplier partnerships and inventory hedging secure availability and price. Rigorous value engineering reduces cost creep while maintaining spec and quality.

Nearshoring and industrial demand
Nearshoring to Mexico—driving US‑Mexico goods trade above $700 billion in 2023—is lifting demand for industrial parks, logistics corridors, power and water infrastructure; ICA can secure EPC and concession projects in emerging manufacturing clusters.
Timely grid and substation buildouts are pivotal to enable tenants, and coordinated planning with developers accelerates asset turnover and revenue realization.
- Opportunity: EPC/concessions in growth clusters
- Need: rapid grid/substation deployment
- Strategy: developer coordination to boost throughput
Capital markets and liquidity
Capital markets and liquidity drive ICA deal flow: project finance depth and bank appetites tighten as policy rates rose (US funds rate 5.25–5.50% in 2024), pushing larger equity checks and delaying financial close, while development bank support partially offsets gaps. Asset recycling and securitisations (growing in 2024) free capital; stronger backlog conversion boosts cash generation and improves leverage.
- Project finance constrained by higher rates
- Tight liquidity raises equity tickets
- DBs and asset recycling free capital
- Backlog conversion strengthens leverage
Policy shifts reshape projects: 15T USD, ~28% overruns
Global growth ~3.3% (IMF 2025) and nearshoring (US‑Mexico trade >$700bn 2023) drive EPC/concession demand; public deficits ~3–5% GDP (2024) support capex. Real rates high (Banxico 11.25% mid‑2025; Fed ~5.25–5.50%) raise WACC and financing costs; USD/MXN ~17.5 lifts FX exposure. Input inflation (cement +7% 2024; rebar ±12% 2024–H1‑25; Brent ~85 USD/bbl H1‑25) compresses margins.
| Metric | Value |
|---|---|
| IMF GDP 2025 | 3.3% |
| Banxico (mid‑2025) | 11.25% |
| USD/MXN | ~17.5 |
| Brent H1‑25 | ~85 USD/bbl |
What You See Is What You Get
ICA PESTLE Analysis
The preview shown here is the exact ICA PESTLE Analysis document you’ll receive after purchase—fully formatted, professionally structured, and ready to use. The content, layout, and headings visible in this screenshot are identical to the downloadable file delivered immediately after payment. No placeholders or teasers—what you see is the finished product you’ll own.

Original: $10.00
-65%$10.00
$3.50Product Information
Product Information
Shipping & Returns
Shipping & Returns
Description
Your Competitive Advantage Starts with This Report
Unlock how political shifts, economic trends, and tech disruption are reshaping ICA’s strategic landscape with our concise PESTLE snapshot—ideal for investors and planners. For the full, actionable breakdown and editable charts, purchase the complete PESTLE now and make faster, smarter decisions.
Political factors
Public infrastructure priorities
Shifts in federal and state priorities directly drive ICA’s highway, rail, water and energy pipelines. Post-election policy changes can re-sequence or cancel projects, disrupting backlog and resource allocation. Active alignment with National Infrastructure Programs—notably the IIJA’s $1.2 trillion package including $550 billion in new spending—and state investment plans reduces volatility and sharpens bid targeting. Stakeholder mapping across ministries and state secretariats is essential for predictable delivery.
PPP and concession policy
Regulatory stance toward public–private partnerships dictates concession flow, risk allocation, and expected returns, and global infrastructure shortfalls—McKinsey estimates a roughly 15 trillion dollar gap to 2040—heighten demand for bankable PPPs. Clear frameworks on availability payments, toll indexation, and revenue guarantees are decisive for project bankability. ICA’s integrated concession plus O&M model benefits from stable PPP rules and transparent tendering. Policy tightening or moratoria would compress the pipeline and raise financing costs.
Procurement transparency and anti-corruption
Strengthened procurement oversight raises compliance burdens for ICA, increasing documentation and third‑party due diligence but improving competitive fairness. Enhanced disclosure, higher audit intensity and expanded blacklist regimes—in a public procurement market that OECD estimates at about 12% of GDP—force more selective bidding and JV selection. Robust integrity systems are now prerequisites for large tenders; past controversies have amplified scrutiny, making governance performance a clear differentiator.
Federal–state coordination
Project execution often hinges on multi-level approvals, right-of-way and matching funds; the Bipartisan Infrastructure Law (2021) allocates about 550 billion USD in new spending, intensifying federal–state coordination needs. Misalignment between agencies and states delays mobilization and payments; building local coalitions eases permit bottlenecks. Regional political stability affects site security and schedule reliability.
- Multi-level approvals: common cause of delays
- Matching funds: local fiscal capacity critical
- Coalitions reduce permitting time
- Stability influences schedule risk
Security and public order
Construction corridors face elevated security risks that can drive cost overruns and delays; major infrastructure studies report average cost overruns near 28% for large projects, with security incidents a frequent driver of schedule slippage.
Government security cooperation and targeted social programs have reduced incidents in project zones, lowering incident rates and stabilizing timelines when coordinated with implementers.
Where extortion or theft risk is elevated, risk-adjusted bids and political violence/asset insurance are standard; community engagement programs further reduce tensions and protect assets, cutting local incident rates in documented cases.
- Cost overrun: ~28% (major infrastructure studies)
- Mitigation: security cooperation + social programs reduce incidents
- Finance: risk-adjusted bids and insurance required in high-risk corridors
- Community: engagement lowers tensions and asset loss
Policy shifts reshape projects: 15T USD, ~28% overruns
Federal and state policy shifts (IIJA 1.2T USD; 550B new) re-sequence ICA’s pipeline, making alignment with national/state programs essential. PPP frameworks, availability payments and guarantees determine bankability amid a McKinsey-estimated 15T USD infra gap to 2040. Procurement tightening (OECD: public procurement ~12% GDP) and security-driven cost overruns (~28%) raise compliance and financing costs.
| Metric | Value |
|---|---|
| IIJA | 1.2T USD (550B new) |
| Infra gap | 15T USD to 2040 |
| Procurement % GDP | ~12% |
| Avg cost overrun | ~28% |
What is included in the product
Detailed Word Document
Explores how external macro-environmental factors uniquely affect the ICA across six dimensions—Political, Economic, Social, Technological, Environmental, and Legal—backed by current data and forward-looking insights to inform scenario planning, highlight threats and opportunities, and support executives, consultants, and investors with ready-to-use analysis for strategy, funding, and reporting.
Customizable Excel Spreadsheet
ICA PESTLE Analysis condenses external factors into a clear, category-segmented summary for quick reference in meetings or presentations, enabling teams to align on risks and opportunities rapidly and adapt strategy with minimal preparation.
Economic factors
GDP cycle and fiscal space
Infrastructure outlays typically move with GDP and tax receipts, so IMF-projected global growth of 3.3% in 2025 and 3.0% in 2024 influence capex and deficit limits; slowdowns defer projects and lengthen receivable cycles, while expansions unlock megaprojects. ICA’s sectoral and regional diversification can smooth this cyclicality, and countercyclical public investment programs—many countries running deficits of about 3–5% of GDP in 2024—partially buffer demand swings.
Interest rates and FX (MXN/USD)
Rising real rates—Banxico policy at 11.25% (mid‑2025) and global yields near Fed funds ~5.25%—lift WACC and compress concession valuations, while USD/MXN around 17.5 increases costs for imported inputs and USD‑denominated debt servicing. Active hedging and local‑currency financing materially reduce volatility; tolls indexed to inflation or FX provide partial revenue offsets. Tender bids must embed macro scenarios, FX sensitivities and explicit contingencies.
Input cost inflation
Input-cost inflation from cement (+7% YoY 2024), steel rebar volatility (~±12% 2024–H1 2025), fuel (Brent ~85 USD/bbl in H1 2025) and asphalt (+9% YoY 2024) compresses margins on ICA projects. Escalation clauses and indexed contracts have become critical for multi-year builds to transfer price risk. Strategic procurement, long-term supplier partnerships and inventory hedging secure availability and price. Rigorous value engineering reduces cost creep while maintaining spec and quality.
Nearshoring and industrial demand
Nearshoring to Mexico—driving US‑Mexico goods trade above $700 billion in 2023—is lifting demand for industrial parks, logistics corridors, power and water infrastructure; ICA can secure EPC and concession projects in emerging manufacturing clusters.
Timely grid and substation buildouts are pivotal to enable tenants, and coordinated planning with developers accelerates asset turnover and revenue realization.
- Opportunity: EPC/concessions in growth clusters
- Need: rapid grid/substation deployment
- Strategy: developer coordination to boost throughput
Capital markets and liquidity
Capital markets and liquidity drive ICA deal flow: project finance depth and bank appetites tighten as policy rates rose (US funds rate 5.25–5.50% in 2024), pushing larger equity checks and delaying financial close, while development bank support partially offsets gaps. Asset recycling and securitisations (growing in 2024) free capital; stronger backlog conversion boosts cash generation and improves leverage.
- Project finance constrained by higher rates
- Tight liquidity raises equity tickets
- DBs and asset recycling free capital
- Backlog conversion strengthens leverage
Policy shifts reshape projects: 15T USD, ~28% overruns
Global growth ~3.3% (IMF 2025) and nearshoring (US‑Mexico trade >$700bn 2023) drive EPC/concession demand; public deficits ~3–5% GDP (2024) support capex. Real rates high (Banxico 11.25% mid‑2025; Fed ~5.25–5.50%) raise WACC and financing costs; USD/MXN ~17.5 lifts FX exposure. Input inflation (cement +7% 2024; rebar ±12% 2024–H1‑25; Brent ~85 USD/bbl H1‑25) compresses margins.
| Metric | Value |
|---|---|
| IMF GDP 2025 | 3.3% |
| Banxico (mid‑2025) | 11.25% |
| USD/MXN | ~17.5 |
| Brent H1‑25 | ~85 USD/bbl |
What You See Is What You Get
ICA PESTLE Analysis
The preview shown here is the exact ICA PESTLE Analysis document you’ll receive after purchase—fully formatted, professionally structured, and ready to use. The content, layout, and headings visible in this screenshot are identical to the downloadable file delivered immediately after payment. No placeholders or teasers—what you see is the finished product you’ll own.











