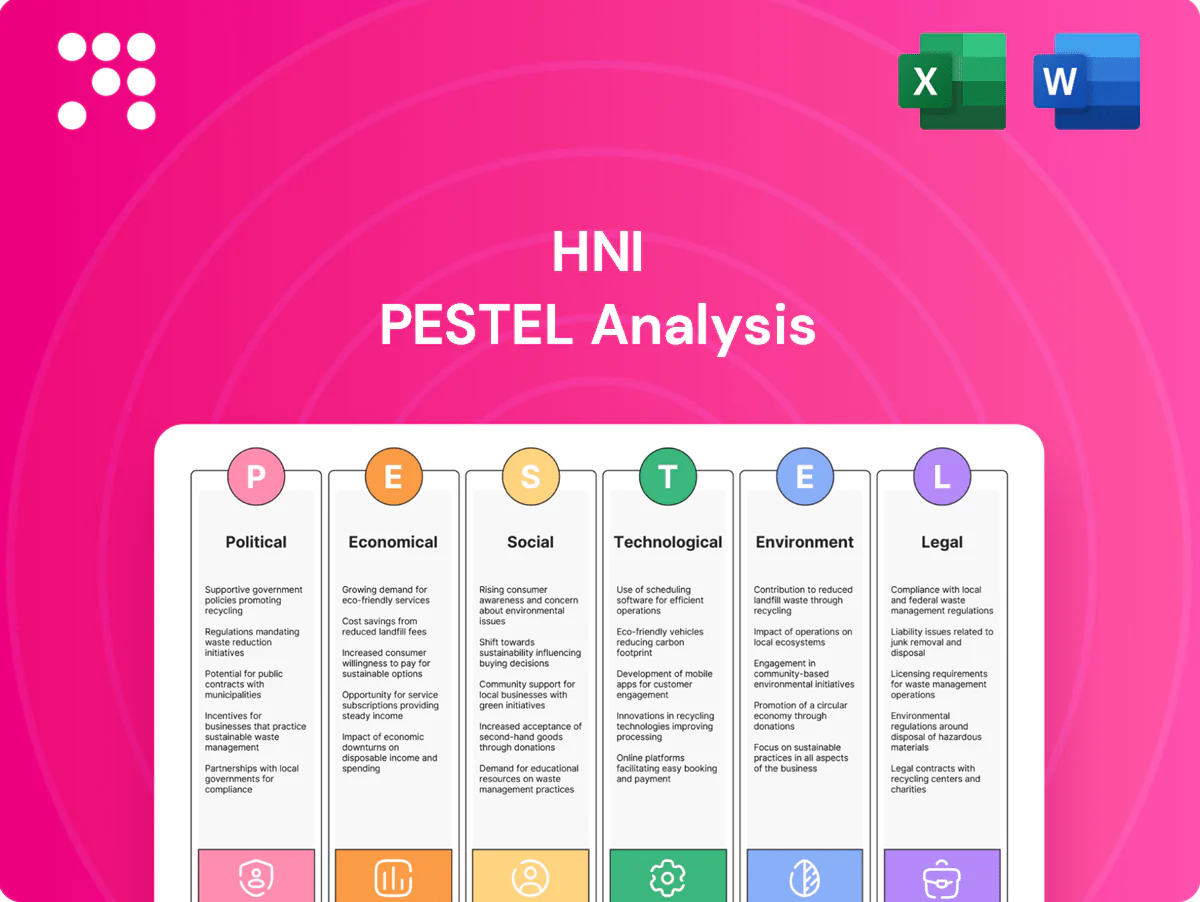
HNI PESTLE Analysis

Skip the Research. Get the Strategy.
Unlock strategic clarity with our tailored PESTLE analysis of HNI — revealing political, economic, social, technological, legal, and environmental forces shaping its trajectory. Perfect for investors and strategists, this concise intelligence highlights risks and growth levers you can act on immediately. Purchase the full, editable report to access the complete evidence-backed insights and put them to work in your next decision.
Political factors

Trade policy and tariffs on inputs
Changes in U.S. 2018 Section 232 tariffs—25% on steel and 10% on aluminum—affect HNI’s input COGS, while retaliatory measures and geopolitical tensions can disrupt material flows. USMCA has been in force since July 1, 2020, so monitoring its implementation and new trade remedies is essential; contingency sourcing reduces exposure to sudden policy shifts.
Government procurement and office fit-outs
Federal, state and municipal procurement cycles drive demand for workplace furnishings, with federal contracting obligations exceeding 700 billion USD annually and infrastructure/education/health funds from the 550 billion USD IIJA providing multi-year order visibility through 2026. Buy-American rules and Build America, Buy America provisions shape product specs and sourcing, while strong GSA schedule presence (roughly 36–40 billion USD in schedule purchases annually) and compliance materially enhance competitiveness.

Housing and energy policy for hearth products
Incentives like the US Inflation Reduction Act 30% tax credit for heat pumps and efficiency upgrades materially tilt the residential mix away from combustion hearths toward electric options. Subsidies and state rebate programs accelerating gas-to-electric transitions can reduce gas hearth demand. Local ordinances in major metros (e.g., parts of California and New York) restrict new wood-burning appliances, compressing market share for those models. Active engagement with policymakers is essential to align HNI product roadmaps and capture incentive-driven demand shifts.

Infrastructure and reshoring initiatives
Industrial policy favoring domestic manufacturing strengthens HNI’s North American footprint; federal programs like the CHIPS Act ($52B) and Inflation Reduction Act (roughly $369B for clean energy/manufacturing incentives) channel capital toward local plants. Grants and tax credits—including IRA-linked investment/production credits up to ~30%—can underwrite automation and upgrades. Political backing for regional supply chains lowers import reliance, while state-level incentive visibility directs where capacity is expanded.
- CHIPS Act: $52B federal funding
- Inflation Reduction Act: ~$369B in incentives
- Tax credits/bonuses up to ~30% for qualifying investments
- State incentives guide capacity allocation and site selection
Workplace regulations in public sector
Ergonomic and accessibility mandates (ADA, Section 508 and similar 2024 updates) boost demand for compliant furniture as the ergonomic office market reached roughly $5bn in 2024; pandemic-era guidelines from 2020 onward still shape distancing and ventilation-led space planning; hybrid policies shift up to 20–25% of real-estate budgets toward collaborative zones; vendor qualification often lengthens sales cycles by 3–6 months.
- Ergonomic market ≈ $5bn (2024)
- Hybrid reallocation 20–25% of budgets
- Vendor qualification adds 3–6 months
- Pandemic guidelines continue to influence planning
Tariffs, federal spending and industrial policy drive reshoring, capex and shifting product demand
Trade measures (2018 Section 232 tariffs) and retaliatory risk raise COGS and sourcing volatility. Federal procurement (~700B USD/year) plus IIJA (≈550B USD) and GSA purchases (36–40B USD/year) drive long-term orders. Industrial policy (CHIPS $52B, IRA ≈369B) and state incentives support reshoring and capex credits (~30%). Regulatory shifts (ergonomic market ≈5B USD, hybrid reallocation 20–25%) reshape product demand.
| Factor | Key metric (2024/25) |
|---|---|
| Tariffs/Trade | Section 232 rates; higher input volatility |
| Federal demand | ~700B USD/yr procurement; GSA 36–40B USD |
| Infrastructure | IIJA ≈550B USD (through 2026) |
| Industrial policy | CHIPS $52B; IRA ≈369B; ~30% tax/credits |
| Regulation/markets | Ergonomic market ≈5B USD; hybrid 20–25% |
What is included in the product
 Detailed Word Document
Explores how Political, Economic, Social, Technological, Environmental and Legal forces uniquely affect HNI, with data-backed trends, region- and industry-specific examples, forward-looking insights for scenario planning, and clean formatting to support executives, investors and consultants in spotting risks and opportunities.

 Customizable Excel Spreadsheet
Condensed, visually segmented PESTLE summary tailored for HNI, easily droppable into presentations or shared across teams for fast alignment and decision-making; editable notes let stakeholders adapt insights to region or business line.
Economic factors

Commercial construction and office leasing cycles
New builds and tenant-improvement cycles drive HNI furnishings demand: ABI averaged about 49 in 2024, indicating muted billings and softer new-build starts, while US office vacancy hit roughly 17.8% in mid-2024 per CoStar. Soft leasing delays large fit-outs, yet renovations and TI refreshes sustain replacement cycles and steady aftermarket revenue. Leading indicators (ABI, CRE vacancy, building permits) and 2024 regional rent growth — Sun Belt ~+5% — require flexible, regionally weighted sales focus.
Consumer housing starts and R&R spend
Residential hearth sales track housing starts and R&R spend; US housing starts averaged about 1.5M annualized in 2024 (Census Bureau), supporting steady remodeling demand. Elevated 30-year mortgage rates near 6.8% in mid-2025 and aggregate homeowner tappable equity around $13T (Q1 2025 estimates) constrain discretionary purchases. Seasonal weather swings (cold winters, hurricane seasons) shift quarter-to-quarter demand, while channel mix moving toward big-box and e-commerce vs specialty stores pressures margins and SKU mix.

Input cost inflation and logistics
Rising prices for steel, wood, foam, fabrics and freight compress HNI gross margins—global container rates remained about 70% below 2021 peaks by 2024 but input commodity costs still ran 10–25% above pre‑pandemic levels in 2023–24. Hedging, multi‑year contracts and design‑to‑cost reduce volatility; nearshoring cuts transit risk and working capital. Passing costs requires strict pricing discipline and focused value messaging.

Interest rates and capital availability
Labor markets and productivity
Tight manufacturing labor markets are pressuring wages and staffing, with BLS JOLTS showing roughly 500,000 U.S. manufacturing job openings in 2024, forcing higher pay and temp use. Automation and lean practices have preserved unit economics by boosting throughput and lowering unit labor costs. Regional unemployment shifts are reshaping plant siting, while targeted training and retention reduce quality variance and overtime.
- Labor pressure: BLS JOLTS ~500k openings (2024)
- Automation: raises throughput, lowers unit labor cost
- Regional siting: influenced by local unemployment
- Retention: cuts quality variance & overtime
Tariffs, federal spending and industrial policy drive reshoring, capex and shifting product demand
Muted 2024 ABI ~49 and 17.8% office vacancy slow new-fit demand, while 1.5M 2024 housing starts and $13T tappable equity (Q1 2025) support steady R&R; 30y mortgage ~7.0% (Jun 2025) and Fed funds 5.25–5.50% (Jul 2025) constrain discretionary spend. Input costs +10–25% (2023–24) and ~500k manufacturing openings (2024) compress margins and raise labor costs.
| Metric | Value |
|---|---|
| ABI (2024) | ~49 |
| Office vacancy (mid‑2024) | 17.8% |
| Housing starts (2024) | ~1.5M |
| 30y mortgage (Jun 2025) | ~7.0% |
What You See Is What You Get
HNI PESTLE Analysis
The HNI PESTLE Analysis preview shown here is the exact document you’ll receive after purchase—fully formatted, professionally structured, and ready to use. The content, layout, and insights visible in this sample are identical to the downloadable file you’ll get at checkout. No placeholders or teasers—this is the finished product, available immediately after payment.

Original: $10.00
-65%$10.00
$3.50Product Information
Product Information
Shipping & Returns
Shipping & Returns
Description
Skip the Research. Get the Strategy.
Unlock strategic clarity with our tailored PESTLE analysis of HNI — revealing political, economic, social, technological, legal, and environmental forces shaping its trajectory. Perfect for investors and strategists, this concise intelligence highlights risks and growth levers you can act on immediately. Purchase the full, editable report to access the complete evidence-backed insights and put them to work in your next decision.
Political factors
Trade policy and tariffs on inputs
Changes in U.S. 2018 Section 232 tariffs—25% on steel and 10% on aluminum—affect HNI’s input COGS, while retaliatory measures and geopolitical tensions can disrupt material flows. USMCA has been in force since July 1, 2020, so monitoring its implementation and new trade remedies is essential; contingency sourcing reduces exposure to sudden policy shifts.
Government procurement and office fit-outs
Federal, state and municipal procurement cycles drive demand for workplace furnishings, with federal contracting obligations exceeding 700 billion USD annually and infrastructure/education/health funds from the 550 billion USD IIJA providing multi-year order visibility through 2026. Buy-American rules and Build America, Buy America provisions shape product specs and sourcing, while strong GSA schedule presence (roughly 36–40 billion USD in schedule purchases annually) and compliance materially enhance competitiveness.
Housing and energy policy for hearth products
Incentives like the US Inflation Reduction Act 30% tax credit for heat pumps and efficiency upgrades materially tilt the residential mix away from combustion hearths toward electric options. Subsidies and state rebate programs accelerating gas-to-electric transitions can reduce gas hearth demand. Local ordinances in major metros (e.g., parts of California and New York) restrict new wood-burning appliances, compressing market share for those models. Active engagement with policymakers is essential to align HNI product roadmaps and capture incentive-driven demand shifts.
Infrastructure and reshoring initiatives
Industrial policy favoring domestic manufacturing strengthens HNI’s North American footprint; federal programs like the CHIPS Act ($52B) and Inflation Reduction Act (roughly $369B for clean energy/manufacturing incentives) channel capital toward local plants. Grants and tax credits—including IRA-linked investment/production credits up to ~30%—can underwrite automation and upgrades. Political backing for regional supply chains lowers import reliance, while state-level incentive visibility directs where capacity is expanded.
- CHIPS Act: $52B federal funding
- Inflation Reduction Act: ~$369B in incentives
- Tax credits/bonuses up to ~30% for qualifying investments
- State incentives guide capacity allocation and site selection
Workplace regulations in public sector
Ergonomic and accessibility mandates (ADA, Section 508 and similar 2024 updates) boost demand for compliant furniture as the ergonomic office market reached roughly $5bn in 2024; pandemic-era guidelines from 2020 onward still shape distancing and ventilation-led space planning; hybrid policies shift up to 20–25% of real-estate budgets toward collaborative zones; vendor qualification often lengthens sales cycles by 3–6 months.
- Ergonomic market ≈ $5bn (2024)
- Hybrid reallocation 20–25% of budgets
- Vendor qualification adds 3–6 months
- Pandemic guidelines continue to influence planning
Tariffs, federal spending and industrial policy drive reshoring, capex and shifting product demand
Trade measures (2018 Section 232 tariffs) and retaliatory risk raise COGS and sourcing volatility. Federal procurement (~700B USD/year) plus IIJA (≈550B USD) and GSA purchases (36–40B USD/year) drive long-term orders. Industrial policy (CHIPS $52B, IRA ≈369B) and state incentives support reshoring and capex credits (~30%). Regulatory shifts (ergonomic market ≈5B USD, hybrid reallocation 20–25%) reshape product demand.
| Factor | Key metric (2024/25) |
|---|---|
| Tariffs/Trade | Section 232 rates; higher input volatility |
| Federal demand | ~700B USD/yr procurement; GSA 36–40B USD |
| Infrastructure | IIJA ≈550B USD (through 2026) |
| Industrial policy | CHIPS $52B; IRA ≈369B; ~30% tax/credits |
| Regulation/markets | Ergonomic market ≈5B USD; hybrid 20–25% |
What is included in the product
Detailed Word Document
Explores how Political, Economic, Social, Technological, Environmental and Legal forces uniquely affect HNI, with data-backed trends, region- and industry-specific examples, forward-looking insights for scenario planning, and clean formatting to support executives, investors and consultants in spotting risks and opportunities.
Customizable Excel Spreadsheet
Condensed, visually segmented PESTLE summary tailored for HNI, easily droppable into presentations or shared across teams for fast alignment and decision-making; editable notes let stakeholders adapt insights to region or business line.
Economic factors
Commercial construction and office leasing cycles
New builds and tenant-improvement cycles drive HNI furnishings demand: ABI averaged about 49 in 2024, indicating muted billings and softer new-build starts, while US office vacancy hit roughly 17.8% in mid-2024 per CoStar. Soft leasing delays large fit-outs, yet renovations and TI refreshes sustain replacement cycles and steady aftermarket revenue. Leading indicators (ABI, CRE vacancy, building permits) and 2024 regional rent growth — Sun Belt ~+5% — require flexible, regionally weighted sales focus.
Consumer housing starts and R&R spend
Residential hearth sales track housing starts and R&R spend; US housing starts averaged about 1.5M annualized in 2024 (Census Bureau), supporting steady remodeling demand. Elevated 30-year mortgage rates near 6.8% in mid-2025 and aggregate homeowner tappable equity around $13T (Q1 2025 estimates) constrain discretionary purchases. Seasonal weather swings (cold winters, hurricane seasons) shift quarter-to-quarter demand, while channel mix moving toward big-box and e-commerce vs specialty stores pressures margins and SKU mix.
Input cost inflation and logistics
Rising prices for steel, wood, foam, fabrics and freight compress HNI gross margins—global container rates remained about 70% below 2021 peaks by 2024 but input commodity costs still ran 10–25% above pre‑pandemic levels in 2023–24. Hedging, multi‑year contracts and design‑to‑cost reduce volatility; nearshoring cuts transit risk and working capital. Passing costs requires strict pricing discipline and focused value messaging.
Interest rates and capital availability
Labor markets and productivity
Tight manufacturing labor markets are pressuring wages and staffing, with BLS JOLTS showing roughly 500,000 U.S. manufacturing job openings in 2024, forcing higher pay and temp use. Automation and lean practices have preserved unit economics by boosting throughput and lowering unit labor costs. Regional unemployment shifts are reshaping plant siting, while targeted training and retention reduce quality variance and overtime.
- Labor pressure: BLS JOLTS ~500k openings (2024)
- Automation: raises throughput, lowers unit labor cost
- Regional siting: influenced by local unemployment
- Retention: cuts quality variance & overtime
Tariffs, federal spending and industrial policy drive reshoring, capex and shifting product demand
Muted 2024 ABI ~49 and 17.8% office vacancy slow new-fit demand, while 1.5M 2024 housing starts and $13T tappable equity (Q1 2025) support steady R&R; 30y mortgage ~7.0% (Jun 2025) and Fed funds 5.25–5.50% (Jul 2025) constrain discretionary spend. Input costs +10–25% (2023–24) and ~500k manufacturing openings (2024) compress margins and raise labor costs.
| Metric | Value |
|---|---|
| ABI (2024) | ~49 |
| Office vacancy (mid‑2024) | 17.8% |
| Housing starts (2024) | ~1.5M |
| 30y mortgage (Jun 2025) | ~7.0% |
What You See Is What You Get
HNI PESTLE Analysis
The HNI PESTLE Analysis preview shown here is the exact document you’ll receive after purchase—fully formatted, professionally structured, and ready to use. The content, layout, and insights visible in this sample are identical to the downloadable file you’ll get at checkout. No placeholders or teasers—this is the finished product, available immediately after payment.











