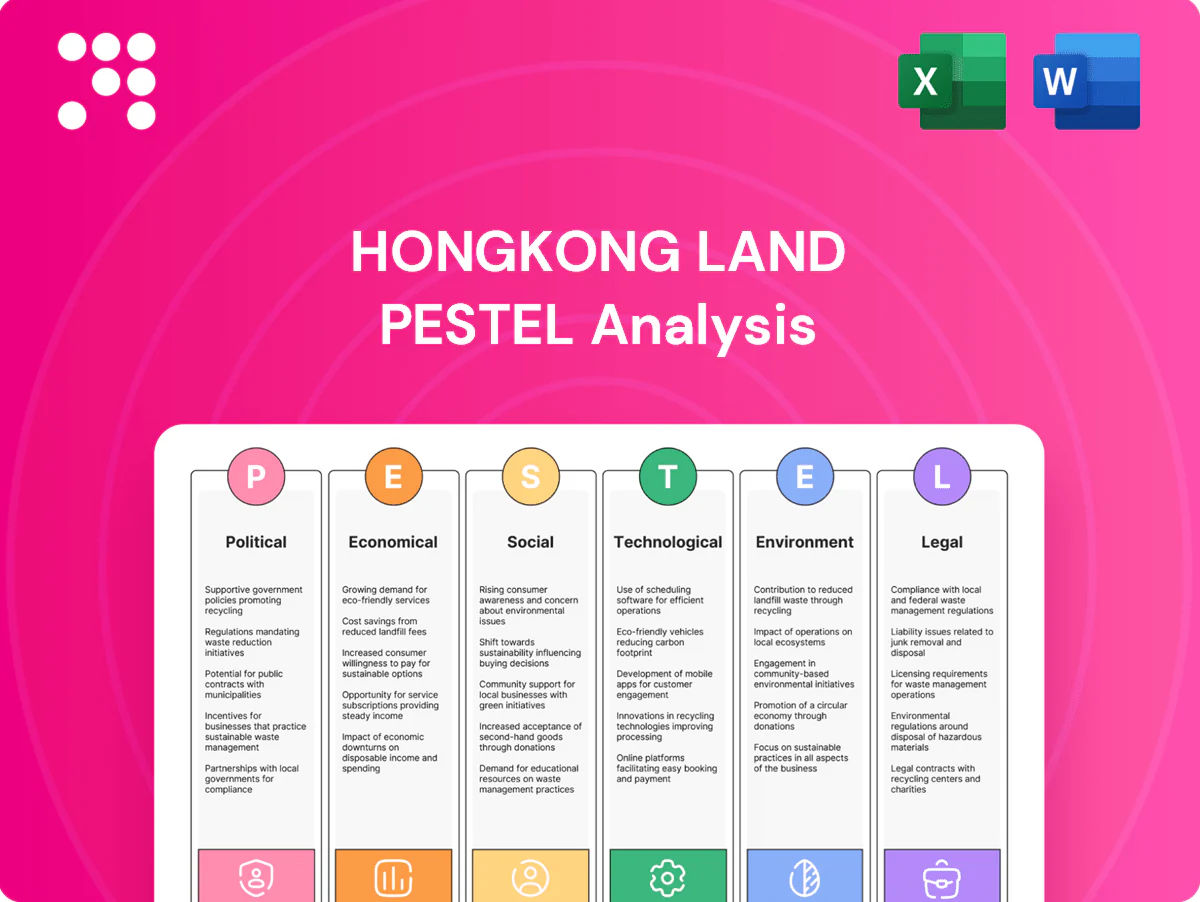
Hongkong Land PESTLE Analysis

Your Competitive Advantage Starts with This Report
Understand how political shifts, economic cycles, and environmental trends are reshaping Hongkong Land’s strategy and asset value in our concise PESTLE snapshot. This analysis highlights key risks and opportunities for investors and strategists. Purchase the full PESTLE to access detailed, actionable intelligence you can use today.
Political factors

Regulatory stability in HK and Singapore
Policy consistency in Hong Kong (Moody’s Aa3 as of 2024) and Singapore (Moody’s Aa1 as of 2024) underpins long-term leasing and development visibility for Hongkong Land, supporting multi-year lease rollovers and predictable planning horizons. This regulatory stability sustains premium asset valuations and refinancing confidence, keeping bid-ask spreads and cap rates tight. Any abrupt shifts in planning or tax policy could materially change development economics and yields, affecting NAV and cashflow forecasts.
Mainland China policy direction
Mainland policy—housing demand support, urban renewal drives and SOE reform shape approvals and buyer confidence; property and related sectors account for roughly 25% of China’s GDP, amplifying policy impact. Easing measures (targeted credit or local purchase-relief) have historically unlocked sales velocity for residential projects and improved cash conversion. Conversely, tighter controls or uneven local implementation can delay approvals, slow presales and push out developer cash flows.

Geopolitical tensions and capital flows
US–China frictions, including expanded US semiconductor export controls since October 2022, have reduced cross-border investment appetite and led some multinationals to reconsider Hong Kong leasing and footprint decisions. Sanctions and controls have rebalanced CBD tenant mixes away from sensitive tech firms toward finance and professional services. CBRE/PMG data through 2024 show prime APAC office cap rates widened roughly 75 basis points, raising investor risk premia and accelerating selective asset disposals.

Land supply and urban planning
Government land tender pipelines in Hong Kong, Singapore and regional cities dictate development optionality; Hong Kong’s recent supply pushes near-term attention to urban renewal and brownfield sites, while transit-oriented zoning and plot ratios (often up to double-digit levels at major nodes) materially drive site economics. Competitive tenders—with win premiums seen in double digits—can compress margins if policy boosts supply.
- HK: government tenders steer project timing and scale
- Zoning/plot ratio: primary driver of buildable value
- Transit planning: increases land value and absorption
- Competitive tenders: compress margins via bid inflation
Indonesia and Southeast Asia governance
Decentralized governance in Indonesia and SEA—with Jabodetabek metro ~31 million residents—means permits and project timelines vary widely between Jakarta and regional markets, directly impacting Hongkong Land development schedules and costs. Major national infrastructure projects raise district attractiveness and can boost land values near transit corridors. Shifts in foreign ownership or local-content rules (recently debated across ASEAN) can force JV restructures and alter ROI calculations.
- Permits/timelines: regional variance, longer outside Jakarta
- Infrastructure: transit projects raise nearby values
- Policy risk: foreign-ownership/local-content changes affect JV structures
Policy stability vs China property (~25% GDP) and APAC cap-rate shifts
Policy stability (HK Moody’s Aa3 2024; SG Aa1 2024) underpins long leases and refinancing; abrupt tax/planning shifts would hit NAV and cashflows. China property-related activity represents ~25% of GDP, so mainland housing and SOE reforms materially affect approvals and sales. US–China tech frictions widened prime APAC office cap rates ~75 bps by 2024, shifting tenant mix. Jabodetabek metro ~31m; local rules and tenders (win premiums double-digit) alter project returns.
| Metric | Value |
|---|---|
| HK rating (2024) | Aa3 |
| SG rating (2024) | Aa1 |
| China property share | ~25% GDP |
| APAC cap rate shift | +75 bps (to 2024) |
| Jabodetabek pop. | ~31m |
What is included in the product
 Detailed Word Document
Explores how external macro-environmental factors uniquely affect Hongkong Land across Political, Economic, Social, Technological, Environmental and Legal dimensions, offering data-backed trends and forward-looking insights to help executives, investors and strategists identify risks, opportunities and integrate findings into plans, decks and scenario planning for Hong Kong and regional property markets.

 Customizable Excel Spreadsheet
A clean, summarized PESTLE of Hongkong Land for easy referencing during meetings or presentations, highlighting key political, economic, social, technological, legal and environmental factors affecting its property portfolio.
Economic factors

Interest rates and financing costs
Global rate cycles—peaking around 5.25–5.50% in 2023–24—directly raise borrowing costs and discount rates for valuations; markets by mid‑2025 were pricing roughly 100–150bps of easing. Elevated Hong Kong 3‑month HIBOR (~4–5% in 2023–24) pushed up cap rates by an estimated 50–100bps, pressuring investment values and slowing acquisitions. Easing cycles support refinancing and boost development IRRs.
Office demand and hybrid work economics
Net absorption diverged across key markets in 2024: Hong Kong recorded roughly -0.6 million sq ft, Singapore posted about +0.4 million sq ft and Beijing around +0.2 million sq m, driving differing rental reversion pressures. Hybrid work has reduced aggregate desk demand but accelerated flight-to-quality, supporting premium CBD rents. Elevated vacancy and landlord incentives—up to double-digit effective rent discounts in some submarkets—are compressing cash flows and stretching leasing cycles.

Luxury retail and tourism recovery
Inbound tourism recovery—visitor arrivals rose from 18.1 million in 2023 to about 23.4 million in 2024 (HKTB)—has driven high-end consumption and lifted mall sales productivity across Hongkong Land assets. Currency movements, notably RMB strength versus regional currencies, have shifted shopper flows and boosted tenant sales from mainland visitors. Strong luxury sales have supported turnover-based rents and enabled retailer expansion in prime retail locations.

China residential cycle
China residential cycle: buyer sentiment, mortgage availability and pricing directly drive sell-through rates and cash collection for Hongkong Land; easing since 2023 has supported volumes but margin pressure from discounts and elevated inventory persists. Project phasing must target local demand pockets to avoid cash-flow mismatch and align launches with credit windows.
- Buyer sentiment: cautious, selective
- Mortgage availability: improved but conditional
- Pricing: discounts compress margins
- Phasing: align launches to local demand
FX exposure and HKD/USD peg dynamics
Hongkong Land faces translation and transaction risk from rental streams in HKD, USD, RMB and SGD; the HKD peg (7.75–7.85 per USD) stabilises cash flows but effectively links local rates to US policy (Fed funds around 5.25–5.50% in 2024), exposing margins to US rate moves. Natural hedges and matching debt currency are critical to mitigate FX mismatch and funding-cost transmission.
- FX mix: multi-currency rents
- Peg: 7.75–7.85 HKD/USD
- Mitigation: natural hedges, debt currency matching
Policy stability vs China property (~25% GDP) and APAC cap-rate shifts
Higher global rates (Fed ~5.25–5.50% in 2024) and HK 3‑month HIBOR ~4–5% raised cap rates and borrowing costs, though markets priced 100–150bps easing by mid‑2025. 2024 net absorption: Hong Kong -0.6m sq ft, Singapore +0.4m sq ft; vacancy and incentives pressured rents while flight‑to‑quality supported CBD premiums. Visitor arrivals rose to ~23.4m in 2024, boosting retail sales and turnover rents.
| Metric | 2024 | Impact |
|---|---|---|
| Fed funds | 5.25–5.50% | Higher discount rates |
| HK HIBOR | ~4–5% | Cap rate +50–100bps |
| Visitor arrivals | 23.4m | Retail demand up |
| HK net absorption | -0.6m sq ft | Leasing pressure |
What You See Is What You Get
Hongkong Land PESTLE Analysis
The Hongkong Land PESTLE analysis examines political, economic, social, technological, legal and environmental factors shaping the company's competitive position and strategic risks. It includes concise insights and implications for investors and managers. The preview shown here is the exact document you’ll receive after purchase—fully formatted and ready to use.

Original: $10.00
-65%$10.00
$3.50Product Information
Product Information
Shipping & Returns
Shipping & Returns
Description
Your Competitive Advantage Starts with This Report
Understand how political shifts, economic cycles, and environmental trends are reshaping Hongkong Land’s strategy and asset value in our concise PESTLE snapshot. This analysis highlights key risks and opportunities for investors and strategists. Purchase the full PESTLE to access detailed, actionable intelligence you can use today.
Political factors
Regulatory stability in HK and Singapore
Policy consistency in Hong Kong (Moody’s Aa3 as of 2024) and Singapore (Moody’s Aa1 as of 2024) underpins long-term leasing and development visibility for Hongkong Land, supporting multi-year lease rollovers and predictable planning horizons. This regulatory stability sustains premium asset valuations and refinancing confidence, keeping bid-ask spreads and cap rates tight. Any abrupt shifts in planning or tax policy could materially change development economics and yields, affecting NAV and cashflow forecasts.
Mainland China policy direction
Mainland policy—housing demand support, urban renewal drives and SOE reform shape approvals and buyer confidence; property and related sectors account for roughly 25% of China’s GDP, amplifying policy impact. Easing measures (targeted credit or local purchase-relief) have historically unlocked sales velocity for residential projects and improved cash conversion. Conversely, tighter controls or uneven local implementation can delay approvals, slow presales and push out developer cash flows.
Geopolitical tensions and capital flows
US–China frictions, including expanded US semiconductor export controls since October 2022, have reduced cross-border investment appetite and led some multinationals to reconsider Hong Kong leasing and footprint decisions. Sanctions and controls have rebalanced CBD tenant mixes away from sensitive tech firms toward finance and professional services. CBRE/PMG data through 2024 show prime APAC office cap rates widened roughly 75 basis points, raising investor risk premia and accelerating selective asset disposals.
Land supply and urban planning
Government land tender pipelines in Hong Kong, Singapore and regional cities dictate development optionality; Hong Kong’s recent supply pushes near-term attention to urban renewal and brownfield sites, while transit-oriented zoning and plot ratios (often up to double-digit levels at major nodes) materially drive site economics. Competitive tenders—with win premiums seen in double digits—can compress margins if policy boosts supply.
- HK: government tenders steer project timing and scale
- Zoning/plot ratio: primary driver of buildable value
- Transit planning: increases land value and absorption
- Competitive tenders: compress margins via bid inflation
Indonesia and Southeast Asia governance
Decentralized governance in Indonesia and SEA—with Jabodetabek metro ~31 million residents—means permits and project timelines vary widely between Jakarta and regional markets, directly impacting Hongkong Land development schedules and costs. Major national infrastructure projects raise district attractiveness and can boost land values near transit corridors. Shifts in foreign ownership or local-content rules (recently debated across ASEAN) can force JV restructures and alter ROI calculations.
- Permits/timelines: regional variance, longer outside Jakarta
- Infrastructure: transit projects raise nearby values
- Policy risk: foreign-ownership/local-content changes affect JV structures
Policy stability vs China property (~25% GDP) and APAC cap-rate shifts
Policy stability (HK Moody’s Aa3 2024; SG Aa1 2024) underpins long leases and refinancing; abrupt tax/planning shifts would hit NAV and cashflows. China property-related activity represents ~25% of GDP, so mainland housing and SOE reforms materially affect approvals and sales. US–China tech frictions widened prime APAC office cap rates ~75 bps by 2024, shifting tenant mix. Jabodetabek metro ~31m; local rules and tenders (win premiums double-digit) alter project returns.
| Metric | Value |
|---|---|
| HK rating (2024) | Aa3 |
| SG rating (2024) | Aa1 |
| China property share | ~25% GDP |
| APAC cap rate shift | +75 bps (to 2024) |
| Jabodetabek pop. | ~31m |
What is included in the product
Detailed Word Document
Explores how external macro-environmental factors uniquely affect Hongkong Land across Political, Economic, Social, Technological, Environmental and Legal dimensions, offering data-backed trends and forward-looking insights to help executives, investors and strategists identify risks, opportunities and integrate findings into plans, decks and scenario planning for Hong Kong and regional property markets.
Customizable Excel Spreadsheet
A clean, summarized PESTLE of Hongkong Land for easy referencing during meetings or presentations, highlighting key political, economic, social, technological, legal and environmental factors affecting its property portfolio.
Economic factors
Interest rates and financing costs
Global rate cycles—peaking around 5.25–5.50% in 2023–24—directly raise borrowing costs and discount rates for valuations; markets by mid‑2025 were pricing roughly 100–150bps of easing. Elevated Hong Kong 3‑month HIBOR (~4–5% in 2023–24) pushed up cap rates by an estimated 50–100bps, pressuring investment values and slowing acquisitions. Easing cycles support refinancing and boost development IRRs.
Office demand and hybrid work economics
Net absorption diverged across key markets in 2024: Hong Kong recorded roughly -0.6 million sq ft, Singapore posted about +0.4 million sq ft and Beijing around +0.2 million sq m, driving differing rental reversion pressures. Hybrid work has reduced aggregate desk demand but accelerated flight-to-quality, supporting premium CBD rents. Elevated vacancy and landlord incentives—up to double-digit effective rent discounts in some submarkets—are compressing cash flows and stretching leasing cycles.
Luxury retail and tourism recovery
Inbound tourism recovery—visitor arrivals rose from 18.1 million in 2023 to about 23.4 million in 2024 (HKTB)—has driven high-end consumption and lifted mall sales productivity across Hongkong Land assets. Currency movements, notably RMB strength versus regional currencies, have shifted shopper flows and boosted tenant sales from mainland visitors. Strong luxury sales have supported turnover-based rents and enabled retailer expansion in prime retail locations.
China residential cycle
China residential cycle: buyer sentiment, mortgage availability and pricing directly drive sell-through rates and cash collection for Hongkong Land; easing since 2023 has supported volumes but margin pressure from discounts and elevated inventory persists. Project phasing must target local demand pockets to avoid cash-flow mismatch and align launches with credit windows.
- Buyer sentiment: cautious, selective
- Mortgage availability: improved but conditional
- Pricing: discounts compress margins
- Phasing: align launches to local demand
FX exposure and HKD/USD peg dynamics
Hongkong Land faces translation and transaction risk from rental streams in HKD, USD, RMB and SGD; the HKD peg (7.75–7.85 per USD) stabilises cash flows but effectively links local rates to US policy (Fed funds around 5.25–5.50% in 2024), exposing margins to US rate moves. Natural hedges and matching debt currency are critical to mitigate FX mismatch and funding-cost transmission.
- FX mix: multi-currency rents
- Peg: 7.75–7.85 HKD/USD
- Mitigation: natural hedges, debt currency matching
Policy stability vs China property (~25% GDP) and APAC cap-rate shifts
Higher global rates (Fed ~5.25–5.50% in 2024) and HK 3‑month HIBOR ~4–5% raised cap rates and borrowing costs, though markets priced 100–150bps easing by mid‑2025. 2024 net absorption: Hong Kong -0.6m sq ft, Singapore +0.4m sq ft; vacancy and incentives pressured rents while flight‑to‑quality supported CBD premiums. Visitor arrivals rose to ~23.4m in 2024, boosting retail sales and turnover rents.
| Metric | 2024 | Impact |
|---|---|---|
| Fed funds | 5.25–5.50% | Higher discount rates |
| HK HIBOR | ~4–5% | Cap rate +50–100bps |
| Visitor arrivals | 23.4m | Retail demand up |
| HK net absorption | -0.6m sq ft | Leasing pressure |
What You See Is What You Get
Hongkong Land PESTLE Analysis
The Hongkong Land PESTLE analysis examines political, economic, social, technological, legal and environmental factors shaping the company's competitive position and strategic risks. It includes concise insights and implications for investors and managers. The preview shown here is the exact document you’ll receive after purchase—fully formatted and ready to use.











