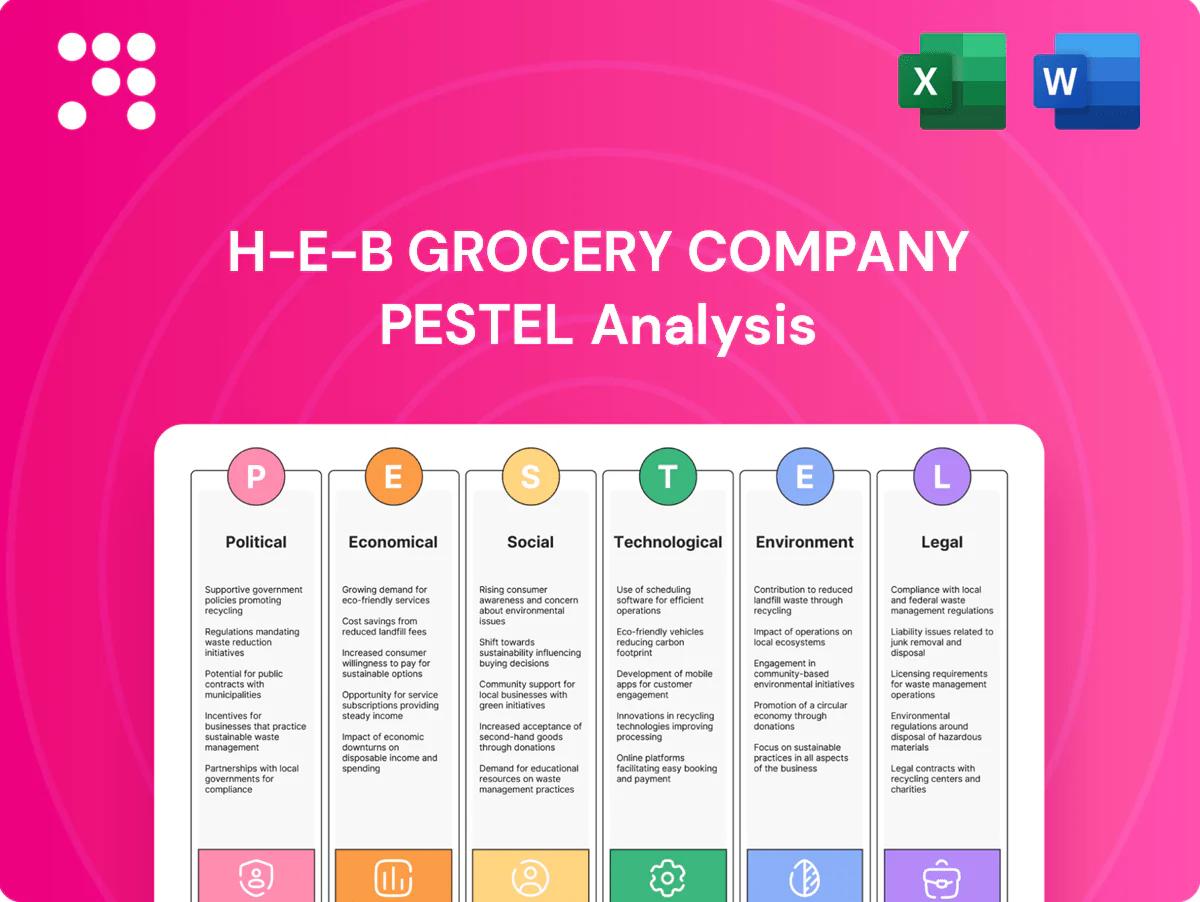
H-E-B Grocery Company PESTLE Analysis

Plan Smarter. Present Sharper. Compete Stronger.
Uncover how political regulations, shifting consumer economics, and emerging retail technologies are reshaping H‑E‑B Grocery Company's strategic landscape in our concise PESTLE snapshot. These insights reveal risks and growth levers for investors and planners. Purchase the full PESTLE analysis to access the complete, actionable breakdown and downloadable templates.
Political factors

State and local policy in Texas
State and local zoning, permitting, and incentive policies in Texas directly shape H-E-B store placement, distribution hubs, and expansion speed, with rapid-growth markets in a state of 29.7 million residents increasing demand for new locations. Texas has no state income tax, so local property tax regimes and appraisal rules (primary local revenue source) materially influence operating costs and capital allocation. Municipal public health ordinances and infrastructure investments affect in-store prepared-food operations, logistics reliability, and last-mile delivery efficiency.
US–Mexico trade and cross-border dynamics
USMCA, in force since July 1, 2020, underpins binational sourcing as US–Mexico goods trade topped $800 billion in 2023, while customs processes and border wait times (commonly 2–8 hours at major crossings) directly affect H‑E‑B’s supply flow and inventory cadence. Political shifts can alter tariffs, sanitary rules or inspection intensity, raising sourcing uncertainty and compliance costs. Security concerns and trucking rule changes raise cross‑border logistics risk and unit cost, and remittance and currency politics (remittances to Mexico ~ $60 billion annually) indirectly shape demand in border communities.

Federal nutrition programs (SNAP/WIC)
Federal nutrition programs materially affect H-E-B: SNAP averaged 38.3 million participants in FY2024 and WIC served about 6.2 million, with average SNAP benefits near $291/month (FY2023), which drives traffic and value-oriented basket mix. Benefit disbursement timing creates predictable monthly demand peaks. Changes to eligible items force assortment and private-label shifts, and compliance systems must be updated rapidly to meet rule changes.

Disaster preparedness and emergency response
H-E-B faces recurring hurricanes, floods and grid stress (Texas 2021 winter outages hit ~4.5M customers) that prompt state-led reopening directives and coordinated distribution; participation in FEMA/state emergency supply programs raises community profile but increases compliance and reporting burdens; fuel/convoy rules constrain restocking windows and political pressure around price-gouging rises during events.
- ~420 Texas stores exposed
- Emergency program compliance required
- Fuel/convoy access limits restocking
- Anti-gouging scrutiny intensifies
Infrastructure, transportation, and public safety policy
State highway funding and federal IIJA allocations (about 110 billion for roads and bridges) and targeted port investments affect H-E-B delivery costs and lead times; trucks still carry roughly 72% of US freight by weight (BTS 2023), so trucking regs and hours-of-service enforcement directly reshape driver scheduling and route planning. Public safety policy influences store security spend and shrink mitigation, while regional growth initiatives define future demand corridors for H-E-B’s network of over 420 stores (2024).
- State highway funding: impacts route reliability and maintenance costs
- Port investments: shorten import/export lead times
- Trucking regs: hours-of-service enforcement alters driver schedules
- Public safety policy: raises security/shrink budgets
- Regional growth: shifts demand corridors for 420+ stores
Texas zoning, taxes and border wait risks reshape grocery expansion; ~420 TX stores exposed
State/local zoning, property-tax regimes and Texas population (29.7M) drive H‑E‑B site costs and expansion pace; ~420 Texas stores exposed. Cross‑border sourcing tied to USMCA as US–Mexico trade topped $800B (2023) and remittances ~$60B, while 2–8h border waits raise inventory risk. SNAP (38.3M FY2024) and WIC (6.2M) shape demand and private‑label strategy. Trucking (72% freight by weight) and IIJA road funding (~$110B) affect delivery costs.
| Metric | Value |
|---|---|
| Texas pop. | 29.7M |
| Stores in TX | ~420 |
| US‑Mexico trade | $800B (2023) |
| SNAP | 38.3M (FY2024) |
| Trucking share | 72% by weight (2023) |
What is included in the product
 Detailed Word Document
Explores how external macro-environmental factors uniquely affect H‑E‑B across Political, Economic, Social, Technological, Environmental and Legal dimensions, with examples tied to its Texas and northern Mexico operations. Each section is data-backed, forward-looking and formatted for executives, investors and strategists to identify threats, opportunities and scenario plans.

 Customizable Excel Spreadsheet
A concise, visually segmented PESTLE summary of H‑E‑B that highlights regulatory, economic, technological and supply‑chain risks and opportunities, easing meeting prep, stakeholder alignment and strategic decision‑making.
Economic factors

Inflation and consumer purchasing power
Food-at-home inflation moderated to low single digits in 2024, compressing real incomes and shifting baskets toward value and private-label offerings. Price elasticity differs sharply: fresh is least elastic, center-store more responsive, and premium most elastic, driving category-specific pricing. H-E-B balances targeted promotions with EDLP to protect share while preserving margins. Vendor negotiations and multi-year contracts have become critical to lock costs and secure supply.
Labor market tightness and wage trends
Tight Texas labor markets (3.8% unemployment in 2024, BLS) put upward pressure on H-E-B frontline wages, benefits, and retention costs, with national retail average hourly earnings around $17.78 in 2024 (BLS). Productivity investments in store layouts and DC automation must offset rising labor spend, while training and multi-skilling sustain pharmacy and e-commerce service quality. Competition from national chains continues to push local market rates higher.

Fuel, freight, and logistics costs
Diesel price swings—U.S. retail diesel averaged about $3.95/gal in June 2025 (EIA)—and tight carrier capacity push delivered costs and shelf prices for H-E-B. Network optimization and backhaul capture help blunt volatility by improving asset utilization. Cold-chain intensity—refrigeration can account for roughly 40% of a store's energy use—raises energy-sensitive expenses. Closer sourcing reduces transport exposure and improves freshness.

Interest rates and real estate economics
Higher interest rates (federal funds ~5.25–5.50% in 2024–25) raise capex hurdle rates for new H-E-B stores and remodels, slowing rollout and tightening ROI thresholds; supermarket cap rates averaged about 5.5% in 2024 (CBRE). Lease TI allowances (~20–40 USD/sqft) and cap rates drive site selection; distribution automation ROI is sensitive to WACC (retail WACC ~7–9%). Rate cycles also press consumer credit costs (avg. credit card APR ~20–22%), curbing big-ticket discretionary spend.
- Higher rates → higher capex hurdle
- Cap rates ~5.5% → site economics
- TI $20–40/sqft → leasing choices
- WACC 7–9% → automation ROI
- Credit APR ~20–22% → weaker big-ticket demand
Competitive landscape and pricing pressure
National discounters such as Aldi (over 2,200 US stores) and club formats narrow price gaps while hard-discounters push everyday low prices; Aldi’s model—about 90% private-label SKUs—shows how private-label expansion both lifts margins and builds loyalty. H‑E‑B counters commoditization with assortment differentiation in fresh and prepared foods and competes on omnichannel speed and fees as online grocery reached roughly 8% of US grocery sales in 2023.
Texas zoning, taxes and border wait risks reshape grocery expansion; ~420 TX stores exposed
Food-at-home inflation moderated to low single digits in 2024, shifting baskets to value and private label. Tight Texas labor (3.8% unemployment 2024) raises wage and retention costs; automation offsets pressure. Higher rates (fed funds ~5.25–5.50% 2024–25) raise capex hurdles and tighten rollout ROI.
| Metric | Value |
|---|---|
| Food-at-home inflation 2024 | ~3% (low single digits) |
| Texas unemployment 2024 (BLS) | 3.8% |
| Fed funds 2024–25 | 5.25–5.50% |
What You See Is What You Get
H-E-B Grocery Company PESTLE Analysis
The preview shown here is the exact H-E-B Grocery Company PESTLE Analysis you'll receive after purchase—fully formatted and ready to use. It covers Political, Economic, Social, Technological, Legal, and Environmental factors with actionable insights and concise commentary. No placeholders or surprises; the file you download is the same polished document shown.

Original: $10.00
-65%$10.00
$3.50Product Information
Product Information
Shipping & Returns
Shipping & Returns
Description
Plan Smarter. Present Sharper. Compete Stronger.
Uncover how political regulations, shifting consumer economics, and emerging retail technologies are reshaping H‑E‑B Grocery Company's strategic landscape in our concise PESTLE snapshot. These insights reveal risks and growth levers for investors and planners. Purchase the full PESTLE analysis to access the complete, actionable breakdown and downloadable templates.
Political factors
State and local policy in Texas
State and local zoning, permitting, and incentive policies in Texas directly shape H-E-B store placement, distribution hubs, and expansion speed, with rapid-growth markets in a state of 29.7 million residents increasing demand for new locations. Texas has no state income tax, so local property tax regimes and appraisal rules (primary local revenue source) materially influence operating costs and capital allocation. Municipal public health ordinances and infrastructure investments affect in-store prepared-food operations, logistics reliability, and last-mile delivery efficiency.
US–Mexico trade and cross-border dynamics
USMCA, in force since July 1, 2020, underpins binational sourcing as US–Mexico goods trade topped $800 billion in 2023, while customs processes and border wait times (commonly 2–8 hours at major crossings) directly affect H‑E‑B’s supply flow and inventory cadence. Political shifts can alter tariffs, sanitary rules or inspection intensity, raising sourcing uncertainty and compliance costs. Security concerns and trucking rule changes raise cross‑border logistics risk and unit cost, and remittance and currency politics (remittances to Mexico ~ $60 billion annually) indirectly shape demand in border communities.
Federal nutrition programs (SNAP/WIC)
Federal nutrition programs materially affect H-E-B: SNAP averaged 38.3 million participants in FY2024 and WIC served about 6.2 million, with average SNAP benefits near $291/month (FY2023), which drives traffic and value-oriented basket mix. Benefit disbursement timing creates predictable monthly demand peaks. Changes to eligible items force assortment and private-label shifts, and compliance systems must be updated rapidly to meet rule changes.
Disaster preparedness and emergency response
H-E-B faces recurring hurricanes, floods and grid stress (Texas 2021 winter outages hit ~4.5M customers) that prompt state-led reopening directives and coordinated distribution; participation in FEMA/state emergency supply programs raises community profile but increases compliance and reporting burdens; fuel/convoy rules constrain restocking windows and political pressure around price-gouging rises during events.
- ~420 Texas stores exposed
- Emergency program compliance required
- Fuel/convoy access limits restocking
- Anti-gouging scrutiny intensifies
Infrastructure, transportation, and public safety policy
State highway funding and federal IIJA allocations (about 110 billion for roads and bridges) and targeted port investments affect H-E-B delivery costs and lead times; trucks still carry roughly 72% of US freight by weight (BTS 2023), so trucking regs and hours-of-service enforcement directly reshape driver scheduling and route planning. Public safety policy influences store security spend and shrink mitigation, while regional growth initiatives define future demand corridors for H-E-B’s network of over 420 stores (2024).
- State highway funding: impacts route reliability and maintenance costs
- Port investments: shorten import/export lead times
- Trucking regs: hours-of-service enforcement alters driver schedules
- Public safety policy: raises security/shrink budgets
- Regional growth: shifts demand corridors for 420+ stores
Texas zoning, taxes and border wait risks reshape grocery expansion; ~420 TX stores exposed
State/local zoning, property-tax regimes and Texas population (29.7M) drive H‑E‑B site costs and expansion pace; ~420 Texas stores exposed. Cross‑border sourcing tied to USMCA as US–Mexico trade topped $800B (2023) and remittances ~$60B, while 2–8h border waits raise inventory risk. SNAP (38.3M FY2024) and WIC (6.2M) shape demand and private‑label strategy. Trucking (72% freight by weight) and IIJA road funding (~$110B) affect delivery costs.
| Metric | Value |
|---|---|
| Texas pop. | 29.7M |
| Stores in TX | ~420 |
| US‑Mexico trade | $800B (2023) |
| SNAP | 38.3M (FY2024) |
| Trucking share | 72% by weight (2023) |
What is included in the product
Detailed Word Document
Explores how external macro-environmental factors uniquely affect H‑E‑B across Political, Economic, Social, Technological, Environmental and Legal dimensions, with examples tied to its Texas and northern Mexico operations. Each section is data-backed, forward-looking and formatted for executives, investors and strategists to identify threats, opportunities and scenario plans.
Customizable Excel Spreadsheet
A concise, visually segmented PESTLE summary of H‑E‑B that highlights regulatory, economic, technological and supply‑chain risks and opportunities, easing meeting prep, stakeholder alignment and strategic decision‑making.
Economic factors
Inflation and consumer purchasing power
Food-at-home inflation moderated to low single digits in 2024, compressing real incomes and shifting baskets toward value and private-label offerings. Price elasticity differs sharply: fresh is least elastic, center-store more responsive, and premium most elastic, driving category-specific pricing. H-E-B balances targeted promotions with EDLP to protect share while preserving margins. Vendor negotiations and multi-year contracts have become critical to lock costs and secure supply.
Labor market tightness and wage trends
Tight Texas labor markets (3.8% unemployment in 2024, BLS) put upward pressure on H-E-B frontline wages, benefits, and retention costs, with national retail average hourly earnings around $17.78 in 2024 (BLS). Productivity investments in store layouts and DC automation must offset rising labor spend, while training and multi-skilling sustain pharmacy and e-commerce service quality. Competition from national chains continues to push local market rates higher.
Fuel, freight, and logistics costs
Diesel price swings—U.S. retail diesel averaged about $3.95/gal in June 2025 (EIA)—and tight carrier capacity push delivered costs and shelf prices for H-E-B. Network optimization and backhaul capture help blunt volatility by improving asset utilization. Cold-chain intensity—refrigeration can account for roughly 40% of a store's energy use—raises energy-sensitive expenses. Closer sourcing reduces transport exposure and improves freshness.
Interest rates and real estate economics
Higher interest rates (federal funds ~5.25–5.50% in 2024–25) raise capex hurdle rates for new H-E-B stores and remodels, slowing rollout and tightening ROI thresholds; supermarket cap rates averaged about 5.5% in 2024 (CBRE). Lease TI allowances (~20–40 USD/sqft) and cap rates drive site selection; distribution automation ROI is sensitive to WACC (retail WACC ~7–9%). Rate cycles also press consumer credit costs (avg. credit card APR ~20–22%), curbing big-ticket discretionary spend.
- Higher rates → higher capex hurdle
- Cap rates ~5.5% → site economics
- TI $20–40/sqft → leasing choices
- WACC 7–9% → automation ROI
- Credit APR ~20–22% → weaker big-ticket demand
Competitive landscape and pricing pressure
National discounters such as Aldi (over 2,200 US stores) and club formats narrow price gaps while hard-discounters push everyday low prices; Aldi’s model—about 90% private-label SKUs—shows how private-label expansion both lifts margins and builds loyalty. H‑E‑B counters commoditization with assortment differentiation in fresh and prepared foods and competes on omnichannel speed and fees as online grocery reached roughly 8% of US grocery sales in 2023.
Texas zoning, taxes and border wait risks reshape grocery expansion; ~420 TX stores exposed
Food-at-home inflation moderated to low single digits in 2024, shifting baskets to value and private label. Tight Texas labor (3.8% unemployment 2024) raises wage and retention costs; automation offsets pressure. Higher rates (fed funds ~5.25–5.50% 2024–25) raise capex hurdles and tighten rollout ROI.
| Metric | Value |
|---|---|
| Food-at-home inflation 2024 | ~3% (low single digits) |
| Texas unemployment 2024 (BLS) | 3.8% |
| Fed funds 2024–25 | 5.25–5.50% |
What You See Is What You Get
H-E-B Grocery Company PESTLE Analysis
The preview shown here is the exact H-E-B Grocery Company PESTLE Analysis you'll receive after purchase—fully formatted and ready to use. It covers Political, Economic, Social, Technological, Legal, and Environmental factors with actionable insights and concise commentary. No placeholders or surprises; the file you download is the same polished document shown.











