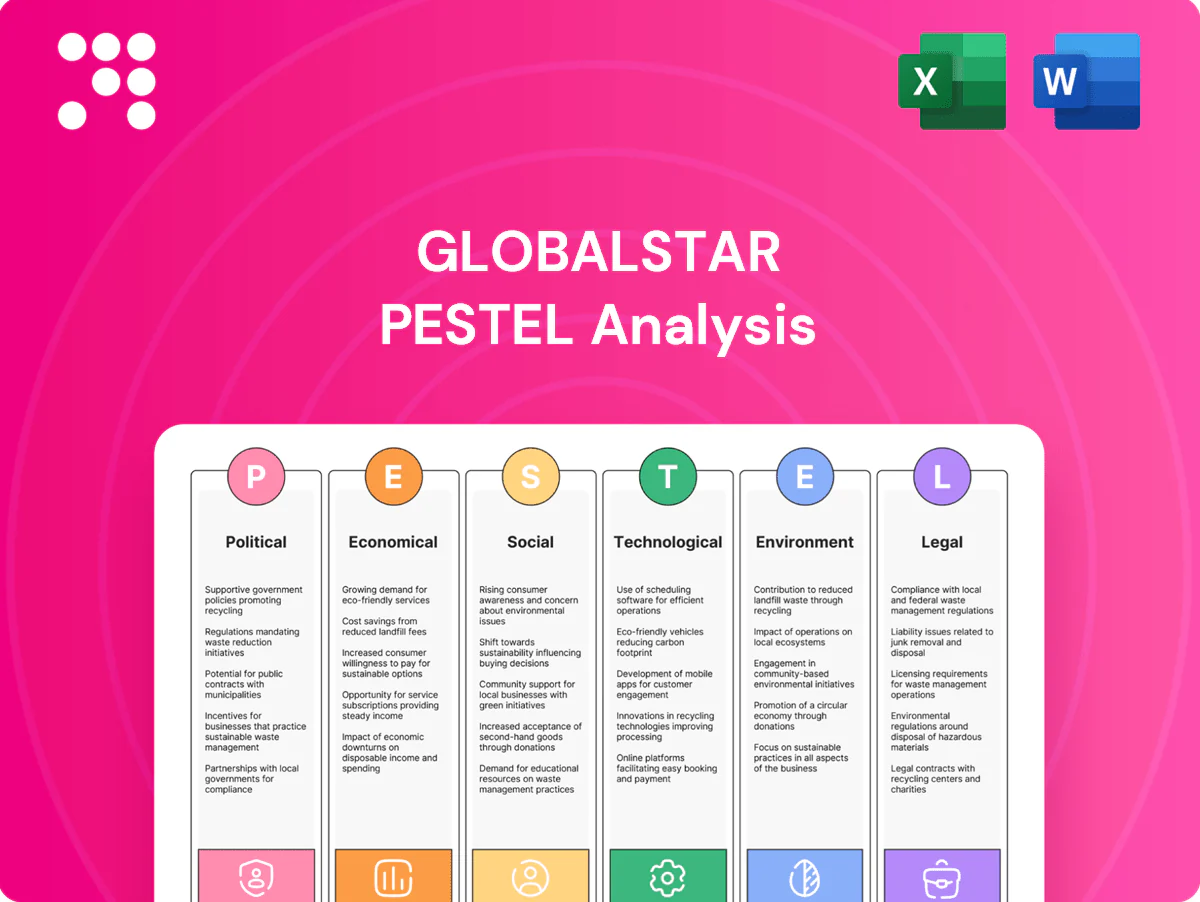
Globalstar PESTLE Analysis

Plan Smarter. Present Sharper. Compete Stronger.
Unlock how political, economic, social, technological, legal and environmental forces are reshaping Globalstar’s outlook — actionable insights for investors, strategists, and advisors. Purchase the full PESTLE now for a ready-to-use, downloadable analysis to inform decisions and mitigate risk.
Political factors

Global spectrum and ITU coordination
Access to S-band (≈2.0–2.3 GHz), L-band (≈1.5–1.6 GHz) and MSS allocations hinges on ITU filings and national assignments; ITU World Radiocommunication Conferences occur every 3–4 years and set the timetable for changes. Coordination with other constellations and terrestrial 5G/BS operators is politically mediated and can take multiple years. Reallocation or refarming pressures from mobile broadband constrain growth and may force costly redesigns or sharing agreements. Proactive diplomacy and regulatory engagement are essential for continuity.
National security and sanctions exposure
Globalstar operates in 120+ countries with a 24-satellite LEO constellation, exposing it to jurisdictions with divergent stances on satellite communications. Sanctions and export-control expansions in 2022–23 have already limited access to some markets, suppliers and partnerships. Governments may impose lawful-intercept and resilience mandates that increase technical and contractual requirements. Political shifts can rapidly elevate compliance costs and commercial risk.

Landing rights and market access
Many jurisdictions require landing rights and domestic gateways to offer satellite services, and Globalstar already serves 120+ countries, so political clearance is material to rollout. Approvals can be delayed or compel joint ventures with local operators, raising capex and partnership risk. Rising digital sovereignty policies in regions like the EU and India are tightening gateway rules. Predictable access hinges on stable bilateral and regulatory relations.

Government procurement and public safety alignment
Emergency services, defense, and public agencies are core Globalstar customers, with procurement timing and scope tied to budgets, election cycles, and shifting policy priorities; US defense budgets around $850–900 billion in 2024–25 underscore sustained government spending that can drive demand for resilient satcom. Aligning with national resilience and disaster-response agendas can unlock scale, while tender rules and local content requirements shape competitiveness.
- Key buyers: emergency services, defense, public agencies
- Drivers: budgets, elections, policy priorities
- Opportunity: national resilience/disaster plans
- Constraints: tender rules, local content rules
Geopolitical instability and ground infrastructure
Ground stations and gateways are exposed to local political risks; conflict, expropriation, or regulatory clampdowns can sever links and disrupt Globalstar service continuity. Diversification of gateway locations and satellite routing redundancy reduce outage probability and recovery time. Insurance coverage and contingency planning are strategic necessities to protect revenue and customer SLAs.
- Local political risk to gateways
- Diversification and redundancy mitigate outages
- Insurance and contingency planning required
Global LEO MSS surge: wide coverage and defense demand meet sanctions and sovereignty risks
Globalstar: 120+ countries, 24 LEO satellites; access to S/L/MSS bands governed by ITU/WRC cycles; sanctions 2022–23 and rising digital-sovereignty rules (EU, India) limit markets; US defence spend ~850–900B (2024–25) fuels demand; gateway political risk requires redundancy, insurance, JV approvals.
| Metric | Value |
|---|---|
| Countries | 120+ |
| Satellites | 24 |
| US defence spend | $850–900B (24–25) |
What is included in the product
 Detailed Word Document
Explores how external macro-environmental factors uniquely affect Globalstar across six dimensions: Political, Economic, Social, Technological, Environmental, and Legal. Backed by current data and forward-looking insights, it helps executives, investors and strategists identify risks, opportunities and guide scenario-based planning.

 Customizable Excel Spreadsheet
Concise, visually segmented Globalstar PESTLE that distills external risks and opportunities into a one-page reference—easy to drop into presentations, share across teams, and annotate with region- or business-specific notes to speed strategic decisions and planning.
Economic factors

Capital intensity and constellation refresh
LEO fleets need heavy upfront capex and ongoing refreshes; industry estimates put Starlink cumulative capex at over $20B (est.), highlighting scale for operators like Globalstar. Vendor terms and launch pricing (Falcon 9 ~ $67M per mission in 2024; small-launch ~ $7–10M) materially affect cash flow and unit economics. Delays compress revenue windows and IRR, while phased deployments and JV/partner financing can smooth funding needs.
Pricing pressure and competitive landscape
Competing MSS incumbents and emerging NTN entrants such as Starlink (≈1.5 million subs by mid‑2024) are squeezing ARPU and gross margins as capacity-driven pricing falls; bundled deals with terrestrial carriers often trade price for scale via wholesale discounts of 20%–40% in industry tenders. Differentiation through coverage, latency and device ecosystem is essential, with price elasticity low for safety‑of‑life services and high for bulk IoT telemetry.

Macroeconomic cycles and IoT adoption
Enterprise capex, commodity cycles and logistics volumes directly shape device uptake as firms time IoT rollouts around spending cycles; Global IoT connections are forecast to approach 25 billion by 2025 (IDC/GSMA), underscoring large addressable demand. Deployments can pause in downturns but often resume under cost‑savings mandates where IoT drives efficiency. Countercyclical demand from compliance and safety, and diversified verticals, reduce revenue volatility for providers like Globalstar.

Currency and cross-border revenue mix
Globalstar's global billing exposes earnings to FX swings as revenues from roaming and IoT subscriptions are collected in multiple currencies while reporting and many costs are USD-denominated, creating margin pressure when the dollar strengthens; hedging programs and local-currency pricing help stabilize cash flow and margins. Contract indexing to inflation or USD preserves unit economics across markets.
- FX exposure: multi-currency revenues vs USD costs
- Mitigation: hedging and local pricing
- Protection: contract indexing preserves unit economics
Insurance, launch, and financing costs
Launch and in-orbit insurance premiums move sharply after market losses; industry reports showed insurer capacity tightening after 2020–24 anomalies, pushing some launch premiums into the mid-single-digit percentage range of insured value.
Higher interest rates (US fed funds ~5.25–5.50% through 2023–24) raised debt service on satellite capex; export credit, vendor financing and ECA support have been decisive for GSAT-class programs while supply-chain bottlenecks since 2020 lengthened lead times and raised unit costs.
- Insurance premiums: mid-single-digit % of insured value reported 2020–24
- Interest rates: fed funds ~5.25–5.50% in 2023–24 → higher debt service
- Financing: export credit/vendor financing can enable deals
- Supply: post-2020 constraints increased lead times and unit costs
Global LEO MSS surge: wide coverage and defense demand meet sanctions and sovereignty risks
LEO capex is large (Starlink est. cumulative spend >20B) and launch costs (Falcon 9 ≈67M; small launch 7–10M) plus higher insurance (mid single‑digit % of insured value) and Fed funds ~5.25–5.50% in 2023–24 raise financing costs. Competition (Starlink ≈1.5M subs mid‑2024) pressures ARPU; IoT demand (~25B connections by 2025) supports long‑term addressable market.
| Metric | Value | Implication |
|---|---|---|
| Starlink spend | >20B | Scale capex benchmark |
| Launch cost | 67M / 7–10M | Unit economics driver |
| Insurance | mid % | Operating expense |
| Fed funds | 5.25–5.50% | Higher debt service |
| IoT market | ~25B by 2025 | Large demand pool |
Same Document Delivered
Globalstar PESTLE Analysis
The preview shown here is the exact Globalstar PESTLE Analysis you’ll receive after purchase—fully formatted and ready to use. This real file includes the same structure, data and insights visible now, with no placeholders or teasers. After checkout you’ll instantly download this final, professionally prepared document.

Original: $10.00
-65%$10.00
$3.50Product Information
Product Information
Shipping & Returns
Shipping & Returns
Description
Plan Smarter. Present Sharper. Compete Stronger.
Unlock how political, economic, social, technological, legal and environmental forces are reshaping Globalstar’s outlook — actionable insights for investors, strategists, and advisors. Purchase the full PESTLE now for a ready-to-use, downloadable analysis to inform decisions and mitigate risk.
Political factors
Global spectrum and ITU coordination
Access to S-band (≈2.0–2.3 GHz), L-band (≈1.5–1.6 GHz) and MSS allocations hinges on ITU filings and national assignments; ITU World Radiocommunication Conferences occur every 3–4 years and set the timetable for changes. Coordination with other constellations and terrestrial 5G/BS operators is politically mediated and can take multiple years. Reallocation or refarming pressures from mobile broadband constrain growth and may force costly redesigns or sharing agreements. Proactive diplomacy and regulatory engagement are essential for continuity.
National security and sanctions exposure
Globalstar operates in 120+ countries with a 24-satellite LEO constellation, exposing it to jurisdictions with divergent stances on satellite communications. Sanctions and export-control expansions in 2022–23 have already limited access to some markets, suppliers and partnerships. Governments may impose lawful-intercept and resilience mandates that increase technical and contractual requirements. Political shifts can rapidly elevate compliance costs and commercial risk.
Landing rights and market access
Many jurisdictions require landing rights and domestic gateways to offer satellite services, and Globalstar already serves 120+ countries, so political clearance is material to rollout. Approvals can be delayed or compel joint ventures with local operators, raising capex and partnership risk. Rising digital sovereignty policies in regions like the EU and India are tightening gateway rules. Predictable access hinges on stable bilateral and regulatory relations.
Government procurement and public safety alignment
Emergency services, defense, and public agencies are core Globalstar customers, with procurement timing and scope tied to budgets, election cycles, and shifting policy priorities; US defense budgets around $850–900 billion in 2024–25 underscore sustained government spending that can drive demand for resilient satcom. Aligning with national resilience and disaster-response agendas can unlock scale, while tender rules and local content requirements shape competitiveness.
- Key buyers: emergency services, defense, public agencies
- Drivers: budgets, elections, policy priorities
- Opportunity: national resilience/disaster plans
- Constraints: tender rules, local content rules
Geopolitical instability and ground infrastructure
Ground stations and gateways are exposed to local political risks; conflict, expropriation, or regulatory clampdowns can sever links and disrupt Globalstar service continuity. Diversification of gateway locations and satellite routing redundancy reduce outage probability and recovery time. Insurance coverage and contingency planning are strategic necessities to protect revenue and customer SLAs.
- Local political risk to gateways
- Diversification and redundancy mitigate outages
- Insurance and contingency planning required
Global LEO MSS surge: wide coverage and defense demand meet sanctions and sovereignty risks
Globalstar: 120+ countries, 24 LEO satellites; access to S/L/MSS bands governed by ITU/WRC cycles; sanctions 2022–23 and rising digital-sovereignty rules (EU, India) limit markets; US defence spend ~850–900B (2024–25) fuels demand; gateway political risk requires redundancy, insurance, JV approvals.
| Metric | Value |
|---|---|
| Countries | 120+ |
| Satellites | 24 |
| US defence spend | $850–900B (24–25) |
What is included in the product
Detailed Word Document
Explores how external macro-environmental factors uniquely affect Globalstar across six dimensions: Political, Economic, Social, Technological, Environmental, and Legal. Backed by current data and forward-looking insights, it helps executives, investors and strategists identify risks, opportunities and guide scenario-based planning.
Customizable Excel Spreadsheet
Concise, visually segmented Globalstar PESTLE that distills external risks and opportunities into a one-page reference—easy to drop into presentations, share across teams, and annotate with region- or business-specific notes to speed strategic decisions and planning.
Economic factors
Capital intensity and constellation refresh
LEO fleets need heavy upfront capex and ongoing refreshes; industry estimates put Starlink cumulative capex at over $20B (est.), highlighting scale for operators like Globalstar. Vendor terms and launch pricing (Falcon 9 ~ $67M per mission in 2024; small-launch ~ $7–10M) materially affect cash flow and unit economics. Delays compress revenue windows and IRR, while phased deployments and JV/partner financing can smooth funding needs.
Pricing pressure and competitive landscape
Competing MSS incumbents and emerging NTN entrants such as Starlink (≈1.5 million subs by mid‑2024) are squeezing ARPU and gross margins as capacity-driven pricing falls; bundled deals with terrestrial carriers often trade price for scale via wholesale discounts of 20%–40% in industry tenders. Differentiation through coverage, latency and device ecosystem is essential, with price elasticity low for safety‑of‑life services and high for bulk IoT telemetry.
Macroeconomic cycles and IoT adoption
Enterprise capex, commodity cycles and logistics volumes directly shape device uptake as firms time IoT rollouts around spending cycles; Global IoT connections are forecast to approach 25 billion by 2025 (IDC/GSMA), underscoring large addressable demand. Deployments can pause in downturns but often resume under cost‑savings mandates where IoT drives efficiency. Countercyclical demand from compliance and safety, and diversified verticals, reduce revenue volatility for providers like Globalstar.
Currency and cross-border revenue mix
Globalstar's global billing exposes earnings to FX swings as revenues from roaming and IoT subscriptions are collected in multiple currencies while reporting and many costs are USD-denominated, creating margin pressure when the dollar strengthens; hedging programs and local-currency pricing help stabilize cash flow and margins. Contract indexing to inflation or USD preserves unit economics across markets.
- FX exposure: multi-currency revenues vs USD costs
- Mitigation: hedging and local pricing
- Protection: contract indexing preserves unit economics
Insurance, launch, and financing costs
Launch and in-orbit insurance premiums move sharply after market losses; industry reports showed insurer capacity tightening after 2020–24 anomalies, pushing some launch premiums into the mid-single-digit percentage range of insured value.
Higher interest rates (US fed funds ~5.25–5.50% through 2023–24) raised debt service on satellite capex; export credit, vendor financing and ECA support have been decisive for GSAT-class programs while supply-chain bottlenecks since 2020 lengthened lead times and raised unit costs.
- Insurance premiums: mid-single-digit % of insured value reported 2020–24
- Interest rates: fed funds ~5.25–5.50% in 2023–24 → higher debt service
- Financing: export credit/vendor financing can enable deals
- Supply: post-2020 constraints increased lead times and unit costs
Global LEO MSS surge: wide coverage and defense demand meet sanctions and sovereignty risks
LEO capex is large (Starlink est. cumulative spend >20B) and launch costs (Falcon 9 ≈67M; small launch 7–10M) plus higher insurance (mid single‑digit % of insured value) and Fed funds ~5.25–5.50% in 2023–24 raise financing costs. Competition (Starlink ≈1.5M subs mid‑2024) pressures ARPU; IoT demand (~25B connections by 2025) supports long‑term addressable market.
| Metric | Value | Implication |
|---|---|---|
| Starlink spend | >20B | Scale capex benchmark |
| Launch cost | 67M / 7–10M | Unit economics driver |
| Insurance | mid % | Operating expense |
| Fed funds | 5.25–5.50% | Higher debt service |
| IoT market | ~25B by 2025 | Large demand pool |
Same Document Delivered
Globalstar PESTLE Analysis
The preview shown here is the exact Globalstar PESTLE Analysis you’ll receive after purchase—fully formatted and ready to use. This real file includes the same structure, data and insights visible now, with no placeholders or teasers. After checkout you’ll instantly download this final, professionally prepared document.











