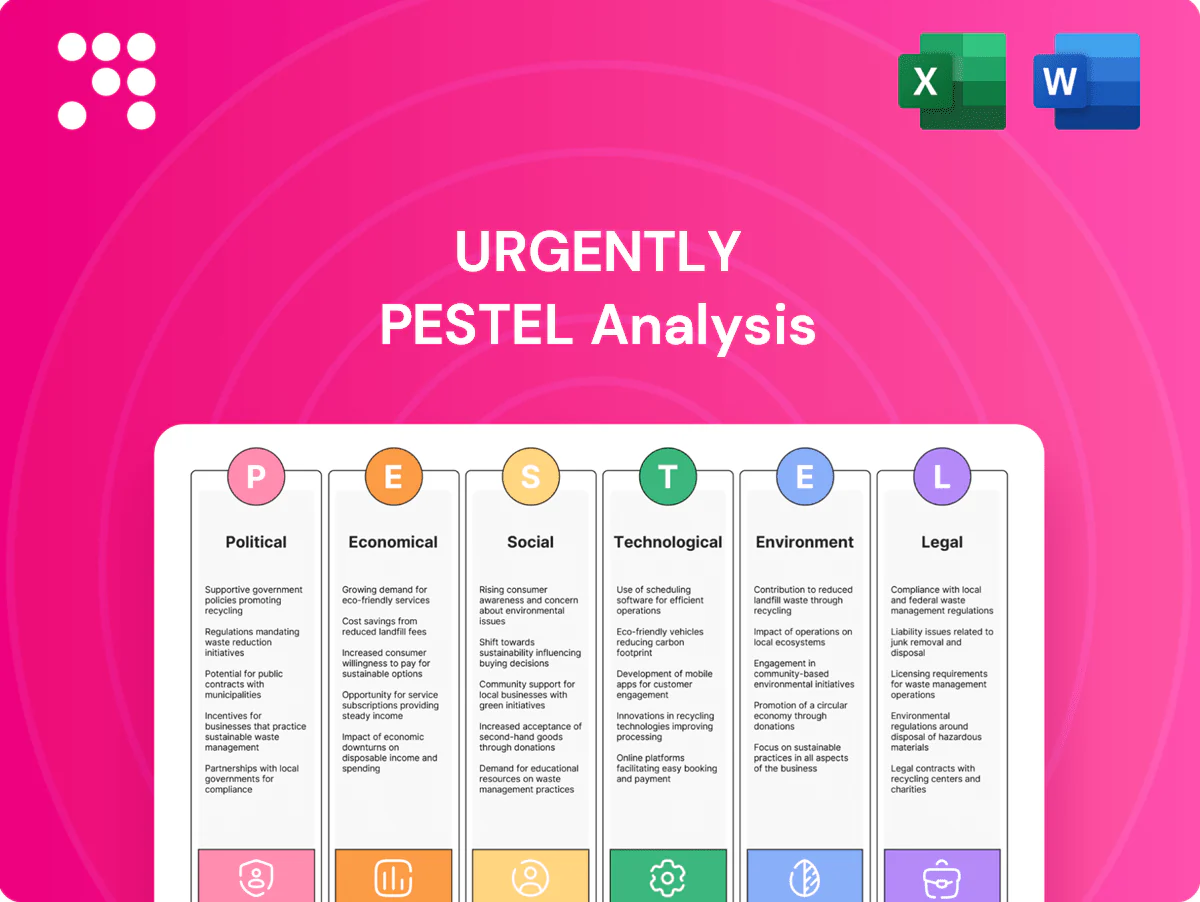
Urgently PESTLE Analysis

Plan Smarter. Present Sharper. Compete Stronger.
Gain a competitive edge with our PESTLE Analysis of Urgently, revealing the external forces shaping its future. We dissect political, economic, social, technological, legal and environmental risks and opportunities. Ideal for investors, advisors and strategists seeking actionable intelligence. Purchase the full report for the complete, ready-to-use analysis.
Political factors

Transportation policy and road safety priorities
Government emphasis on road safety and congestion management—backed by the $1.2 trillion Bipartisan Infrastructure Law and the $5 billion Safe Streets and Roads for All program—shapes funding and regulations that directly affect roadside operations. Policy incentives for connected vehicles and smart infrastructure accelerate integration and can cut response times through real‑time feeds. With U.S. traffic fatalities at about 42,915 in 2022 (roughly 10% above 2019), alignment with DOT goals can unlock pilots and grant funding, while budget shifts may restrict access to public data streams.
Public–private partnerships and emergency coordination
Coordination with police, DOTs, and emergency services shapes incident clearance protocols and tow permissions, directly affecting time-to-clear and highway throughput. Favorable policies institutionalize public–private partnership frameworks that expedite dispatch and lane reopening. Jurisdictional inconsistencies increase operational complexity and delay access. Formal MOUs bolster legitimacy and secure entry to controlled incident zones.

Infrastructure investment and regional disparities
National bills like the US 2021 Infrastructure Investment and Jobs Act (550 billion new spending; 110 billion for roads/bridges, 65 billion broadband) and comparable EU recovery funds accelerate ITS and sensor rollouts that feed real-time data; well-funded regions show richer telematics and 20–40% faster service turnaround. Underfunded areas raise ETAs and per-trip costs. Political prioritization of rural corridors can improve coverage economics, but long multi-year project cycles require modular, flexible deployments to capture interim data benefits.

Trade, cross-border, and local market rules
Operating across borders (U.S.–Canada, EU) forces compliance with divergent towing standards, permits and taxes; U.S.–Canada bilateral trade totaled $718.9 billion in 2023, underlining cross-border service scale. Localization mandates and data residency rules (65+ countries by 2024) shift architecture and vendor choice. Customs and equipment standards constrain parts availability for field partners and political shifts can tighten or relax service flows.
Labor policy and contractor frameworks
Regulation of gig/independent contractors reshapes supply and cost of providers; estimates in 2024 put US gig participation between 5–10% of workers, pressuring margins if reclassification occurs. Reclassification risks can raise benefits and admin costs by an estimated 10–30% for affected platforms; state minimum wage and overtime rules (varied across 50 states) complicate pricing. Proactive compliance limits political and reputational exposure.
- Regulation impact: supply, cost, margins
- Reclassification risk: +10–30% benefits/admin costs
- State rules: varying minimum wage/overtime
- Mitigation: proactive compliance reduces political/reputational risk
Grants, trade and data rules strain supply; platform costs may rise 10-30%
Federal infrastructure funding (eg. $1.2T Bipartisan Infrastructure Law; $5B SS4A) and DOT road‑safety targets (42,915 US traffic deaths in 2022) drive grants, ITS rollout and public–private pilots but uneven budgets raise regional ETA gaps. Cross‑border trade ($718.9B US–Canada 2023) and 65+ data‑localization countries (2024) force localization and supply constraints. Gig worker reclassification risk could raise platform costs 10–30% and complicate pricing.
| Metric | Value |
|---|---|
| US traffic deaths (2022) | 42,915 |
| Bipartisan Infrastructure Law | $1.2T |
| SS4A | $5B |
| US–Canada trade (2023) | $718.9B |
| Data localization (2024) | 65+ countries |
| Reclassification cost impact | +10–30% |
What is included in the product
 Detailed Word Document
Explores how external macro-environmental factors uniquely affect Urgently across Political, Economic, Social, Technological, Environmental and Legal dimensions, with each section backed by current data and trends to identify threats and opportunities. Designed for executives and investors, it provides region- and industry-specific, forward-looking insights ready for business plans and scenario planning.

 Customizable Excel Spreadsheet
A concise, visually segmented PESTLE brief that distills external risks and opportunities for quick sharing, editing and drop‑in use in presentations, enabling fast alignment across teams and clearer strategic decisions during urgent planning sessions.
Economic factors

Miles driven and macro cycles
Vehicle miles traveled (US VMT ~3.3 trillion miles in 2023) correlate closely with incident volume and service revenue, with crashes and breakdowns rising as miles rise. Recessions trim discretionary travel but aging fleets increase breakdown rates—2008 saw VMT drop ~5% while repair demand stayed. Fuel price swings (US retail avg ~$3.50/gal in 2023) shift trip lengths and service mix, so firms need elastic capacity and dynamic pricing to protect margins.
Insurance and OEM partnership economics
Carrier and automaker contracts drive volume predictability and margins through guaranteed dispatch volumes and tiered pricing, often structured as multi-year (commonly 3–5 year) agreements that stabilize cash flows amid demand volatility.
Bundled roadside in policies or warranties compresses per-incident revenue but lowers customer acquisition cost by shifting acquisition to insurers or OEMs, while SLA penalties and bonus pools—frequently linked to on-time and first-time-fix metrics—strongly influence dispatch prioritization.

Provider supply, utilization, and unit economics
Provider availability sets ETAs and fulfillment: real-world dispatch systems target 15–30 minute ETAs with acceptance-driven fulfillment rates near 85% in peak markets. Optimizing deadhead miles, job stacking, and zonal pricing has been shown to lift margins roughly 8–12% in fleet trials. Inflationary pressure—wage growth near 4% and parts/vehicle cost increases—squeezes payouts, so incentive design must raise acceptance without exceeding break-even thresholds.

Capital intensity and technology ROI
Platform investments in AI, mapping and integrations must pay back via faster ETAs and higher NPS; pilots in 2024 reported ETA accuracy gains up to 25% and NPS lifts of 5–10 points, while automation cut per-dispatch overheads and call-center volume by about 30%.
- API monetization: new revenue streams (5–15%)
- Tight credit: 2024 Fed funds ~5.25–5.50% slows fleet upgrades
Seasonality and catastrophic events
Winter freezes, heatwaves and holiday peaks produce predictable spikes that can raise service demand 30–50% and strain capacity; NOAA recorded 28 US billion-dollar weather/climate disasters in 2023, driving surge pricing but also 20–40% higher cancellation and customer-care costs after CAT events. Inventory of batteries, tires and jump packs directly improves first-time-fix rates; accurate forecasting cut overtime and SLA breaches by up to 25% in pilot programs.
- Season peaks: predictable 30–50% demand spike
- CAT impact: 28 US billion-dollar disasters in 2023
- Costs: 20–40% higher cancellations/customer-care after CATs
- Inventory: batteries/tires/jump packs raise first-time-fix
- Forecasting: up to 25% reduction in overtime/SLA breaches
Grants, trade and data rules strain supply; platform costs may rise 10-30%
Rising US VMT (3.3T miles in 2023) and fuel volatility (US avg ~$3.50/gal in 2023) drive incident volume and margin pressure; tight credit (Fed funds 5.25–5.50% in 2024) delays fleet renewals. Contracts and bundled warranties stabilize revenue but compress per-incident yield; platform AI and routing lift ETA accuracy (~25%) and margins (8–12%). CATs (28 US billion-dollar events in 2023) spike demand 30–50% and raise post-event costs 20–40%.
| Metric | 2023–24 |
|---|---|
| US VMT | 3.3T mi |
| Fuel avg | $3.50/gal |
| Fed funds | 5.25–5.50% |
| CATs | 28 events |
Same Document Delivered
Urgently PESTLE Analysis
The preview shown here is the exact Urgently PESTLE Analysis document you’ll receive after purchase—fully formatted, professionally structured, and ready to use. This screenshot reflects the real file you’re buying with no placeholders or teasers. After payment you’ll instantly download this identical, finished report to apply in strategy, risk assessment, or decision-making.

Original: $10.00
-65%$10.00
$3.50Product Information
Product Information
Shipping & Returns
Shipping & Returns
Description
Plan Smarter. Present Sharper. Compete Stronger.
Gain a competitive edge with our PESTLE Analysis of Urgently, revealing the external forces shaping its future. We dissect political, economic, social, technological, legal and environmental risks and opportunities. Ideal for investors, advisors and strategists seeking actionable intelligence. Purchase the full report for the complete, ready-to-use analysis.
Political factors
Transportation policy and road safety priorities
Government emphasis on road safety and congestion management—backed by the $1.2 trillion Bipartisan Infrastructure Law and the $5 billion Safe Streets and Roads for All program—shapes funding and regulations that directly affect roadside operations. Policy incentives for connected vehicles and smart infrastructure accelerate integration and can cut response times through real‑time feeds. With U.S. traffic fatalities at about 42,915 in 2022 (roughly 10% above 2019), alignment with DOT goals can unlock pilots and grant funding, while budget shifts may restrict access to public data streams.
Public–private partnerships and emergency coordination
Coordination with police, DOTs, and emergency services shapes incident clearance protocols and tow permissions, directly affecting time-to-clear and highway throughput. Favorable policies institutionalize public–private partnership frameworks that expedite dispatch and lane reopening. Jurisdictional inconsistencies increase operational complexity and delay access. Formal MOUs bolster legitimacy and secure entry to controlled incident zones.
Infrastructure investment and regional disparities
National bills like the US 2021 Infrastructure Investment and Jobs Act (550 billion new spending; 110 billion for roads/bridges, 65 billion broadband) and comparable EU recovery funds accelerate ITS and sensor rollouts that feed real-time data; well-funded regions show richer telematics and 20–40% faster service turnaround. Underfunded areas raise ETAs and per-trip costs. Political prioritization of rural corridors can improve coverage economics, but long multi-year project cycles require modular, flexible deployments to capture interim data benefits.
Trade, cross-border, and local market rules
Operating across borders (U.S.–Canada, EU) forces compliance with divergent towing standards, permits and taxes; U.S.–Canada bilateral trade totaled $718.9 billion in 2023, underlining cross-border service scale. Localization mandates and data residency rules (65+ countries by 2024) shift architecture and vendor choice. Customs and equipment standards constrain parts availability for field partners and political shifts can tighten or relax service flows.
Labor policy and contractor frameworks
Regulation of gig/independent contractors reshapes supply and cost of providers; estimates in 2024 put US gig participation between 5–10% of workers, pressuring margins if reclassification occurs. Reclassification risks can raise benefits and admin costs by an estimated 10–30% for affected platforms; state minimum wage and overtime rules (varied across 50 states) complicate pricing. Proactive compliance limits political and reputational exposure.
- Regulation impact: supply, cost, margins
- Reclassification risk: +10–30% benefits/admin costs
- State rules: varying minimum wage/overtime
- Mitigation: proactive compliance reduces political/reputational risk
Grants, trade and data rules strain supply; platform costs may rise 10-30%
Federal infrastructure funding (eg. $1.2T Bipartisan Infrastructure Law; $5B SS4A) and DOT road‑safety targets (42,915 US traffic deaths in 2022) drive grants, ITS rollout and public–private pilots but uneven budgets raise regional ETA gaps. Cross‑border trade ($718.9B US–Canada 2023) and 65+ data‑localization countries (2024) force localization and supply constraints. Gig worker reclassification risk could raise platform costs 10–30% and complicate pricing.
| Metric | Value |
|---|---|
| US traffic deaths (2022) | 42,915 |
| Bipartisan Infrastructure Law | $1.2T |
| SS4A | $5B |
| US–Canada trade (2023) | $718.9B |
| Data localization (2024) | 65+ countries |
| Reclassification cost impact | +10–30% |
What is included in the product
Detailed Word Document
Explores how external macro-environmental factors uniquely affect Urgently across Political, Economic, Social, Technological, Environmental and Legal dimensions, with each section backed by current data and trends to identify threats and opportunities. Designed for executives and investors, it provides region- and industry-specific, forward-looking insights ready for business plans and scenario planning.
Customizable Excel Spreadsheet
A concise, visually segmented PESTLE brief that distills external risks and opportunities for quick sharing, editing and drop‑in use in presentations, enabling fast alignment across teams and clearer strategic decisions during urgent planning sessions.
Economic factors
Miles driven and macro cycles
Vehicle miles traveled (US VMT ~3.3 trillion miles in 2023) correlate closely with incident volume and service revenue, with crashes and breakdowns rising as miles rise. Recessions trim discretionary travel but aging fleets increase breakdown rates—2008 saw VMT drop ~5% while repair demand stayed. Fuel price swings (US retail avg ~$3.50/gal in 2023) shift trip lengths and service mix, so firms need elastic capacity and dynamic pricing to protect margins.
Insurance and OEM partnership economics
Carrier and automaker contracts drive volume predictability and margins through guaranteed dispatch volumes and tiered pricing, often structured as multi-year (commonly 3–5 year) agreements that stabilize cash flows amid demand volatility.
Bundled roadside in policies or warranties compresses per-incident revenue but lowers customer acquisition cost by shifting acquisition to insurers or OEMs, while SLA penalties and bonus pools—frequently linked to on-time and first-time-fix metrics—strongly influence dispatch prioritization.
Provider supply, utilization, and unit economics
Provider availability sets ETAs and fulfillment: real-world dispatch systems target 15–30 minute ETAs with acceptance-driven fulfillment rates near 85% in peak markets. Optimizing deadhead miles, job stacking, and zonal pricing has been shown to lift margins roughly 8–12% in fleet trials. Inflationary pressure—wage growth near 4% and parts/vehicle cost increases—squeezes payouts, so incentive design must raise acceptance without exceeding break-even thresholds.
Capital intensity and technology ROI
Platform investments in AI, mapping and integrations must pay back via faster ETAs and higher NPS; pilots in 2024 reported ETA accuracy gains up to 25% and NPS lifts of 5–10 points, while automation cut per-dispatch overheads and call-center volume by about 30%.
- API monetization: new revenue streams (5–15%)
- Tight credit: 2024 Fed funds ~5.25–5.50% slows fleet upgrades
Seasonality and catastrophic events
Winter freezes, heatwaves and holiday peaks produce predictable spikes that can raise service demand 30–50% and strain capacity; NOAA recorded 28 US billion-dollar weather/climate disasters in 2023, driving surge pricing but also 20–40% higher cancellation and customer-care costs after CAT events. Inventory of batteries, tires and jump packs directly improves first-time-fix rates; accurate forecasting cut overtime and SLA breaches by up to 25% in pilot programs.
- Season peaks: predictable 30–50% demand spike
- CAT impact: 28 US billion-dollar disasters in 2023
- Costs: 20–40% higher cancellations/customer-care after CATs
- Inventory: batteries/tires/jump packs raise first-time-fix
- Forecasting: up to 25% reduction in overtime/SLA breaches
Grants, trade and data rules strain supply; platform costs may rise 10-30%
Rising US VMT (3.3T miles in 2023) and fuel volatility (US avg ~$3.50/gal in 2023) drive incident volume and margin pressure; tight credit (Fed funds 5.25–5.50% in 2024) delays fleet renewals. Contracts and bundled warranties stabilize revenue but compress per-incident yield; platform AI and routing lift ETA accuracy (~25%) and margins (8–12%). CATs (28 US billion-dollar events in 2023) spike demand 30–50% and raise post-event costs 20–40%.
| Metric | 2023–24 |
|---|---|
| US VMT | 3.3T mi |
| Fuel avg | $3.50/gal |
| Fed funds | 5.25–5.50% |
| CATs | 28 events |
Same Document Delivered
Urgently PESTLE Analysis
The preview shown here is the exact Urgently PESTLE Analysis document you’ll receive after purchase—fully formatted, professionally structured, and ready to use. This screenshot reflects the real file you’re buying with no placeholders or teasers. After payment you’ll instantly download this identical, finished report to apply in strategy, risk assessment, or decision-making.











