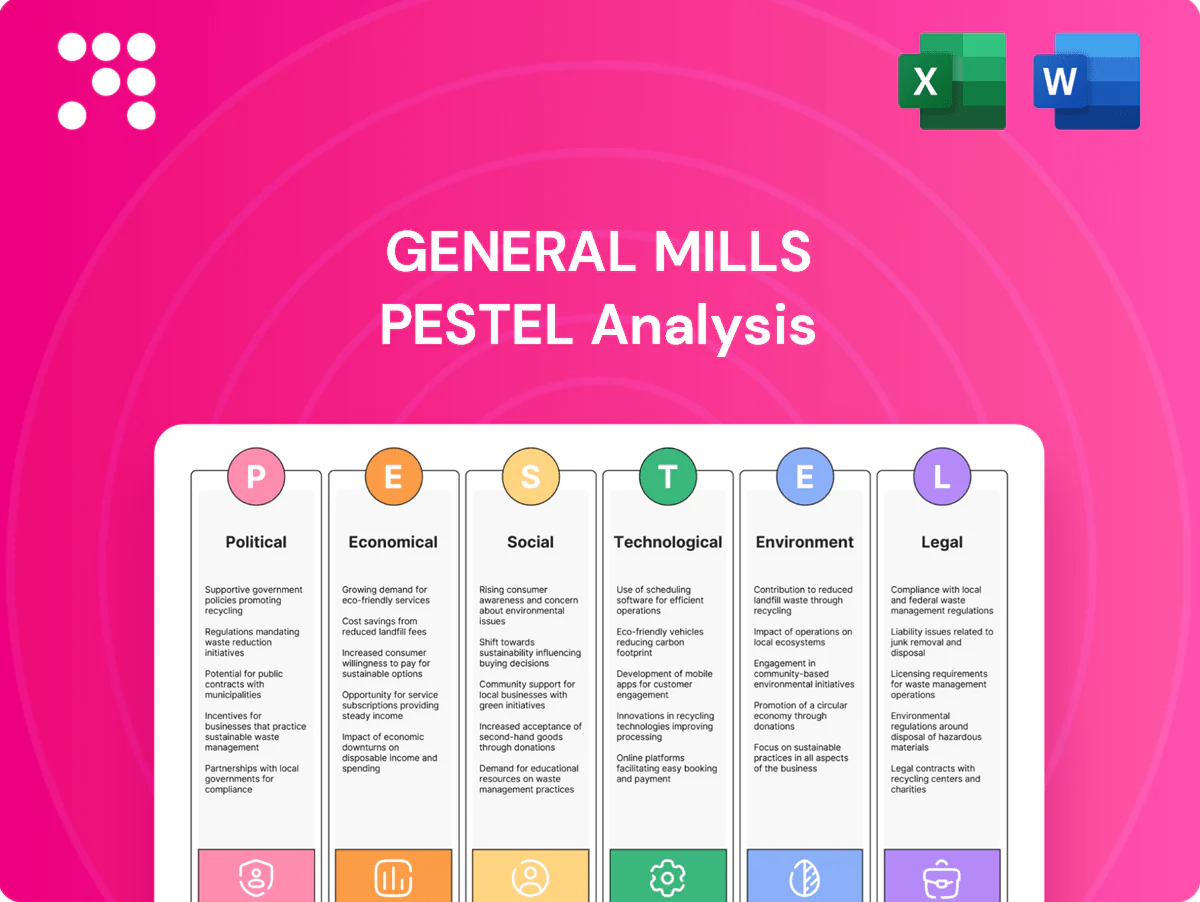
General Mills PESTLE Analysis

Skip the Research. Get the Strategy.
Unlock how political shifts, supply-chain economics, and sustainability trends are reshaping General Mills' strategy in our concise PESTLE snapshot. These external forces reveal risks and growth opportunities critical for investors and strategists. Purchase the full PESTLE analysis to access the complete, actionable breakdown instantly.
Political factors

Trade and tariff volatility
Global cereals, dairy and packaging inputs for General Mills face shifting tariffs and quotas that alter landed costs and pricing power; US applied tariffs averaged about 3.4% (WTO 2023) and recent retaliatory measures raised costs on select imports by double‑digits. Trade tensions disrupted cross‑border flows in 2023–24, prompting higher inventory buffers and supplier switches. Preferential trade agreements offer material cost and market‑access advantages, requiring dynamic hedging and sourcing strategies.
Agricultural subsidy regimes
Government farm supports shape grain availability and price stability for inputs like corn, wheat and oats; USDA projected a 2024 US season-average corn price near 4.60 per bushel, which directly affects General Mills input costs and margins.
Redesigns to subsidy rules can shift planted acres toward subsidized crops, altering crop mix and quality for branded cereals and snacks and influencing ingredient sourcing costs.
Export incentives and tariffs in major producers—seen after Black Sea disruptions that reduced wheat flows by roughly 30–40% in 2022–23—move global benchmarks and procurement timing.
Monitoring multi-year policy cycles and announced program budgets enables more accurate hedging and procurement planning to protect gross margins.

Food policy and nutrition agendas
National nutrition guidance such as the US Dietary Guidelines 2020-2025 and WHO recommendations (free sugars <10% of energy) steer General Mills formulation and portfolio choices. Sugar, sodium and whole‑grain targets—USDA requires at least half grains be whole‑grain rich in school meals—influence reformulation roadmaps. The National School Lunch Program serves ~29 million children daily, so breakfast and school‑meal policy can expand or restrict categories. Engagement with policymakers helps anticipate requirement changes.

Excise taxes on sugar and HFSS
- coverage: over 40 jurisdictions (2024)
- tax impact: +10–20% shelf price
- elasticity: ≈−0.8
- mitigation: portion control, reformulation, healthier lines
Geopolitical and supply security
Conflicts and sanctions that hit grain corridors (the Black Sea supplies about 12% of seaborne wheat) have reduced flows—the 2022 disruption cut exports sharply—while elevated energy prices (Brent averaged ~86 USD/bbl in 2024) and volatile ocean freight rates strain reliability; sudden export bans or port closures raise service-level and counterparty risks. Political instability in key sourcing regions increases logistics exposure; multi-region suppliers and nearshoring preserve continuity.
- 12% — Black Sea share of seaborne wheat
- ~86 USD/bbl — Brent 2024 avg
- Export bans/closures — spur immediate service risk
- Mitigation — multi-region sourcing, nearshoring
Tariffs at 3.4%, HFSS levies and Black Sea shock force sourcing shifts
Tariffs and trade tensions (US avg tariff 3.4% WTO 2023) raise landed costs and force inventory/sourcing shifts. Farm supports and commodity moves (USDA 2024 corn ≈4.60/bu) drive input-price volatility and planting mix. HFSS levies in 40+ jurisdictions (+10–20% shelf price) and Black Sea disruptions (≈12% seaborne wheat) pressure reformulation, hedging and nearshoring.
| Metric | Value | Impact |
|---|---|---|
| US tariffs | 3.4% (2023) | higher costs |
| Corn | $4.60/bu (2024) | input margin |
| HFSS reach | 40+ jurisdictions | tax/pricing |
| Black Sea | 12% seaborne wheat | supply risk |
What is included in the product
 Detailed Word Document
Explores how external macro-environmental factors uniquely affect General Mills across six dimensions—Political, Economic, Social, Technological, Environmental and Legal—each backed by relevant data and trends to identify threats and opportunities for executives, consultants and investors, with forward-looking insights for strategy and scenario planning.

 Customizable Excel Spreadsheet
A concise, PESTLE-organized summary of external risks and opportunities specific to General Mills, ideal for meetings or strategy workshops; editable notes and shareable format speed cross-team alignment and decision-making.
Economic factors

Commodity price cycles
Volatility in grains, dairy, oils and corrugate drives gross margin variability for General Mills; CBOT corn futures traded roughly $4–8/bu across 2022–24 and Class III milk futures topped $30/cwt in 2022 before normalizing. Futures hedging smooths earnings but cannot eliminate short-term spikes. Input inflation forced pricing actions and pack-size architecture changes, with food price inflation still running above core CPI in 2023–24. Shift toward premium or value tiers materially alters net revenue management.
Consumer spending and trade-down
Macroeconomic slowdowns—US inflation eased to about 3.4% in 2024—push shoppers toward private label and club-pack formats as seen in strong Costco FY2024 net sales of $242.3 billion. Strong brands like General Mills can retain loyalty but must justify price gaps through clear product benefits and innovation. Retailers ramp up promotions to drive traffic, increasing promotional intensity. Elasticity-informed pricing and optimized pack-price architecture preserve share and margins.

Foreign exchange exposure
General Mills faces FX translation and transaction risk from roughly $3.3 billion in international sales—about 17% of FY2024 net sales of $19.1 billion—so dollar strength can dilute reported revenue even as it lowers costs for imported inputs. Local pricing power and active hedging programs limit margin swings. Strategic geographic mix management further stabilizes earnings against currency volatility.

Retailer consolidation power
E-commerce and DTC growth
E-commerce penetration in US grocery reached about 12% in 2024, expanding shelf-infinite competition and intensifying price transparency across channels. Basket economics and last-mile fees (typically $4–8 per order) force pack reconfiguration and compress margins. Search visibility and retail media (global spend ~60 billion in 2024) increasingly drive conversion and premium placement. Subscription and bundle strategies measurably lift customer lifetime value.
- online-penetration: ~12% (US, 2024)
- last-mile-cost: $4–8/order
- retail-media-spend: ~$60B (global, 2024)
- bundle/subscription: higher LTV and retention
Tariffs at 3.4%, HFSS levies and Black Sea shock force sourcing shifts
Volatile commodities (CBOT corn $4–8/bu 2022–24; Class III milk >$30/cwt in 2022) drive margin swings despite hedging. Slower CPI (≈3.4% 2024) shifts shoppers to value, raising promo intensity. FX, large-retailer leverage (~50% market) and e-commerce (~12% US 2024) compress pricing power; pricing architecture and SKU mix defend share.
| Metric | Value |
|---|---|
| FY2024 net sales | $19.1B |
| US e‑commerce | ~12% |
| Retailer market share | ~50% |
Preview Before You Purchase
General Mills PESTLE Analysis
The preview shown here is the exact General Mills PESTLE Analysis you’ll receive after purchase—fully formatted and ready to use. This is the final version with no placeholders or teasers, delivered exactly as displayed. The layout, content, and structure are identical to the downloadable file.

Product Information
Product Information
Shipping & Returns
Shipping & Returns
Description
Skip the Research. Get the Strategy.
Unlock how political shifts, supply-chain economics, and sustainability trends are reshaping General Mills' strategy in our concise PESTLE snapshot. These external forces reveal risks and growth opportunities critical for investors and strategists. Purchase the full PESTLE analysis to access the complete, actionable breakdown instantly.
Political factors
Trade and tariff volatility
Global cereals, dairy and packaging inputs for General Mills face shifting tariffs and quotas that alter landed costs and pricing power; US applied tariffs averaged about 3.4% (WTO 2023) and recent retaliatory measures raised costs on select imports by double‑digits. Trade tensions disrupted cross‑border flows in 2023–24, prompting higher inventory buffers and supplier switches. Preferential trade agreements offer material cost and market‑access advantages, requiring dynamic hedging and sourcing strategies.
Agricultural subsidy regimes
Government farm supports shape grain availability and price stability for inputs like corn, wheat and oats; USDA projected a 2024 US season-average corn price near 4.60 per bushel, which directly affects General Mills input costs and margins.
Redesigns to subsidy rules can shift planted acres toward subsidized crops, altering crop mix and quality for branded cereals and snacks and influencing ingredient sourcing costs.
Export incentives and tariffs in major producers—seen after Black Sea disruptions that reduced wheat flows by roughly 30–40% in 2022–23—move global benchmarks and procurement timing.
Monitoring multi-year policy cycles and announced program budgets enables more accurate hedging and procurement planning to protect gross margins.
Food policy and nutrition agendas
National nutrition guidance such as the US Dietary Guidelines 2020-2025 and WHO recommendations (free sugars <10% of energy) steer General Mills formulation and portfolio choices. Sugar, sodium and whole‑grain targets—USDA requires at least half grains be whole‑grain rich in school meals—influence reformulation roadmaps. The National School Lunch Program serves ~29 million children daily, so breakfast and school‑meal policy can expand or restrict categories. Engagement with policymakers helps anticipate requirement changes.
Excise taxes on sugar and HFSS
- coverage: over 40 jurisdictions (2024)
- tax impact: +10–20% shelf price
- elasticity: ≈−0.8
- mitigation: portion control, reformulation, healthier lines
Geopolitical and supply security
Conflicts and sanctions that hit grain corridors (the Black Sea supplies about 12% of seaborne wheat) have reduced flows—the 2022 disruption cut exports sharply—while elevated energy prices (Brent averaged ~86 USD/bbl in 2024) and volatile ocean freight rates strain reliability; sudden export bans or port closures raise service-level and counterparty risks. Political instability in key sourcing regions increases logistics exposure; multi-region suppliers and nearshoring preserve continuity.
- 12% — Black Sea share of seaborne wheat
- ~86 USD/bbl — Brent 2024 avg
- Export bans/closures — spur immediate service risk
- Mitigation — multi-region sourcing, nearshoring
Tariffs at 3.4%, HFSS levies and Black Sea shock force sourcing shifts
Tariffs and trade tensions (US avg tariff 3.4% WTO 2023) raise landed costs and force inventory/sourcing shifts. Farm supports and commodity moves (USDA 2024 corn ≈4.60/bu) drive input-price volatility and planting mix. HFSS levies in 40+ jurisdictions (+10–20% shelf price) and Black Sea disruptions (≈12% seaborne wheat) pressure reformulation, hedging and nearshoring.
| Metric | Value | Impact |
|---|---|---|
| US tariffs | 3.4% (2023) | higher costs |
| Corn | $4.60/bu (2024) | input margin |
| HFSS reach | 40+ jurisdictions | tax/pricing |
| Black Sea | 12% seaborne wheat | supply risk |
What is included in the product
Detailed Word Document
Explores how external macro-environmental factors uniquely affect General Mills across six dimensions—Political, Economic, Social, Technological, Environmental and Legal—each backed by relevant data and trends to identify threats and opportunities for executives, consultants and investors, with forward-looking insights for strategy and scenario planning.
Customizable Excel Spreadsheet
A concise, PESTLE-organized summary of external risks and opportunities specific to General Mills, ideal for meetings or strategy workshops; editable notes and shareable format speed cross-team alignment and decision-making.
Economic factors
Commodity price cycles
Volatility in grains, dairy, oils and corrugate drives gross margin variability for General Mills; CBOT corn futures traded roughly $4–8/bu across 2022–24 and Class III milk futures topped $30/cwt in 2022 before normalizing. Futures hedging smooths earnings but cannot eliminate short-term spikes. Input inflation forced pricing actions and pack-size architecture changes, with food price inflation still running above core CPI in 2023–24. Shift toward premium or value tiers materially alters net revenue management.
Consumer spending and trade-down
Macroeconomic slowdowns—US inflation eased to about 3.4% in 2024—push shoppers toward private label and club-pack formats as seen in strong Costco FY2024 net sales of $242.3 billion. Strong brands like General Mills can retain loyalty but must justify price gaps through clear product benefits and innovation. Retailers ramp up promotions to drive traffic, increasing promotional intensity. Elasticity-informed pricing and optimized pack-price architecture preserve share and margins.
Foreign exchange exposure
General Mills faces FX translation and transaction risk from roughly $3.3 billion in international sales—about 17% of FY2024 net sales of $19.1 billion—so dollar strength can dilute reported revenue even as it lowers costs for imported inputs. Local pricing power and active hedging programs limit margin swings. Strategic geographic mix management further stabilizes earnings against currency volatility.
Retailer consolidation power
E-commerce and DTC growth
E-commerce penetration in US grocery reached about 12% in 2024, expanding shelf-infinite competition and intensifying price transparency across channels. Basket economics and last-mile fees (typically $4–8 per order) force pack reconfiguration and compress margins. Search visibility and retail media (global spend ~60 billion in 2024) increasingly drive conversion and premium placement. Subscription and bundle strategies measurably lift customer lifetime value.
- online-penetration: ~12% (US, 2024)
- last-mile-cost: $4–8/order
- retail-media-spend: ~$60B (global, 2024)
- bundle/subscription: higher LTV and retention
Tariffs at 3.4%, HFSS levies and Black Sea shock force sourcing shifts
Volatile commodities (CBOT corn $4–8/bu 2022–24; Class III milk >$30/cwt in 2022) drive margin swings despite hedging. Slower CPI (≈3.4% 2024) shifts shoppers to value, raising promo intensity. FX, large-retailer leverage (~50% market) and e-commerce (~12% US 2024) compress pricing power; pricing architecture and SKU mix defend share.
| Metric | Value |
|---|---|
| FY2024 net sales | $19.1B |
| US e‑commerce | ~12% |
| Retailer market share | ~50% |
Preview Before You Purchase
General Mills PESTLE Analysis
The preview shown here is the exact General Mills PESTLE Analysis you’ll receive after purchase—fully formatted and ready to use. This is the final version with no placeholders or teasers, delivered exactly as displayed. The layout, content, and structure are identical to the downloadable file.











