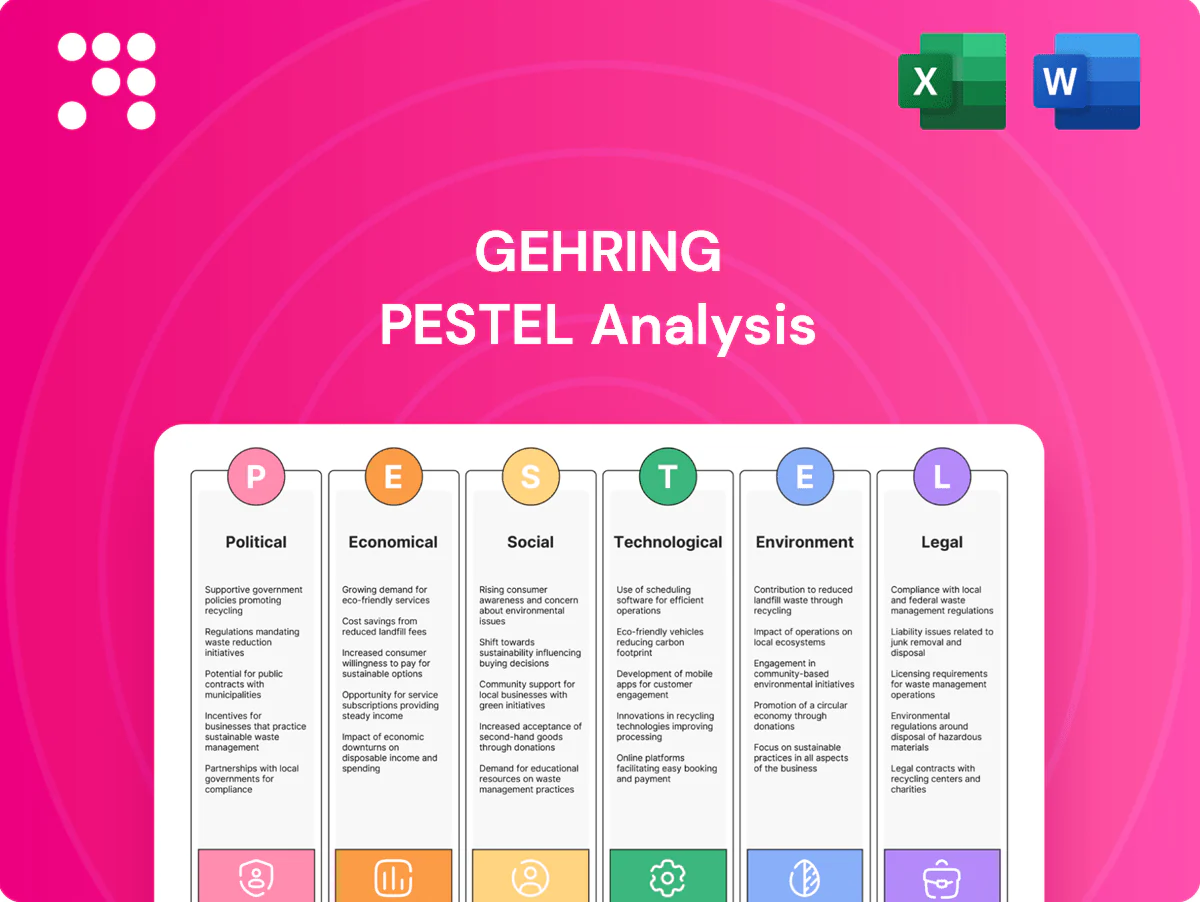
Gehring PESTLE Analysis

Your Competitive Advantage Starts with This Report
Discover how political shifts, economic cycles, social trends, technological advances, legal changes, and environmental pressures are reshaping Gehring’s prospects in our concise PESTLE snapshot. Ideal for investors and strategists, this analysis reveals risk levers and growth opportunities—buy the full PESTLE to access the complete, actionable intelligence instantly.
Political factors

EU industrial policy and subsidies
Shifts in EU funding for advanced manufacturing and clean tech, driven by Horizon Europe (€95.5bn for 2021–27) and NextGenerationEU (≈€807bn), directly influence customers’ capital purchases and Gehring’s R&D priorities. Incentives for efficiency and automation can accelerate adoption of new honing lines; the EU industrial automation market is projected to grow at ~7% CAGR to 2028. Conversely, subsidy gaps between member states skew competitive dynamics and pricing power, so monitoring national aid rules and IPCEI eligibility is essential to align bids and partnerships.
Trade policy and tariffs
Tariffs such as the US 25% steel and 10% aluminum measures and varying duties on machine tools and electronics can raise BOM costs by an estimated 5–10% and force higher export pricing; customs frictions between the EU, US, China and others commonly add 3–10 business days to lead times. Localization and multi-country sourcing have cut import exposure from some OEMs by ~40%, while FTAs (eg EU–Japan, CPTPP members) widen market access but demand strict compliance and documentation.

Geopolitical supply chain risk
Sanctions, export controls and regional conflicts have delayed critical PLCs and components, with lead times for industrial drives and sensors often stretching by months (up to six months) after the 2020–22 disruption wave. Dual-sourcing plus buffer inventory for drives, sensors and abrasives materially improve resilience and are now standard in supplier playbooks. Procurement briefs increasingly require formal risk-mitigation plans in tenders; political stability (World Bank Political Stability index -2.5 to 2.5) at install sites also shapes service delivery and uptime guarantees.

Energy policy and industrial power costs
- energy-mix impact on TCO
- efficiency incentives steer procurement
- demand-response yields 5–15% savings
- carbon price €90–€110/t raises efficiency value
ICE vs. electrification policy direction
Combustion engine phase-out timelines (EU ban on new ICE cars from 2035, UK 2030/2035 mix, California ZEV target 2035; US federal EO 14057: new light-duty acquisitions ZEV by 2027) will materially reduce core ICE demand and shift OEM sourcing cycles. Policies favoring hybrids, hydrogen ICE and e-axles create adjacent honing and superfinishing revenue streams; government fleet rules can trigger sudden batch orders or cancellations, so clear policy timelines are critical for portfolio balance between ICE and e-mobility components.
- EU 2035 ban: supply chain shift
- UK 2030/2035: accelerated mix
- US Fed EO 14057: ZEV buys by 2027
- Hydrogen/hybrid policy demand: new gearset opportunities
EU funding, tariffs and carbon pricing reshape e-mobility costs and supply timelines
EU funding (Horizon Europe €95.5bn; NextGenerationEU ≈€807bn) and national subsidies steer R&D and capex timing, while tariffs (US steel 25%) and export controls add 5–10% BOM risk and months of lead-time. ICE phase-outs (EU 2035, UK 2030/35, US EO14057) shift demand to e-mobility. Energy/carbon costs (€0.21/kWh; EU ETS €90–€110/t) raise TCO and favor efficient designs.
| Factor | Key metric |
|---|---|
| EU funding | €95.5bn / €807bn |
| Tariffs/BOM | +5–10% |
| Energy | €0.21/kWh |
| Carbon | €90–€110/t |
What is included in the product
 Detailed Word Document
Explores how Political, Economic, Social, Technological, Environmental and Legal forces uniquely impact Gehring’s operations and market position, with each section supported by current data and industry-specific examples to surface risks, opportunities and actionable scenario insights for executives and investors.

 Customizable Excel Spreadsheet
A concise, visually segmented Gehring PESTLE summary for quick referencing in meetings or slides, easily editable for region- or business-specific notes and shareable across teams to streamline risk discussions and strategic alignment.
Economic factors

Automotive cycle sensitivity
OEM and Tier-1 capex tracks vehicle and powertrain programs, with global light-vehicle production near 75.8 million units in 2024 driving program spend; downcycles delay line upgrades and overhauls while new launches trigger rush orders and spike short-term demand. Aftermarket services—roughly a $400 billion global market in 2024—partially cushions OEM downturns. Diversifying into non-automotive precision parts smooths revenue volatility across cycles.
FX and input cost volatility
EUR trading near 1.09 USD and around 7.9 CNY (July 2025) shifts export margins and imported component costs for Gehring; a 5-10% EUR move materially alters USD/CNY-priced parts. Copper at ~9,500 USD/t and EU HRC steel near 700 EUR/t with ±15% swings compress project IRRs. Hedging and indexation clauses have cut realized margin volatility, and supplier framework agreements lock >50% input volumes on long contracts.

Interest rates and financing
Higher policy rates — US Fed funds ~5.25–5.50% and ECB deposit ~4.00% in 2024–25 — raise customers’ internal hurdle rates for capex approvals, slowing purchases. Vendor financing, leasing or service-based models can accelerate closes by shifting upfront cost and aligning payback. Internal WACC differentials drive make-or-buy on subassemblies. Offering stable, credit-favorable financing terms becomes a clear competitive lever in bids.

Capacity utilization and lead times
Backlog health and factory throughput directly determine delivery promises; sustained high utilization tightens windows while gaps relax them.
Bottlenecks in machining, controls integration, or commissioning disproportionately extend lead times and erode margin.
Predictable schedules improve cash conversion by shortening receivable cycles, and modular platforms reduce engineering hours per order, boosting throughput.
- Backlog governs delivery
- Bottlenecks extend lead times
- Schedule predictability aids cash conversion
- Modular platforms cut engineering hours
Global demand mix
APAC drives growth, accounting for roughly 50% of global machine-tool and precision- machining demand in 2023, contrasting with mature EU markets (~20% share) and a cyclical North America (~15%). Gehring’s exposure across automotive, aerospace, hydraulics and general engineering reduces concentration risk. Localized service hubs capture up to 25% of lifecycle revenue. Pricing power varies by region and by application criticality.
- APAC ~50%
- EU ~20%
- NA ~15%
- Aftermarket/service up to 25%
EU funding, tariffs and carbon pricing reshape e-mobility costs and supply timelines
OEM/Tier‑1 capex tied to ~75.8M light‑vehicle production in 2024 drives program spend while aftermarket (~$400B in 2024) cushions cycles. EUR ~1.09/USD and CNY ~7.9 (Jul 2025) shift margins; raw materials (copper ~$9,500/t, EU HRC ~700 EUR/t) and rates (Fed funds ~5.25–5.50%, ECB ~4.0%) compress IRRs and slow capex approvals.
| Metric | Value | Impact |
|---|---|---|
| LV prod 2024 | 75.8M | Drives capex |
| Aftermarket 2024 | $400B | Revenue buffer |
| EUR/USD (Jul 2025) | 1.09 | Export margins |
Preview the Actual Deliverable
Gehring PESTLE Analysis
The preview shown here is the exact Gehring PESTLE Analysis document you’ll receive after purchase—fully formatted and ready to use. The layout, content, and structure visible are identical to the downloadable file delivered immediately after payment. No placeholders or teasers—this is the final, professionally structured file you’ll own upon checkout.

Product Information
Product Information
Shipping & Returns
Shipping & Returns
Description
Your Competitive Advantage Starts with This Report
Discover how political shifts, economic cycles, social trends, technological advances, legal changes, and environmental pressures are reshaping Gehring’s prospects in our concise PESTLE snapshot. Ideal for investors and strategists, this analysis reveals risk levers and growth opportunities—buy the full PESTLE to access the complete, actionable intelligence instantly.
Political factors
EU industrial policy and subsidies
Shifts in EU funding for advanced manufacturing and clean tech, driven by Horizon Europe (€95.5bn for 2021–27) and NextGenerationEU (≈€807bn), directly influence customers’ capital purchases and Gehring’s R&D priorities. Incentives for efficiency and automation can accelerate adoption of new honing lines; the EU industrial automation market is projected to grow at ~7% CAGR to 2028. Conversely, subsidy gaps between member states skew competitive dynamics and pricing power, so monitoring national aid rules and IPCEI eligibility is essential to align bids and partnerships.
Trade policy and tariffs
Tariffs such as the US 25% steel and 10% aluminum measures and varying duties on machine tools and electronics can raise BOM costs by an estimated 5–10% and force higher export pricing; customs frictions between the EU, US, China and others commonly add 3–10 business days to lead times. Localization and multi-country sourcing have cut import exposure from some OEMs by ~40%, while FTAs (eg EU–Japan, CPTPP members) widen market access but demand strict compliance and documentation.
Geopolitical supply chain risk
Sanctions, export controls and regional conflicts have delayed critical PLCs and components, with lead times for industrial drives and sensors often stretching by months (up to six months) after the 2020–22 disruption wave. Dual-sourcing plus buffer inventory for drives, sensors and abrasives materially improve resilience and are now standard in supplier playbooks. Procurement briefs increasingly require formal risk-mitigation plans in tenders; political stability (World Bank Political Stability index -2.5 to 2.5) at install sites also shapes service delivery and uptime guarantees.
Energy policy and industrial power costs
- energy-mix impact on TCO
- efficiency incentives steer procurement
- demand-response yields 5–15% savings
- carbon price €90–€110/t raises efficiency value
ICE vs. electrification policy direction
Combustion engine phase-out timelines (EU ban on new ICE cars from 2035, UK 2030/2035 mix, California ZEV target 2035; US federal EO 14057: new light-duty acquisitions ZEV by 2027) will materially reduce core ICE demand and shift OEM sourcing cycles. Policies favoring hybrids, hydrogen ICE and e-axles create adjacent honing and superfinishing revenue streams; government fleet rules can trigger sudden batch orders or cancellations, so clear policy timelines are critical for portfolio balance between ICE and e-mobility components.
- EU 2035 ban: supply chain shift
- UK 2030/2035: accelerated mix
- US Fed EO 14057: ZEV buys by 2027
- Hydrogen/hybrid policy demand: new gearset opportunities
EU funding, tariffs and carbon pricing reshape e-mobility costs and supply timelines
EU funding (Horizon Europe €95.5bn; NextGenerationEU ≈€807bn) and national subsidies steer R&D and capex timing, while tariffs (US steel 25%) and export controls add 5–10% BOM risk and months of lead-time. ICE phase-outs (EU 2035, UK 2030/35, US EO14057) shift demand to e-mobility. Energy/carbon costs (€0.21/kWh; EU ETS €90–€110/t) raise TCO and favor efficient designs.
| Factor | Key metric |
|---|---|
| EU funding | €95.5bn / €807bn |
| Tariffs/BOM | +5–10% |
| Energy | €0.21/kWh |
| Carbon | €90–€110/t |
What is included in the product
Detailed Word Document
Explores how Political, Economic, Social, Technological, Environmental and Legal forces uniquely impact Gehring’s operations and market position, with each section supported by current data and industry-specific examples to surface risks, opportunities and actionable scenario insights for executives and investors.
Customizable Excel Spreadsheet
A concise, visually segmented Gehring PESTLE summary for quick referencing in meetings or slides, easily editable for region- or business-specific notes and shareable across teams to streamline risk discussions and strategic alignment.
Economic factors
Automotive cycle sensitivity
OEM and Tier-1 capex tracks vehicle and powertrain programs, with global light-vehicle production near 75.8 million units in 2024 driving program spend; downcycles delay line upgrades and overhauls while new launches trigger rush orders and spike short-term demand. Aftermarket services—roughly a $400 billion global market in 2024—partially cushions OEM downturns. Diversifying into non-automotive precision parts smooths revenue volatility across cycles.
FX and input cost volatility
EUR trading near 1.09 USD and around 7.9 CNY (July 2025) shifts export margins and imported component costs for Gehring; a 5-10% EUR move materially alters USD/CNY-priced parts. Copper at ~9,500 USD/t and EU HRC steel near 700 EUR/t with ±15% swings compress project IRRs. Hedging and indexation clauses have cut realized margin volatility, and supplier framework agreements lock >50% input volumes on long contracts.
Interest rates and financing
Higher policy rates — US Fed funds ~5.25–5.50% and ECB deposit ~4.00% in 2024–25 — raise customers’ internal hurdle rates for capex approvals, slowing purchases. Vendor financing, leasing or service-based models can accelerate closes by shifting upfront cost and aligning payback. Internal WACC differentials drive make-or-buy on subassemblies. Offering stable, credit-favorable financing terms becomes a clear competitive lever in bids.
Capacity utilization and lead times
Backlog health and factory throughput directly determine delivery promises; sustained high utilization tightens windows while gaps relax them.
Bottlenecks in machining, controls integration, or commissioning disproportionately extend lead times and erode margin.
Predictable schedules improve cash conversion by shortening receivable cycles, and modular platforms reduce engineering hours per order, boosting throughput.
- Backlog governs delivery
- Bottlenecks extend lead times
- Schedule predictability aids cash conversion
- Modular platforms cut engineering hours
Global demand mix
APAC drives growth, accounting for roughly 50% of global machine-tool and precision- machining demand in 2023, contrasting with mature EU markets (~20% share) and a cyclical North America (~15%). Gehring’s exposure across automotive, aerospace, hydraulics and general engineering reduces concentration risk. Localized service hubs capture up to 25% of lifecycle revenue. Pricing power varies by region and by application criticality.
- APAC ~50%
- EU ~20%
- NA ~15%
- Aftermarket/service up to 25%
EU funding, tariffs and carbon pricing reshape e-mobility costs and supply timelines
OEM/Tier‑1 capex tied to ~75.8M light‑vehicle production in 2024 drives program spend while aftermarket (~$400B in 2024) cushions cycles. EUR ~1.09/USD and CNY ~7.9 (Jul 2025) shift margins; raw materials (copper ~$9,500/t, EU HRC ~700 EUR/t) and rates (Fed funds ~5.25–5.50%, ECB ~4.0%) compress IRRs and slow capex approvals.
| Metric | Value | Impact |
|---|---|---|
| LV prod 2024 | 75.8M | Drives capex |
| Aftermarket 2024 | $400B | Revenue buffer |
| EUR/USD (Jul 2025) | 1.09 | Export margins |
Preview the Actual Deliverable
Gehring PESTLE Analysis
The preview shown here is the exact Gehring PESTLE Analysis document you’ll receive after purchase—fully formatted and ready to use. The layout, content, and structure visible are identical to the downloadable file delivered immediately after payment. No placeholders or teasers—this is the final, professionally structured file you’ll own upon checkout.











