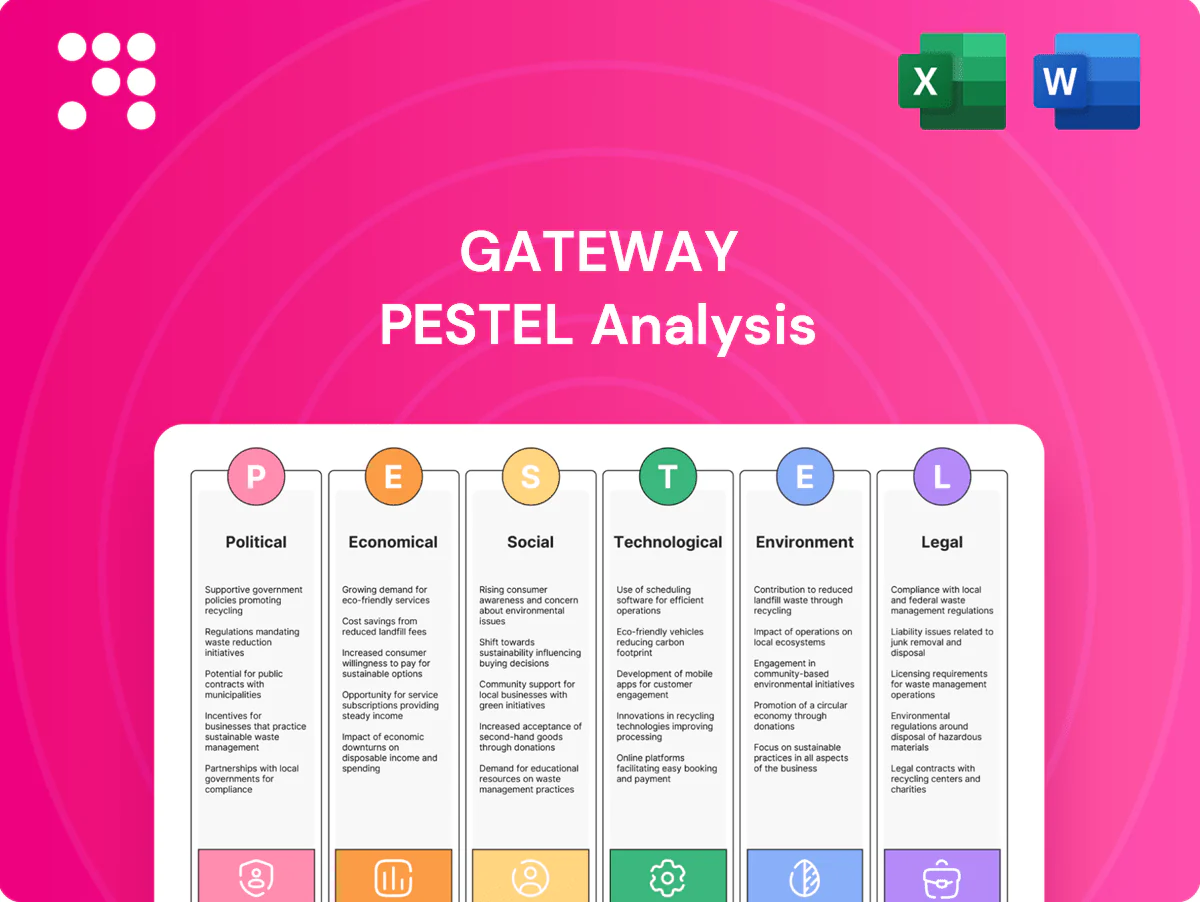
Gateway PESTLE Analysis

Skip the Research. Get the Strategy.
Unlock how political shifts, economic trends, and technological change are reshaping Gateway’s outlook with our tailored PESTLE Analysis. This concise briefing highlights key external risks and opportunities to inform investment and strategic decisions. Purchase the full report for actionable, fully editable insights and the detailed data you need to act with confidence.
Political factors

Trade policy, customs and port governance
Shifts in import/export duties, FTAs and customs procedures directly change CFS/ICD throughput and dwell times, with single-window adoption now implemented in over 100 economies accelerating clearance cycles. Government ease-of-doing-business pushes can cut clearance by days, while port privatization—led by operators like DP World (active in 60+ countries)—alters tariffs and berth priority, reshaping inland evacuation. Geopolitical disruptions (Red Sea route risks 2023–24) force ad-hoc controls and rerouting Gateway must absorb.
National Logistics Policy and Gati Shakti
Policy-led multimodal integration under the National Logistics Policy (2022) and PM Gati Shakti (2021) prioritizes rail-linked ICDs and improved first/last-mile connectivity.
Alignment with Dedicated Freight Corridors, totaling about 3,360 km (Eastern + Western DFCs), can unlock longer-haul rail volumes and improve schedule reliability.
Incentives for logistics parks and PM MITRA-type clusters (7 PM MITRA parks announced) help anchor cargo near facilities.
Realized benefits will hinge on execution pace and state-level adoption given India’s logistics cost of roughly 13–14% of GDP.

Infrastructure spending and PPP frameworks
Central/state capex—notably Indian Railways completing 100% broad‑gauge electrification in April 2023 and Bharatmala Phase I allocating Rs 5.35 lakh crore for highways (2021–26)—reshapes network cost curves by lowering loco fuel and haulage costs and enabling longer sidings. PPP terminal and wagon models set access charges and ROIC benchmarks, altering tariff pass‑throughs. Policy stability on user charges and viability gap funding determines bankability of 10–20 year contracts; reversals or delays can strand assets or defer expansions.

Regional and geopolitical risk
Trade-lane disruptions re-route containers and shift modal balance; the Suez Canal still handles about 12% of global trade by value and Red Sea reroutes have added up to 4,000 nm and ~14 days to voyages. Sanctions and export controls reclassify cargo and raise compliance overhead. Border dynamics shape ICD flows to hinterlands; political instability in source/destination markets reduces volume visibility.
- Trade reroutes: Suez ~12% value, reroutes +4,000 nm/+14 days
- Sanctions: higher classification/compliance burden
- Borders: ICD flow volatility to hinterlands
- Stability: sourcing/destination risk lowers volume visibility
State-level regulatory heterogeneity
State-level differences in logistics policies, warehousing incentives and truck movement rules materially affect node throughput and costs; US industrial vacancy averaged about 4.3% in Q4 2024, highlighting tight markets that amplify regulatory impact.
Local permitting and land acquisition often add months to schedules, differential power tariffs can shift operating margins, and seamless rail-road interfaces require coordination across multiple state agencies.
Political shifts reshape logistics: 100+ SW, 3,360 km DFCs, 13–14% GDP
Political shifts alter tariffs, clearances and modal mix: single-window in 100+ economies speeds clearance; DFCs 3,360 km boost rail capacity; logistics cost ~13–14% of GDP; Suez handles ~12% value and Red Sea reroutes added ~14 days. State policy variance and permitting (months) drive node throughput and project bankability; PM MITRA 7 parks, US industrial vacancy 4.3% (Q4 2024).
| Factor | Metric | Impact |
|---|---|---|
| Clearance | 100+ SW economies | -days clearance |
| Rail | 3,360 km DFC | higher rail volumes |
| Costs | 13–14% GDP | logistics drag |
What is included in the product
 Detailed Word Document
Explores how external macro-environmental factors uniquely affect the Gateway across six dimensions—Political, Economic, Social, Technological, Environmental, and Legal—backed by current data and trends to identify risks and opportunities. Designed for executives, consultants, and entrepreneurs, it includes detailed sub-points, forward-looking insights for scenario planning, and clean formatting ready for reports, decks, or funding materials.

 Customizable Excel Spreadsheet
A concise, visually segmented Gateway PESTLE summary that’s easily shareable and editable, enabling quick alignment across teams, simplifying discussions on external risks and market positioning, and ready to drop into presentations, client reports, or planning sessions.
Economic factors

Trade volume cycles and GDP growth
CFS/ICD throughput tracks merchandise trade closely: global goods volumes were forecast to grow 1.7% in 2024 (WTO), while India’s merchandise exports reached about $447.8bn in FY2023–24, so export downcycles in textiles, engineering goods and chemicals cut yields and storage revenue. Import rebounds raise congestion risk but lift ancillary revenues, and Gateway’s rail share (~28% modal freight in India) can partially offset road softness in downturns.
Fuel, power and inflation dynamics
Diesel at roughly $3.80/gal and industrial electricity near $0.12/kWh drive linehaul and warehousing margins, often comprising 20–35% of unit costs. Inflation (US CPI 2024: 3.4%) squeezes contracted rates unless indexation exists. Energy volatility favors rail, which is 3–4x more fuel‑efficient than trucks on long hauls. Proactive hedging and efficiency programs protect unit economics.

Currency and interest rates
INR volatility (USD/INR ~82–83 in 2024–25) raises import costs, worsens container imbalances and pressures export competitiveness; India merchandise exports were $448bn in FY24. Higher rates (RBI repo ~6.5% mid‑2024) lift financing costs for wagons, rakes and real estate, slowing procurement. FX swings shift customer sourcing and corridor volumes. Stable access to funding is critical for capex‑heavy rail plans (₹2.4 lakh crore target 2024–25).

Container availability and freight rates
Global container cycles drive empties repositioning and CFS/ICD yields as peaks in demand tighten availability and push dwell times up, while ocean freight rate spikes often reroute cargo to nearer gateways, shifting volumes between ports. Rail haulage pricing must adapt to carrier surcharges and BAF adjustments, and balanced box flows improve turnaround and asset utilization, lowering unit costs.
- Cycle volatility → higher reposition costs
- Rate spikes → modal/port diversion
- Rail surcharges/BAF → tariff resets
- Balanced flows → faster turns, better asset ROI
Manufacturing and consumption shifts
PLI outlay of 1.97 lakh crore for 14 sectors and e-commerce GMV above $100B shift commodity mix toward electronics and consumer goods, increasing demand for temperature-controlled and multi-tenant warehousing. Nearshoring and friend-shoring trends can raise export ICD volumes, while seasonal spikes force flexible capacity and extra rakes. Industrial corridor builds anchor long-term cargo basins as India merchandise exports reached about $450B in FY24.
- PLI outlay 1.97 lakh crore
- E-commerce GMV > $100B
- Seasonal spikes require flexible capacity + extra rakes
- Industrial corridors create stable cargo basins
Political shifts reshape logistics: 100+ SW, 3,360 km DFCs, 13–14% GDP
Trade growth (WTO 2024 +1.7%) and India exports ~$448B (FY24) drive CFS/ICD volumes; import rebounds raise congestion but boost ancillaries. Diesel ~$3.80/gal, power ~$0.12/kWh and RBI repo ~6.5% (mid‑2024) compress margins; INR ~82–83 adds FX risk. PLI ₹1.97L cr and e‑commerce GMV >$100B shift demand to cold/multi‑tenant warehousing; rail modal ~28% cushions road weakness.
| Metric | Value |
|---|---|
| India exports FY24 | $448B |
| Diesel | $3.80/gal |
| RBI repo | ~6.5% |
| INR | 82–83 |
| PLI outlay | ₹1.97L crore |
| E‑commerce GMV | >$100B |
Preview the Actual Deliverable
Gateway PESTLE Analysis
The preview shown here is the exact Gateway PESTLE Analysis you’ll receive after purchase—fully formatted and ready to use. The layout, content, and structure visible are identical to the downloadable file, with no placeholders or teasers. After checkout you’ll instantly get this exact, professionally structured document.

Original: $10.00
-65%$10.00
$3.50Product Information
Product Information
Shipping & Returns
Shipping & Returns
Description
Skip the Research. Get the Strategy.
Unlock how political shifts, economic trends, and technological change are reshaping Gateway’s outlook with our tailored PESTLE Analysis. This concise briefing highlights key external risks and opportunities to inform investment and strategic decisions. Purchase the full report for actionable, fully editable insights and the detailed data you need to act with confidence.
Political factors
Trade policy, customs and port governance
Shifts in import/export duties, FTAs and customs procedures directly change CFS/ICD throughput and dwell times, with single-window adoption now implemented in over 100 economies accelerating clearance cycles. Government ease-of-doing-business pushes can cut clearance by days, while port privatization—led by operators like DP World (active in 60+ countries)—alters tariffs and berth priority, reshaping inland evacuation. Geopolitical disruptions (Red Sea route risks 2023–24) force ad-hoc controls and rerouting Gateway must absorb.
National Logistics Policy and Gati Shakti
Policy-led multimodal integration under the National Logistics Policy (2022) and PM Gati Shakti (2021) prioritizes rail-linked ICDs and improved first/last-mile connectivity.
Alignment with Dedicated Freight Corridors, totaling about 3,360 km (Eastern + Western DFCs), can unlock longer-haul rail volumes and improve schedule reliability.
Incentives for logistics parks and PM MITRA-type clusters (7 PM MITRA parks announced) help anchor cargo near facilities.
Realized benefits will hinge on execution pace and state-level adoption given India’s logistics cost of roughly 13–14% of GDP.
Infrastructure spending and PPP frameworks
Central/state capex—notably Indian Railways completing 100% broad‑gauge electrification in April 2023 and Bharatmala Phase I allocating Rs 5.35 lakh crore for highways (2021–26)—reshapes network cost curves by lowering loco fuel and haulage costs and enabling longer sidings. PPP terminal and wagon models set access charges and ROIC benchmarks, altering tariff pass‑throughs. Policy stability on user charges and viability gap funding determines bankability of 10–20 year contracts; reversals or delays can strand assets or defer expansions.
Regional and geopolitical risk
Trade-lane disruptions re-route containers and shift modal balance; the Suez Canal still handles about 12% of global trade by value and Red Sea reroutes have added up to 4,000 nm and ~14 days to voyages. Sanctions and export controls reclassify cargo and raise compliance overhead. Border dynamics shape ICD flows to hinterlands; political instability in source/destination markets reduces volume visibility.
- Trade reroutes: Suez ~12% value, reroutes +4,000 nm/+14 days
- Sanctions: higher classification/compliance burden
- Borders: ICD flow volatility to hinterlands
- Stability: sourcing/destination risk lowers volume visibility
State-level regulatory heterogeneity
State-level differences in logistics policies, warehousing incentives and truck movement rules materially affect node throughput and costs; US industrial vacancy averaged about 4.3% in Q4 2024, highlighting tight markets that amplify regulatory impact.
Local permitting and land acquisition often add months to schedules, differential power tariffs can shift operating margins, and seamless rail-road interfaces require coordination across multiple state agencies.
Political shifts reshape logistics: 100+ SW, 3,360 km DFCs, 13–14% GDP
Political shifts alter tariffs, clearances and modal mix: single-window in 100+ economies speeds clearance; DFCs 3,360 km boost rail capacity; logistics cost ~13–14% of GDP; Suez handles ~12% value and Red Sea reroutes added ~14 days. State policy variance and permitting (months) drive node throughput and project bankability; PM MITRA 7 parks, US industrial vacancy 4.3% (Q4 2024).
| Factor | Metric | Impact |
|---|---|---|
| Clearance | 100+ SW economies | -days clearance |
| Rail | 3,360 km DFC | higher rail volumes |
| Costs | 13–14% GDP | logistics drag |
What is included in the product
Detailed Word Document
Explores how external macro-environmental factors uniquely affect the Gateway across six dimensions—Political, Economic, Social, Technological, Environmental, and Legal—backed by current data and trends to identify risks and opportunities. Designed for executives, consultants, and entrepreneurs, it includes detailed sub-points, forward-looking insights for scenario planning, and clean formatting ready for reports, decks, or funding materials.
Customizable Excel Spreadsheet
A concise, visually segmented Gateway PESTLE summary that’s easily shareable and editable, enabling quick alignment across teams, simplifying discussions on external risks and market positioning, and ready to drop into presentations, client reports, or planning sessions.
Economic factors
Trade volume cycles and GDP growth
CFS/ICD throughput tracks merchandise trade closely: global goods volumes were forecast to grow 1.7% in 2024 (WTO), while India’s merchandise exports reached about $447.8bn in FY2023–24, so export downcycles in textiles, engineering goods and chemicals cut yields and storage revenue. Import rebounds raise congestion risk but lift ancillary revenues, and Gateway’s rail share (~28% modal freight in India) can partially offset road softness in downturns.
Fuel, power and inflation dynamics
Diesel at roughly $3.80/gal and industrial electricity near $0.12/kWh drive linehaul and warehousing margins, often comprising 20–35% of unit costs. Inflation (US CPI 2024: 3.4%) squeezes contracted rates unless indexation exists. Energy volatility favors rail, which is 3–4x more fuel‑efficient than trucks on long hauls. Proactive hedging and efficiency programs protect unit economics.
Currency and interest rates
INR volatility (USD/INR ~82–83 in 2024–25) raises import costs, worsens container imbalances and pressures export competitiveness; India merchandise exports were $448bn in FY24. Higher rates (RBI repo ~6.5% mid‑2024) lift financing costs for wagons, rakes and real estate, slowing procurement. FX swings shift customer sourcing and corridor volumes. Stable access to funding is critical for capex‑heavy rail plans (₹2.4 lakh crore target 2024–25).
Container availability and freight rates
Global container cycles drive empties repositioning and CFS/ICD yields as peaks in demand tighten availability and push dwell times up, while ocean freight rate spikes often reroute cargo to nearer gateways, shifting volumes between ports. Rail haulage pricing must adapt to carrier surcharges and BAF adjustments, and balanced box flows improve turnaround and asset utilization, lowering unit costs.
- Cycle volatility → higher reposition costs
- Rate spikes → modal/port diversion
- Rail surcharges/BAF → tariff resets
- Balanced flows → faster turns, better asset ROI
Manufacturing and consumption shifts
PLI outlay of 1.97 lakh crore for 14 sectors and e-commerce GMV above $100B shift commodity mix toward electronics and consumer goods, increasing demand for temperature-controlled and multi-tenant warehousing. Nearshoring and friend-shoring trends can raise export ICD volumes, while seasonal spikes force flexible capacity and extra rakes. Industrial corridor builds anchor long-term cargo basins as India merchandise exports reached about $450B in FY24.
- PLI outlay 1.97 lakh crore
- E-commerce GMV > $100B
- Seasonal spikes require flexible capacity + extra rakes
- Industrial corridors create stable cargo basins
Political shifts reshape logistics: 100+ SW, 3,360 km DFCs, 13–14% GDP
Trade growth (WTO 2024 +1.7%) and India exports ~$448B (FY24) drive CFS/ICD volumes; import rebounds raise congestion but boost ancillaries. Diesel ~$3.80/gal, power ~$0.12/kWh and RBI repo ~6.5% (mid‑2024) compress margins; INR ~82–83 adds FX risk. PLI ₹1.97L cr and e‑commerce GMV >$100B shift demand to cold/multi‑tenant warehousing; rail modal ~28% cushions road weakness.
| Metric | Value |
|---|---|
| India exports FY24 | $448B |
| Diesel | $3.80/gal |
| RBI repo | ~6.5% |
| INR | 82–83 |
| PLI outlay | ₹1.97L crore |
| E‑commerce GMV | >$100B |
Preview the Actual Deliverable
Gateway PESTLE Analysis
The preview shown here is the exact Gateway PESTLE Analysis you’ll receive after purchase—fully formatted and ready to use. The layout, content, and structure visible are identical to the downloadable file, with no placeholders or teasers. After checkout you’ll instantly get this exact, professionally structured document.











