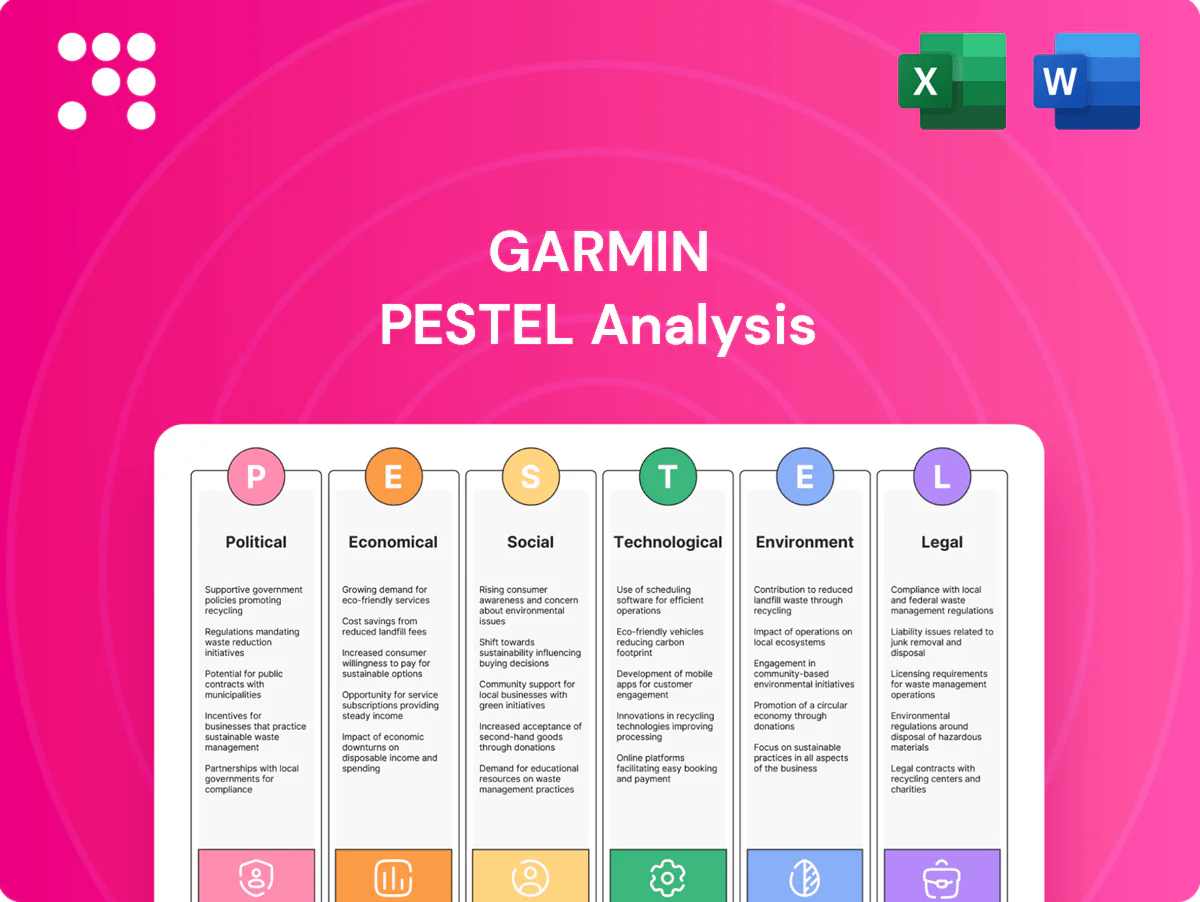
Garmin PESTLE Analysis

Your Shortcut to Market Insight Starts Here
Discover how political shifts, economic trends, social behaviors, technological advances, legal changes, and environmental pressures are shaping Garmin’s strategic path in our concise PESTLE overview. This targeted snapshot highlights risks and opportunities for investors, strategists, and product leaders. Buy the full PESTLE analysis to get the complete, actionable breakdown ready for immediate use.
Political factors

Trade policy and tariffs
Garmin’s global hardware footprint is exposed to import duties across the U.S., EU and Asia; U.S. Section 301 tariffs on many Chinese electronics remain up to 25%, directly raising bill-of-materials costs. Tariff swings force pricing adjustments and can compress margins, so diversifying manufacturing and using FTAs (USMCA, CPTPP, EU FTAs) mitigates risk. Ongoing geopolitical tensions reshape logistics routes and lengthen lead times, raising inventory and delivery costs.
GNSS and spectrum governance
Access to GPS (31 satellites), Galileo (24), GLONASS (24) and BeiDou (35) is governed by national policies and spectrum allocations, affecting Garmin hardware access and features. Jamming and spoofing incidents, plus defense priorities, drive export controls and mandated countermeasures. L‑band spectrum re‑farming debates risk degrading receiver performance, making compliance and targeted lobbying critical to protect signal integrity.

Aviation and marine agency influence
FAA, EASA and maritime authorities set standards that directly affect Garmin flight decks, avionics and marine electronics; certification often adds 12–36 months to product timelines and drove the ADS-B upgrade affecting over 200,000 GA aircraft. Political shifts can accelerate or slow these pipelines, while safety mandates expand addressable markets but raise compliance costs. Public procurement timing, influenced by multi-year budgets (US DoD FY2024 ~$858B), shapes demand cadence.

Localization and industrial policy
Governments increasingly mandate local content, data localization, or national champions, with 60+ countries having data localization or related rules by 2024; this forces Garmin into regional assembly or JV partnerships to qualify for public tenders. Incentives such as tax breaks or grants can materially lower upfront capex but add procurement and compliance burden. Non-compliance risks exclusion from strategic programs and tenders.
- Local content mandates: market access requirement
- Data localization: 60+ countries (2024)
- Incentives: lower capex, higher admin
- Risk: exclusion from tenders/programs
Sanctions and export controls
Sanctions and export controls restrict sales of Garmin navigation systems to sanctioned states and entities; U.S. EAR and ITAR are primary regimes that expanded dual-use coverage in the 2020s and can require licenses for advanced GNSS/IMU features, creating approval delays and channel uncertainty as restricted-party lists update frequently.
- EAR/ITAR: U.S. primary regimes
- Dual-use limits sales to sanctioned entities
- Lists change regularly → channel uncertainty
- Mitigation: strict screening + configurable variants
Section 301 tariffs up to 25% raise BOM/margin risk; GNSS, certification delays & DoD pressure
Garmin faces up to 25% Section 301 tariffs raising BOM costs and margin risk; diversifying production and FTAs mitigate exposure. GNSS access (GPS 31, Galileo 24, GLONASS 24, BeiDou 35) plus jamming/spoofing and L‑band debates drive compliance and lobbying. Certification (FAA/EASA) adds 12–36 months; ADS‑B impacted 200,000+ GA aircraft; DoD FY2024 ~$858B.
| Factor | Metric |
|---|---|
| Tariffs | Up to 25% |
| GNSS satellites | GPS31/Gal24/GL24/BD35 |
| Certification delay | 12–36 months |
| DoD budget | $858B (FY2024) |
What is included in the product
 Detailed Word Document
Explores how external macro-environmental factors uniquely affect Garmin across six dimensions: Political, Economic, Social, Technological, Environmental, and Legal. Each section is data-backed and trend-driven, designed for executives, consultants, and investors to identify risks, opportunities and to support scenario planning and strategic decision-making.

 Customizable Excel Spreadsheet
A concise, visually segmented PESTLE summary tailored for Garmin that highlights external risks and opportunities, ideal for quick insertion into presentations or team planning; editable notes enable region- or product-specific context.
Economic factors

Consumer discretionary cycles
Smartwatches and outdoor devices are highly sensitive to household discretionary spending; Garmin reported roughly $4.77 billion in revenue in fiscal 2023, illustrating exposure to consumer cycles.
During recessions upgrades slow and ASPs compress, while expansions support a shift toward premium models and higher margins.
Bundled services and subscriptions help cushion revenue volatility; inventory discipline is critical to avoid markdowns during demand shocks.
FX and global revenue mix
Garmin's multi-currency sales — roughly half of net revenue — make reported results sensitive to USD moves; fiscal 2024 net sales were about $5.5 billion, so USD strength can materially reduce reported top-line in non‑USD markets. FX swings also alter component and BOM costs, while selective hedging and natural currency offsets in revenues/costs blunt volatility. Localized pricing and regional mix management help defend margins in key markets.

Semiconductor supply and costs
GNSS chipsets, sensors and displays face cyclical constraints that during peaks drove lead times above 20 weeks, raising input prices and pressuring margins; the global semiconductor market was roughly $600 billion in 2024, keeping demand-side tension on specialty components. Strategic supplier partnerships and dual-sourcing have reduced disruption risk, while design reuse and modular architectures cut unit cost volatility across cycles.

B2C and B2B portfolio balance
B2C softness can be cushioned by aviation, marine and enterprise lines, where certification-heavy products have multi-year cycles and higher customer stickiness, while maps and subscription services create recurring revenue and lift customer lifetime value; material shifts toward enterprise/services markedly improve margin stability and predictability.
- Aviation/marine/enterprise offset retail volatility
- Certification categories: longer cycles, higher retention
- Services/maps/subscriptions = recurring revenue, higher LTV
- Portfolio mix shifts materially change profitability
Emerging market expansion
Rising middle classes in emerging markets (≈2.5bn consumers by 2024) bolster demand for fitness wearables and navigation devices, while price elasticity forces Garmin to offer tiered SKUs and financing; localized channels and payment rails (mobile wallets adoption >50% in several EMs) lift conversion; macroeconomic volatility (IMF projects ~4.1% EM growth in 2025) can swiftly disrupt demand and distribution.
- Middle class ~2.5bn (2024)
- Mobile wallets >50% adoption
- Tiered pricing required
- IMF EM growth ~4.1% (2025)
Section 301 tariffs up to 25% raise BOM/margin risk; GNSS, certification delays & DoD pressure
Garmin revenue sensitivity to consumer cycles is evident with fiscal 2023 revenue 4.77 billion and fiscal 2024 net sales ~5.5 billion; roughly 50% of revenue is non‑USD. Recessions compress ASPs while expansions favor premium models; subscriptions and B2B lines increase recurring revenue. Specialty component tightness (global semiconductors ~600 billion in 2024) raises input risk; EM growth and a ~2.5bn middle class support long‑term demand.
| Metric | Value |
|---|---|
| Revenue FY2023 | 4.77B |
| Net Sales FY2024 | ~5.5B |
| Non‑USD share | ~50% |
| Semiconductor market 2024 | ~600B |
| EM middle class 2024 | ~2.5B |
| IMF EM growth 2025 | ~4.1% |
Preview the Actual Deliverable
Garmin PESTLE Analysis
This Garmin PESTLE analysis preview is the exact, fully formatted document you’ll receive after purchase, with no placeholders or edits needed. It presents political, economic, social, technological, legal, and environmental factors in a ready-to-use structure. What you see here is the final file available for instant download after checkout.

Original: $10.00
-65%$10.00
$3.50Product Information
Product Information
Shipping & Returns
Shipping & Returns
Description
Your Shortcut to Market Insight Starts Here
Discover how political shifts, economic trends, social behaviors, technological advances, legal changes, and environmental pressures are shaping Garmin’s strategic path in our concise PESTLE overview. This targeted snapshot highlights risks and opportunities for investors, strategists, and product leaders. Buy the full PESTLE analysis to get the complete, actionable breakdown ready for immediate use.
Political factors
Trade policy and tariffs
Garmin’s global hardware footprint is exposed to import duties across the U.S., EU and Asia; U.S. Section 301 tariffs on many Chinese electronics remain up to 25%, directly raising bill-of-materials costs. Tariff swings force pricing adjustments and can compress margins, so diversifying manufacturing and using FTAs (USMCA, CPTPP, EU FTAs) mitigates risk. Ongoing geopolitical tensions reshape logistics routes and lengthen lead times, raising inventory and delivery costs.
GNSS and spectrum governance
Access to GPS (31 satellites), Galileo (24), GLONASS (24) and BeiDou (35) is governed by national policies and spectrum allocations, affecting Garmin hardware access and features. Jamming and spoofing incidents, plus defense priorities, drive export controls and mandated countermeasures. L‑band spectrum re‑farming debates risk degrading receiver performance, making compliance and targeted lobbying critical to protect signal integrity.
Aviation and marine agency influence
FAA, EASA and maritime authorities set standards that directly affect Garmin flight decks, avionics and marine electronics; certification often adds 12–36 months to product timelines and drove the ADS-B upgrade affecting over 200,000 GA aircraft. Political shifts can accelerate or slow these pipelines, while safety mandates expand addressable markets but raise compliance costs. Public procurement timing, influenced by multi-year budgets (US DoD FY2024 ~$858B), shapes demand cadence.
Localization and industrial policy
Governments increasingly mandate local content, data localization, or national champions, with 60+ countries having data localization or related rules by 2024; this forces Garmin into regional assembly or JV partnerships to qualify for public tenders. Incentives such as tax breaks or grants can materially lower upfront capex but add procurement and compliance burden. Non-compliance risks exclusion from strategic programs and tenders.
- Local content mandates: market access requirement
- Data localization: 60+ countries (2024)
- Incentives: lower capex, higher admin
- Risk: exclusion from tenders/programs
Sanctions and export controls
Sanctions and export controls restrict sales of Garmin navigation systems to sanctioned states and entities; U.S. EAR and ITAR are primary regimes that expanded dual-use coverage in the 2020s and can require licenses for advanced GNSS/IMU features, creating approval delays and channel uncertainty as restricted-party lists update frequently.
- EAR/ITAR: U.S. primary regimes
- Dual-use limits sales to sanctioned entities
- Lists change regularly → channel uncertainty
- Mitigation: strict screening + configurable variants
Section 301 tariffs up to 25% raise BOM/margin risk; GNSS, certification delays & DoD pressure
Garmin faces up to 25% Section 301 tariffs raising BOM costs and margin risk; diversifying production and FTAs mitigate exposure. GNSS access (GPS 31, Galileo 24, GLONASS 24, BeiDou 35) plus jamming/spoofing and L‑band debates drive compliance and lobbying. Certification (FAA/EASA) adds 12–36 months; ADS‑B impacted 200,000+ GA aircraft; DoD FY2024 ~$858B.
| Factor | Metric |
|---|---|
| Tariffs | Up to 25% |
| GNSS satellites | GPS31/Gal24/GL24/BD35 |
| Certification delay | 12–36 months |
| DoD budget | $858B (FY2024) |
What is included in the product
Detailed Word Document
Explores how external macro-environmental factors uniquely affect Garmin across six dimensions: Political, Economic, Social, Technological, Environmental, and Legal. Each section is data-backed and trend-driven, designed for executives, consultants, and investors to identify risks, opportunities and to support scenario planning and strategic decision-making.
Customizable Excel Spreadsheet
A concise, visually segmented PESTLE summary tailored for Garmin that highlights external risks and opportunities, ideal for quick insertion into presentations or team planning; editable notes enable region- or product-specific context.
Economic factors
Consumer discretionary cycles
Smartwatches and outdoor devices are highly sensitive to household discretionary spending; Garmin reported roughly $4.77 billion in revenue in fiscal 2023, illustrating exposure to consumer cycles.
During recessions upgrades slow and ASPs compress, while expansions support a shift toward premium models and higher margins.
Bundled services and subscriptions help cushion revenue volatility; inventory discipline is critical to avoid markdowns during demand shocks.
FX and global revenue mix
Garmin's multi-currency sales — roughly half of net revenue — make reported results sensitive to USD moves; fiscal 2024 net sales were about $5.5 billion, so USD strength can materially reduce reported top-line in non‑USD markets. FX swings also alter component and BOM costs, while selective hedging and natural currency offsets in revenues/costs blunt volatility. Localized pricing and regional mix management help defend margins in key markets.
Semiconductor supply and costs
GNSS chipsets, sensors and displays face cyclical constraints that during peaks drove lead times above 20 weeks, raising input prices and pressuring margins; the global semiconductor market was roughly $600 billion in 2024, keeping demand-side tension on specialty components. Strategic supplier partnerships and dual-sourcing have reduced disruption risk, while design reuse and modular architectures cut unit cost volatility across cycles.
B2C and B2B portfolio balance
B2C softness can be cushioned by aviation, marine and enterprise lines, where certification-heavy products have multi-year cycles and higher customer stickiness, while maps and subscription services create recurring revenue and lift customer lifetime value; material shifts toward enterprise/services markedly improve margin stability and predictability.
- Aviation/marine/enterprise offset retail volatility
- Certification categories: longer cycles, higher retention
- Services/maps/subscriptions = recurring revenue, higher LTV
- Portfolio mix shifts materially change profitability
Emerging market expansion
Rising middle classes in emerging markets (≈2.5bn consumers by 2024) bolster demand for fitness wearables and navigation devices, while price elasticity forces Garmin to offer tiered SKUs and financing; localized channels and payment rails (mobile wallets adoption >50% in several EMs) lift conversion; macroeconomic volatility (IMF projects ~4.1% EM growth in 2025) can swiftly disrupt demand and distribution.
- Middle class ~2.5bn (2024)
- Mobile wallets >50% adoption
- Tiered pricing required
- IMF EM growth ~4.1% (2025)
Section 301 tariffs up to 25% raise BOM/margin risk; GNSS, certification delays & DoD pressure
Garmin revenue sensitivity to consumer cycles is evident with fiscal 2023 revenue 4.77 billion and fiscal 2024 net sales ~5.5 billion; roughly 50% of revenue is non‑USD. Recessions compress ASPs while expansions favor premium models; subscriptions and B2B lines increase recurring revenue. Specialty component tightness (global semiconductors ~600 billion in 2024) raises input risk; EM growth and a ~2.5bn middle class support long‑term demand.
| Metric | Value |
|---|---|
| Revenue FY2023 | 4.77B |
| Net Sales FY2024 | ~5.5B |
| Non‑USD share | ~50% |
| Semiconductor market 2024 | ~600B |
| EM middle class 2024 | ~2.5B |
| IMF EM growth 2025 | ~4.1% |
Preview the Actual Deliverable
Garmin PESTLE Analysis
This Garmin PESTLE analysis preview is the exact, fully formatted document you’ll receive after purchase, with no placeholders or edits needed. It presents political, economic, social, technological, legal, and environmental factors in a ready-to-use structure. What you see here is the final file available for instant download after checkout.











