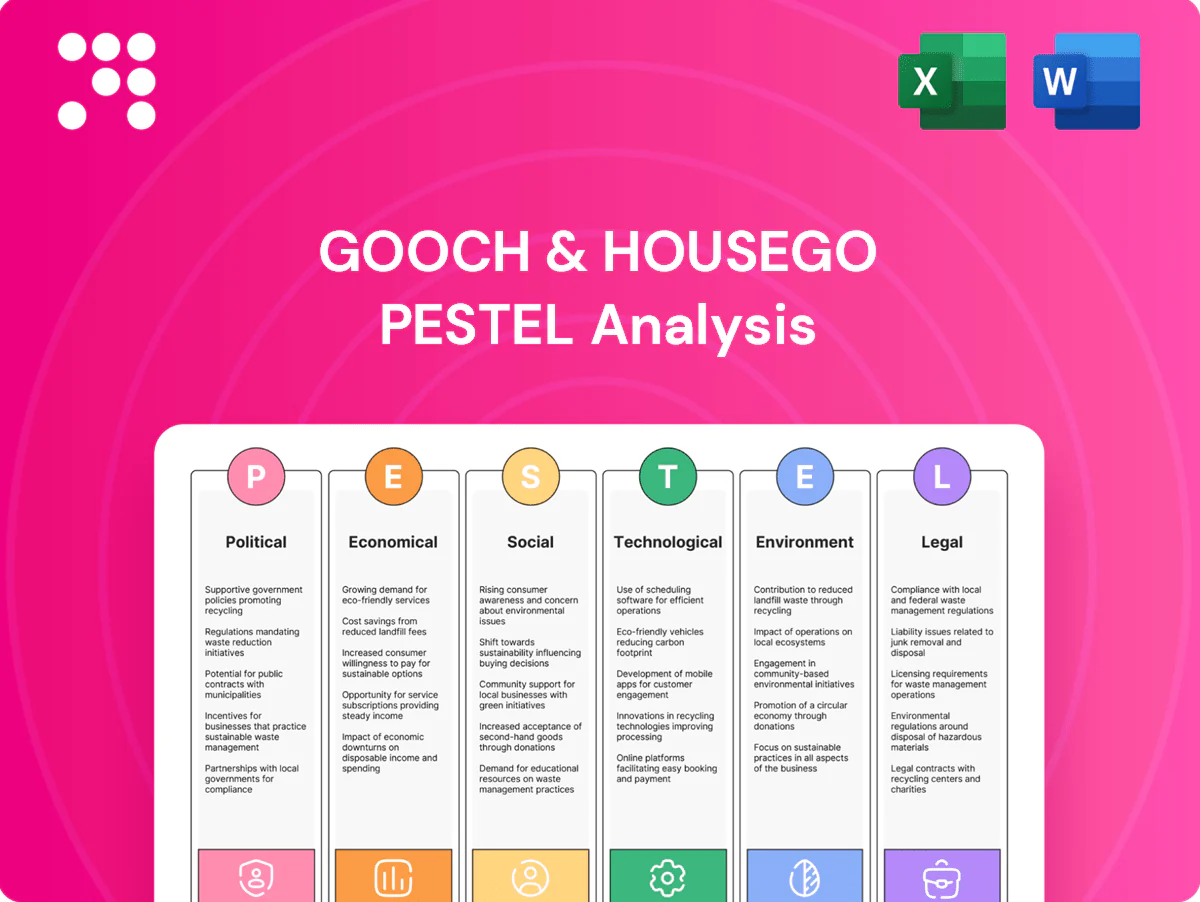
Gooch & Housego PESTLE Analysis

Your Shortcut to Market Insight Starts Here
Get strategic clarity with our PESTLE analysis of Gooch & Housego—uncover how political, economic, social, technological, legal and environmental forces shape its market position and risk profile. The report highlights regulatory pressures, supply-chain dynamics and tech-driven opportunities for growth. Ideal for investors and strategists, purchase the full, editable analysis for instant, actionable insights.
Political factors

Export controls & defense policy
Restrictions under ITAR/EAR and UK export regimes directly govern sales of acousto/electro-optic components into aerospace and defense, forcing Gooch & Housego to secure export licences and implement compliance programs. Licensing timelines routinely extend lead times and raise operating costs through dedicated compliance staff and system controls. Shifts in NATO and AUKUS priorities increase program funding yet tighten technology transfer scrutiny. Balancing US market access with controls on China complicates supply‑chain routing and partner selection.
Industrial strategy & subsidies
US CHIPS and Science Act provides roughly $52 billion in semiconductor incentives, while the EU Chips Act aims to mobilize up to €43 billion and the UK has committed £1 billion+ in targeted innovation grants—shaping photonics supply chains and R&D location. Incentives for advanced manufacturing reduce capex burden for new lines and automation and improve ROI timelines. Priority access to funded consortia accelerates productization in fiber optics and laser modules. Withdrawal of support would slow roadmaps and raise cost of capital.

Geopolitical supply risk
Gooch & Housego faces China-centric risk: China supplied roughly 60–80% of refined rare-earths and over 50% of specialty crystal output by 2024, so trade tensions and 2023–24 export controls can sharply disrupt modulators and Q-switch supply. Dual-sourcing and friendly-shoring strategies, raising unit costs an estimated 5–15%, are increasingly necessary. Political stability in the US, EU and UK, with steady industrial capex and expanding medical device markets, improves demand visibility.

Public procurement cycles
Public procurement cycles drive multi-year optics contracts for defense and research labs, with global military spending at $2.24 trillion in 2023 (SIPRI) underpinning demand for high-precision components. Continuing resolutions or spending cuts often delay orders and testing milestones, while election cycles add volatility to order intake and framework agreements. Long procurement timelines favor suppliers with established compliance and technical heritage but slow new product adoption.
- Dependence: defense/research budgets sustain multi-year projects
- Risk: continuing resolutions delay milestones
- Volatility: election cycles affect order intake
- Barrier: long processes reward heritage suppliers
Standards diplomacy
Standards diplomacy shapes IEC/ISO photonics baselines that drive component specifications; ISO lists 167 member countries in 2025, giving standards global reach. Alignment with US and EU standards streamlines cross‑region qualification and reduces re‑testing. Post‑Brexit divergence has added documented checks for UK exporters and can increase time‑to‑market. Active participation in standards bodies secures interoperability and market access.
- Standards set spec baselines
- ISO 167 members (2025)
- US/EU alignment eases qualification
- Brexit divergence raises documentation/testing burdens
Export controls raise costs; subsidies steer photonics R&D; China supplies 60-80% rare earths
ITAR/EAR and UK export controls raise compliance costs and lead times while NATO/AUKUS shifts lift defense demand but tighten transfers. US CHIPS $52B, EU €43B, UK £1B steer photonics R&D and factory location. China supplies 60–80% of rare earths, forcing 5–15% friendly‑shoring cost increases.
| Factor | Metric | Impact |
|---|---|---|
| Export controls | ITAR/EAR/UK | ↑Compliance, ↑lead time |
| Subsidies | US $52B / EU €43B / UK £1B | ↑R&D,↓capex payback |
| Supply risk | China 60–80% rare earths | ↑Costs 5–15% |
| Defense demand | Global spend $2.24T (2023) | Stable multi‑year contracts |
What is included in the product
 Detailed Word Document
Explores how macro-environmental factors uniquely affect Gooch & Housego across six dimensions—Political, Economic, Social, Technological, Environmental, and Legal—each backed by current data and trends, offering forward-looking insights and detailed sub-points tailored for executives, consultants, and investors, ready for insertion into reports, strategies, or pitch decks.

 Customizable Excel Spreadsheet
A concise, visually segmented PESTLE summary for Gooch & Housego that’s easily dropped into presentations or shared across teams to streamline external risk discussions and support faster strategic alignment.
Economic factors

Industrial cycle sensitivity
Gooch & Housego’s order cadence is tightly linked to capital goods and semiconductor tool demand, with industry equipment spend falling roughly 30% in 2023 before partial recovery in 2024, driving pronounced swings in precision optics and acousto-optic module orders. Downcycles extend customer inventory digestion and pushouts; upcycles tighten capacity, lifting pricing power and product mix. Diversification into medical and A&D reduces but does not eliminate volatility.
Currency exposure
Gooch & Housego’s USD/EUR‑denominated revenue against a GBP cost base creates FX translation and margin swings, with GBP trading near 1.27 USD in mid‑2025 amplifying reported results. Hedging programs reduce near‑term volatility but do not protect against structural shifts in rates. USD‑priced supplier inputs compress margins when the dollar strengthens (USD up ~6% y/y vs GBP in 2024). Geographic production mix can be shifted to balance FX exposure.

Inflation & wage pressure
Skilled photonics engineers and cleanroom technicians are driving wage pressure, with specialist pay rising notably above national averages as demand for optical talent outstrips supply; UK engineering pay growth ran around 6%–7% in 2023–24. Input inflation for crystals, specialty fibers, coatings and energy pushed COGS higher (post-2022 energy shocks), though wholesale gas prices fell roughly 50% from 2022 peaks by 2024. Pricing pass-through works in high-spec niches but lags on commoditizing parts, so automation and yield gains are critical to protect gross margins.

Capex intensity
Coating chambers, metrology and cleanrooms demand continuous capex to sustain yield and scale; ROI hinges on utilization across photonics, aerospace and semiconductor end-markets. Extended customer qualification cycles can push payback beyond typical equipment lives. Public support (eg RDEC at 20% and Horizon Europe funding ~€95.5bn 2021–27) can materially improve project economics.
- High upfront: process tools and cleanrooms
- Utilization-driven ROI: multi-sector demand
- Longer qualification = longer payback
- Grants/tax credits improve NPV
Customer concentration & ASP mix
Large OEMs in lasers, medtech and defense often account for 20–40% of supplier revenues; design wins lock multi-year volumes with stringent quality metrics and service-level agreements. A shift toward higher-complexity subsystems can lift ASPs and margins, frequently by low double-digit percentages, while loss of a platform program creates outsized downside risk.
- Customer concentration: 20–40% revenue from major OEMs
- Design wins: multi-year locked volumes
- ASP mix: +~10–20% with complex subsystems
- Risk: single platform loss → material revenue hit
Export controls raise costs; subsidies steer photonics R&D; China supplies 60-80% rare earths
Demand swings tied to capital goods: industry tool spend down ~30% in 2023 with partial 2024 recovery, driving volatile optics orders. FX and margin swings: USD ~6% stronger vs GBP in 2024; hedges limit near-term but not structural shifts. Input cost pressures: engineering pay +6–7% (2023–24) and energy down ~50% from 2022 peaks by 2024; customer concentration 20–40%.
| Metric | 2023 | 2024/2025 |
|---|---|---|
| Industry tool spend | -30% | Partial recovery |
| USD vs GBP | n/a | +6% (2024) |
| Eng pay growth | 6–7% | 6–7% |
| Energy vs 2022 | Peak | -50% |
Preview Before You Purchase
Gooch & Housego PESTLE Analysis
The preview shown here is the exact document you’ll receive after purchase—fully formatted and ready to use. This Gooch & Housego PESTLE Analysis summarizes political, economic, social, technological, legal and environmental factors affecting the company and highlights strategic risks and opportunities. No placeholders or teasers—this is the final, ready-to-download file you’ll get at checkout.

Product Information
Product Information
Shipping & Returns
Shipping & Returns
Description
Your Shortcut to Market Insight Starts Here
Get strategic clarity with our PESTLE analysis of Gooch & Housego—uncover how political, economic, social, technological, legal and environmental forces shape its market position and risk profile. The report highlights regulatory pressures, supply-chain dynamics and tech-driven opportunities for growth. Ideal for investors and strategists, purchase the full, editable analysis for instant, actionable insights.
Political factors
Export controls & defense policy
Restrictions under ITAR/EAR and UK export regimes directly govern sales of acousto/electro-optic components into aerospace and defense, forcing Gooch & Housego to secure export licences and implement compliance programs. Licensing timelines routinely extend lead times and raise operating costs through dedicated compliance staff and system controls. Shifts in NATO and AUKUS priorities increase program funding yet tighten technology transfer scrutiny. Balancing US market access with controls on China complicates supply‑chain routing and partner selection.
Industrial strategy & subsidies
US CHIPS and Science Act provides roughly $52 billion in semiconductor incentives, while the EU Chips Act aims to mobilize up to €43 billion and the UK has committed £1 billion+ in targeted innovation grants—shaping photonics supply chains and R&D location. Incentives for advanced manufacturing reduce capex burden for new lines and automation and improve ROI timelines. Priority access to funded consortia accelerates productization in fiber optics and laser modules. Withdrawal of support would slow roadmaps and raise cost of capital.
Geopolitical supply risk
Gooch & Housego faces China-centric risk: China supplied roughly 60–80% of refined rare-earths and over 50% of specialty crystal output by 2024, so trade tensions and 2023–24 export controls can sharply disrupt modulators and Q-switch supply. Dual-sourcing and friendly-shoring strategies, raising unit costs an estimated 5–15%, are increasingly necessary. Political stability in the US, EU and UK, with steady industrial capex and expanding medical device markets, improves demand visibility.
Public procurement cycles
Public procurement cycles drive multi-year optics contracts for defense and research labs, with global military spending at $2.24 trillion in 2023 (SIPRI) underpinning demand for high-precision components. Continuing resolutions or spending cuts often delay orders and testing milestones, while election cycles add volatility to order intake and framework agreements. Long procurement timelines favor suppliers with established compliance and technical heritage but slow new product adoption.
- Dependence: defense/research budgets sustain multi-year projects
- Risk: continuing resolutions delay milestones
- Volatility: election cycles affect order intake
- Barrier: long processes reward heritage suppliers
Standards diplomacy
Standards diplomacy shapes IEC/ISO photonics baselines that drive component specifications; ISO lists 167 member countries in 2025, giving standards global reach. Alignment with US and EU standards streamlines cross‑region qualification and reduces re‑testing. Post‑Brexit divergence has added documented checks for UK exporters and can increase time‑to‑market. Active participation in standards bodies secures interoperability and market access.
- Standards set spec baselines
- ISO 167 members (2025)
- US/EU alignment eases qualification
- Brexit divergence raises documentation/testing burdens
Export controls raise costs; subsidies steer photonics R&D; China supplies 60-80% rare earths
ITAR/EAR and UK export controls raise compliance costs and lead times while NATO/AUKUS shifts lift defense demand but tighten transfers. US CHIPS $52B, EU €43B, UK £1B steer photonics R&D and factory location. China supplies 60–80% of rare earths, forcing 5–15% friendly‑shoring cost increases.
| Factor | Metric | Impact |
|---|---|---|
| Export controls | ITAR/EAR/UK | ↑Compliance, ↑lead time |
| Subsidies | US $52B / EU €43B / UK £1B | ↑R&D,↓capex payback |
| Supply risk | China 60–80% rare earths | ↑Costs 5–15% |
| Defense demand | Global spend $2.24T (2023) | Stable multi‑year contracts |
What is included in the product
Detailed Word Document
Explores how macro-environmental factors uniquely affect Gooch & Housego across six dimensions—Political, Economic, Social, Technological, Environmental, and Legal—each backed by current data and trends, offering forward-looking insights and detailed sub-points tailored for executives, consultants, and investors, ready for insertion into reports, strategies, or pitch decks.
Customizable Excel Spreadsheet
A concise, visually segmented PESTLE summary for Gooch & Housego that’s easily dropped into presentations or shared across teams to streamline external risk discussions and support faster strategic alignment.
Economic factors
Industrial cycle sensitivity
Gooch & Housego’s order cadence is tightly linked to capital goods and semiconductor tool demand, with industry equipment spend falling roughly 30% in 2023 before partial recovery in 2024, driving pronounced swings in precision optics and acousto-optic module orders. Downcycles extend customer inventory digestion and pushouts; upcycles tighten capacity, lifting pricing power and product mix. Diversification into medical and A&D reduces but does not eliminate volatility.
Currency exposure
Gooch & Housego’s USD/EUR‑denominated revenue against a GBP cost base creates FX translation and margin swings, with GBP trading near 1.27 USD in mid‑2025 amplifying reported results. Hedging programs reduce near‑term volatility but do not protect against structural shifts in rates. USD‑priced supplier inputs compress margins when the dollar strengthens (USD up ~6% y/y vs GBP in 2024). Geographic production mix can be shifted to balance FX exposure.
Inflation & wage pressure
Skilled photonics engineers and cleanroom technicians are driving wage pressure, with specialist pay rising notably above national averages as demand for optical talent outstrips supply; UK engineering pay growth ran around 6%–7% in 2023–24. Input inflation for crystals, specialty fibers, coatings and energy pushed COGS higher (post-2022 energy shocks), though wholesale gas prices fell roughly 50% from 2022 peaks by 2024. Pricing pass-through works in high-spec niches but lags on commoditizing parts, so automation and yield gains are critical to protect gross margins.
Capex intensity
Coating chambers, metrology and cleanrooms demand continuous capex to sustain yield and scale; ROI hinges on utilization across photonics, aerospace and semiconductor end-markets. Extended customer qualification cycles can push payback beyond typical equipment lives. Public support (eg RDEC at 20% and Horizon Europe funding ~€95.5bn 2021–27) can materially improve project economics.
- High upfront: process tools and cleanrooms
- Utilization-driven ROI: multi-sector demand
- Longer qualification = longer payback
- Grants/tax credits improve NPV
Customer concentration & ASP mix
Large OEMs in lasers, medtech and defense often account for 20–40% of supplier revenues; design wins lock multi-year volumes with stringent quality metrics and service-level agreements. A shift toward higher-complexity subsystems can lift ASPs and margins, frequently by low double-digit percentages, while loss of a platform program creates outsized downside risk.
- Customer concentration: 20–40% revenue from major OEMs
- Design wins: multi-year locked volumes
- ASP mix: +~10–20% with complex subsystems
- Risk: single platform loss → material revenue hit
Export controls raise costs; subsidies steer photonics R&D; China supplies 60-80% rare earths
Demand swings tied to capital goods: industry tool spend down ~30% in 2023 with partial 2024 recovery, driving volatile optics orders. FX and margin swings: USD ~6% stronger vs GBP in 2024; hedges limit near-term but not structural shifts. Input cost pressures: engineering pay +6–7% (2023–24) and energy down ~50% from 2022 peaks by 2024; customer concentration 20–40%.
| Metric | 2023 | 2024/2025 |
|---|---|---|
| Industry tool spend | -30% | Partial recovery |
| USD vs GBP | n/a | +6% (2024) |
| Eng pay growth | 6–7% | 6–7% |
| Energy vs 2022 | Peak | -50% |
Preview Before You Purchase
Gooch & Housego PESTLE Analysis
The preview shown here is the exact document you’ll receive after purchase—fully formatted and ready to use. This Gooch & Housego PESTLE Analysis summarizes political, economic, social, technological, legal and environmental factors affecting the company and highlights strategic risks and opportunities. No placeholders or teasers—this is the final, ready-to-download file you’ll get at checkout.











