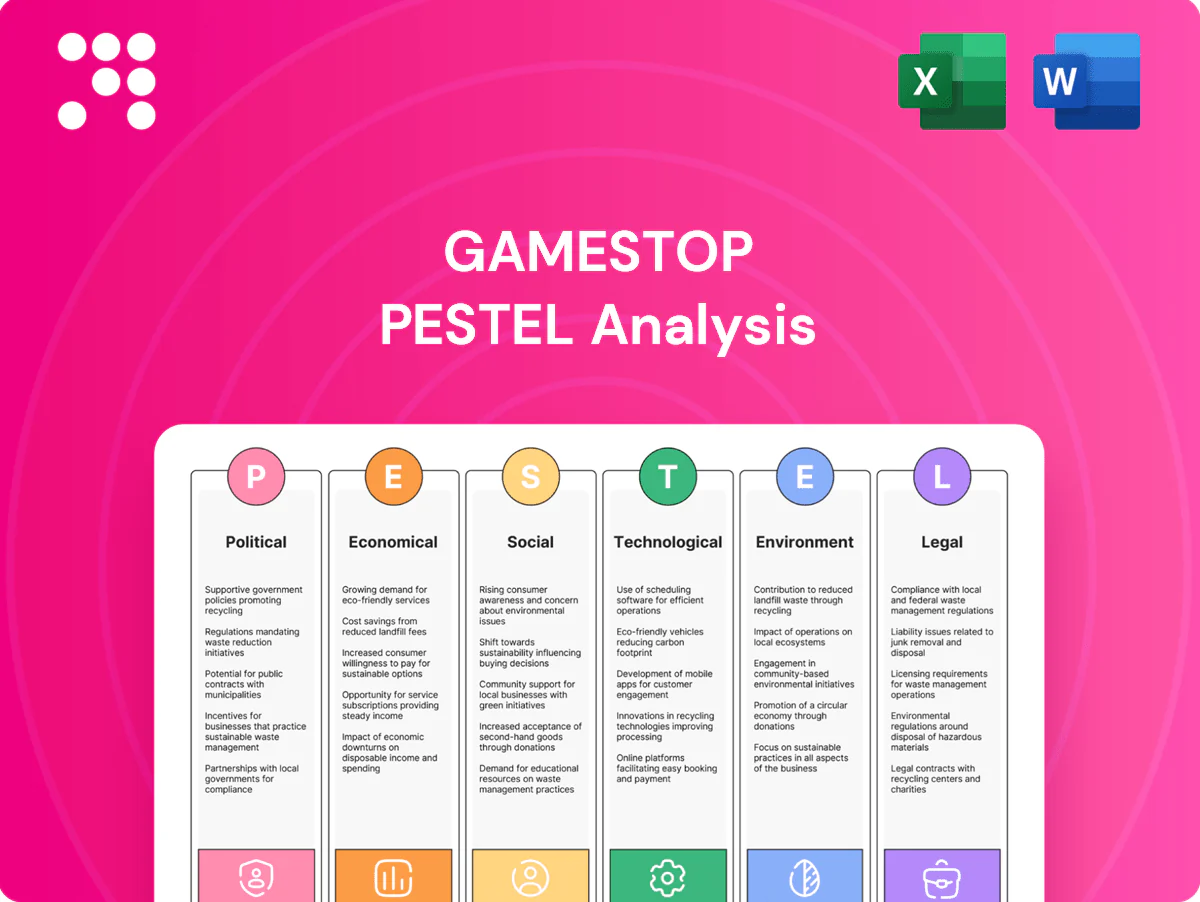
GameStop PESTLE Analysis

Your Competitive Advantage Starts with This Report
Navigate GameStop’s future with our concise PESTLE snapshot—highlighting political risks, economic pressures, social shifts, technological disruption, legal challenges, and environmental trends that matter to investors and strategists. This analysis spotlights actionable implications for value and strategy. Purchase the full PESTLE to access the complete, editable report and make data-driven decisions today.
Political factors

Trade and tariff exposure
Import duties and Section 301 tariffs on Chinese goods—levied at rates up to 25% on select electronics—can raise GameStop’s landed costs for consoles and accessories, squeezing gross margins. Shifts in U.S.-Asia policy and nearshoring to USMCA partners (effective 2020) materially alter pricing flexibility and inventory planning. Preferential trade deals can lower duty exposure while geopolitical tensions and past chip/logistics shocks (container rates spiked to ~20,000 USD in 2021) continue to risk supply disruptions and allocation shortages.
Digital marketplace regulation
EU Digital Markets Act (enforced from 2023) and continued antitrust scrutiny of app stores could rebalance economics between physical and digital channels by enabling alternative stores and lowering gatekeeper fees (Apple standard 30% commission, 15% for small developers). Changes to platform policies may shift pricing and availability of downloadable content, while regulatory pressure can unlock new distribution partnerships; conversely, stricter rules raise compliance overhead for digital sales.

Tax policy and e-commerce nexus
Expansion of sales-tax nexus—46 US states had economic nexus rules by 2024—increases online price parity pressure for GameStop, narrowing e-commerce competitiveness. State and local retail hiring or refurbishment credits (available in multiple states) can offset store costs and support profitability. The US federal corporate tax rate remains 21% (since 2018), affecting reinvestment cash flow, while EU average VAT ~21.4% (2024) shifts international pricing and margin strategies.

Labor and wage policies
Minimum wage hikes (federal $7.25/hr; over 30 states and DC set higher rates) raise GameStop store labor costs and pressure productivity improvements; scheduling and overtime rules—including predictive-scheduling laws in California and New York—reshape staffing for peak release windows. State-by-state divergence complicates SOPs, while federal and state training incentives can boost service quality.
- federal min $7.25/hr; 30+ states/DC higher
- predictive scheduling in CA, NY affects rostering
- training incentives can improve service
- state divergence complicates standardization
Public procurement and incentives
Public procurement and local grants (notably multi-million-dollar incentives offered by states in 2024) and tax abatements for distribution centers can materially lower GameStop’s logistics and occupancy expenses, while economic development programs frequently fund store remodels or community gaming events to boost local engagement and sales.
- Logistics savings: tax abatements reduce property tax burden for distribution centers
- Store support: development programs fund remodels and events
- Main-street focus: municipal foot-traffic initiatives aid retail
- Risk: policy shifts can withdraw support and increase operating costs
Tariffs, supply shocks and taxes squeeze margins, raise inventory risk
Trade tariffs (up to 25%), supply shocks (container peak ~$20,000 in 2021) and nearshoring shifts raise landed costs and inventory risk; DMA/antitrust (from 2023) and app-store fees (30%/15%) alter digital margins; 46 US states had sales-tax nexus by 2024, narrowing online price advantage; federal tax 21%, EU VAT ~21.4%, minimum wage federal $7.25 (30+ states higher) pressure store economics.
| Factor | Key Data |
|---|---|
| Tariffs | Up to 25% |
| Supply shock | Container peak ~$20,000 (2021) |
| Sales tax nexus | 46 states (2024) |
| App fees | 30% / 15% |
| Tax/VAT | Fed corp 21%; EU VAT ~21.4% |
| Wages | Fed $7.25; 30+ states higher |
What is included in the product
 Detailed Word Document
Explores how macro-environmental factors uniquely affect GameStop across six dimensions—Political, Economic, Social, Technological, Environmental, and Legal—backed by relevant data and current trends to surface threats and opportunities. Designed for executives and investors, it offers forward-looking insights and clean formatting ready for business plans, decks, or reports.

 Customizable Excel Spreadsheet
A concise, visually segmented PESTLE summary of GameStop that teams can drop into presentations, edit with notes, and share for quick alignment—helps surface external risks and strategic implications for meetings and client reports.
Economic factors

Consumer discretionary cycles
Video games and collectibles are highly income-sensitive; the global games market was roughly $200 billion in 2024, so household disposable income swings directly affect premium hardware demand. Slowdowns reduce new-console and accessory sales but often raise demand for pre-owned and value-focused offerings. Stimulus or wage gains (US average hourly earnings up about 4% YoY in 2024) can lift average ticket sizes. Rapid post-launch demand drops increase inventory and markdown risk for GameStop.
Inflation and cost pressures
Rising input costs—US CPI 3.4% in 2024, average hourly earnings up ~4.4%—plus elevated freight and vendor charges compress GameStop margins unless passed to consumers; with new AAA MSRP commonly at 69.99, customers shift toward used/trade-ins, pressuring gross margin mix. Higher carrying costs amid ~5.25% policy rates make efficient inventory turns and stronger vendor terms/markdown support critical to protect cash flow.

Console cycle cadence
Console refreshes (PS5 ~50M+ units, Xbox Series ~30M+ by mid-2024) create multi-quarter hardware tailwinds and elevated trade-in flows; late-cycle softening of new-console demand typically boosts accessories and used-game sales, where attach rates (often 3+ paid items per console) drive margins; launch-era supply constraints shift revenue timing and push profitable attach and used inventory to later quarters.

Interest rates and capital access
Higher interest rates (effective Fed funds ~5.33% mid‑2024) raise working‑capital costs for inventory‑heavy retailers like GameStop, squeezing margins and increasing financing expenses. Lower rates would enable remodels, e‑commerce and distribution upgrades; consumer financing availability directly affects $300–$500 console and PC hardware sales. Rate volatility complicates planning for seasonal stock builds and cash buffers.
- Higher rates: higher carrying cost
- Lower rates: capex and remodels
- Financing: drives big‑ticket purchases
- Volatility: hampers seasonal stocking
Currency and global sourcing
FX swings materially affect GameStop: 2024 dollar strength pressured import costs and international store margins, while hedging programs helped stabilize gross margins but increased treasury complexity; suppliers have been known to reprice contracts when the dollar moves, and cross-border e-commerce volumes shift with price competitiveness.
- FX risk: import cost exposure
- Hedging: margin stability vs complexity
- Supplier repricing with USD moves
- Currency swings alter cross-border sales
Tariffs, supply shocks and taxes squeeze margins, raise inventory risk
Economic pressures—global games market ~$200B (2024), US CPI 3.4% and avg hourly earnings ~4.4% YoY—make premium hardware sales income‑sensitive while boosting used/trade demand. Elevated rates (effective Fed funds ~5.33% mid‑2024) and ~5.25% policy rates raise carrying costs; FX strength in 2024 raised import costs and supplier repricing risk.
| Metric | 2024 |
|---|---|
| Global games market | $200B |
| US CPI | 3.4% |
| Fed funds | ~5.33% |
What You See Is What You Get
GameStop PESTLE Analysis
This GameStop PESTLE Analysis preview is the exact, fully formatted document you’ll receive after purchase. It includes the same structure, content, and professional layout shown here. No placeholders or teasers—what you see is the finished file ready to download and use immediately.

Product Information
Product Information
Shipping & Returns
Shipping & Returns
Description
Your Competitive Advantage Starts with This Report
Navigate GameStop’s future with our concise PESTLE snapshot—highlighting political risks, economic pressures, social shifts, technological disruption, legal challenges, and environmental trends that matter to investors and strategists. This analysis spotlights actionable implications for value and strategy. Purchase the full PESTLE to access the complete, editable report and make data-driven decisions today.
Political factors
Trade and tariff exposure
Import duties and Section 301 tariffs on Chinese goods—levied at rates up to 25% on select electronics—can raise GameStop’s landed costs for consoles and accessories, squeezing gross margins. Shifts in U.S.-Asia policy and nearshoring to USMCA partners (effective 2020) materially alter pricing flexibility and inventory planning. Preferential trade deals can lower duty exposure while geopolitical tensions and past chip/logistics shocks (container rates spiked to ~20,000 USD in 2021) continue to risk supply disruptions and allocation shortages.
Digital marketplace regulation
EU Digital Markets Act (enforced from 2023) and continued antitrust scrutiny of app stores could rebalance economics between physical and digital channels by enabling alternative stores and lowering gatekeeper fees (Apple standard 30% commission, 15% for small developers). Changes to platform policies may shift pricing and availability of downloadable content, while regulatory pressure can unlock new distribution partnerships; conversely, stricter rules raise compliance overhead for digital sales.
Tax policy and e-commerce nexus
Expansion of sales-tax nexus—46 US states had economic nexus rules by 2024—increases online price parity pressure for GameStop, narrowing e-commerce competitiveness. State and local retail hiring or refurbishment credits (available in multiple states) can offset store costs and support profitability. The US federal corporate tax rate remains 21% (since 2018), affecting reinvestment cash flow, while EU average VAT ~21.4% (2024) shifts international pricing and margin strategies.
Labor and wage policies
Minimum wage hikes (federal $7.25/hr; over 30 states and DC set higher rates) raise GameStop store labor costs and pressure productivity improvements; scheduling and overtime rules—including predictive-scheduling laws in California and New York—reshape staffing for peak release windows. State-by-state divergence complicates SOPs, while federal and state training incentives can boost service quality.
- federal min $7.25/hr; 30+ states/DC higher
- predictive scheduling in CA, NY affects rostering
- training incentives can improve service
- state divergence complicates standardization
Public procurement and incentives
Public procurement and local grants (notably multi-million-dollar incentives offered by states in 2024) and tax abatements for distribution centers can materially lower GameStop’s logistics and occupancy expenses, while economic development programs frequently fund store remodels or community gaming events to boost local engagement and sales.
- Logistics savings: tax abatements reduce property tax burden for distribution centers
- Store support: development programs fund remodels and events
- Main-street focus: municipal foot-traffic initiatives aid retail
- Risk: policy shifts can withdraw support and increase operating costs
Tariffs, supply shocks and taxes squeeze margins, raise inventory risk
Trade tariffs (up to 25%), supply shocks (container peak ~$20,000 in 2021) and nearshoring shifts raise landed costs and inventory risk; DMA/antitrust (from 2023) and app-store fees (30%/15%) alter digital margins; 46 US states had sales-tax nexus by 2024, narrowing online price advantage; federal tax 21%, EU VAT ~21.4%, minimum wage federal $7.25 (30+ states higher) pressure store economics.
| Factor | Key Data |
|---|---|
| Tariffs | Up to 25% |
| Supply shock | Container peak ~$20,000 (2021) |
| Sales tax nexus | 46 states (2024) |
| App fees | 30% / 15% |
| Tax/VAT | Fed corp 21%; EU VAT ~21.4% |
| Wages | Fed $7.25; 30+ states higher |
What is included in the product
Detailed Word Document
Explores how macro-environmental factors uniquely affect GameStop across six dimensions—Political, Economic, Social, Technological, Environmental, and Legal—backed by relevant data and current trends to surface threats and opportunities. Designed for executives and investors, it offers forward-looking insights and clean formatting ready for business plans, decks, or reports.
Customizable Excel Spreadsheet
A concise, visually segmented PESTLE summary of GameStop that teams can drop into presentations, edit with notes, and share for quick alignment—helps surface external risks and strategic implications for meetings and client reports.
Economic factors
Consumer discretionary cycles
Video games and collectibles are highly income-sensitive; the global games market was roughly $200 billion in 2024, so household disposable income swings directly affect premium hardware demand. Slowdowns reduce new-console and accessory sales but often raise demand for pre-owned and value-focused offerings. Stimulus or wage gains (US average hourly earnings up about 4% YoY in 2024) can lift average ticket sizes. Rapid post-launch demand drops increase inventory and markdown risk for GameStop.
Inflation and cost pressures
Rising input costs—US CPI 3.4% in 2024, average hourly earnings up ~4.4%—plus elevated freight and vendor charges compress GameStop margins unless passed to consumers; with new AAA MSRP commonly at 69.99, customers shift toward used/trade-ins, pressuring gross margin mix. Higher carrying costs amid ~5.25% policy rates make efficient inventory turns and stronger vendor terms/markdown support critical to protect cash flow.
Console cycle cadence
Console refreshes (PS5 ~50M+ units, Xbox Series ~30M+ by mid-2024) create multi-quarter hardware tailwinds and elevated trade-in flows; late-cycle softening of new-console demand typically boosts accessories and used-game sales, where attach rates (often 3+ paid items per console) drive margins; launch-era supply constraints shift revenue timing and push profitable attach and used inventory to later quarters.
Interest rates and capital access
Higher interest rates (effective Fed funds ~5.33% mid‑2024) raise working‑capital costs for inventory‑heavy retailers like GameStop, squeezing margins and increasing financing expenses. Lower rates would enable remodels, e‑commerce and distribution upgrades; consumer financing availability directly affects $300–$500 console and PC hardware sales. Rate volatility complicates planning for seasonal stock builds and cash buffers.
- Higher rates: higher carrying cost
- Lower rates: capex and remodels
- Financing: drives big‑ticket purchases
- Volatility: hampers seasonal stocking
Currency and global sourcing
FX swings materially affect GameStop: 2024 dollar strength pressured import costs and international store margins, while hedging programs helped stabilize gross margins but increased treasury complexity; suppliers have been known to reprice contracts when the dollar moves, and cross-border e-commerce volumes shift with price competitiveness.
- FX risk: import cost exposure
- Hedging: margin stability vs complexity
- Supplier repricing with USD moves
- Currency swings alter cross-border sales
Tariffs, supply shocks and taxes squeeze margins, raise inventory risk
Economic pressures—global games market ~$200B (2024), US CPI 3.4% and avg hourly earnings ~4.4% YoY—make premium hardware sales income‑sensitive while boosting used/trade demand. Elevated rates (effective Fed funds ~5.33% mid‑2024) and ~5.25% policy rates raise carrying costs; FX strength in 2024 raised import costs and supplier repricing risk.
| Metric | 2024 |
|---|---|
| Global games market | $200B |
| US CPI | 3.4% |
| Fed funds | ~5.33% |
What You See Is What You Get
GameStop PESTLE Analysis
This GameStop PESTLE Analysis preview is the exact, fully formatted document you’ll receive after purchase. It includes the same structure, content, and professional layout shown here. No placeholders or teasers—what you see is the finished file ready to download and use immediately.











