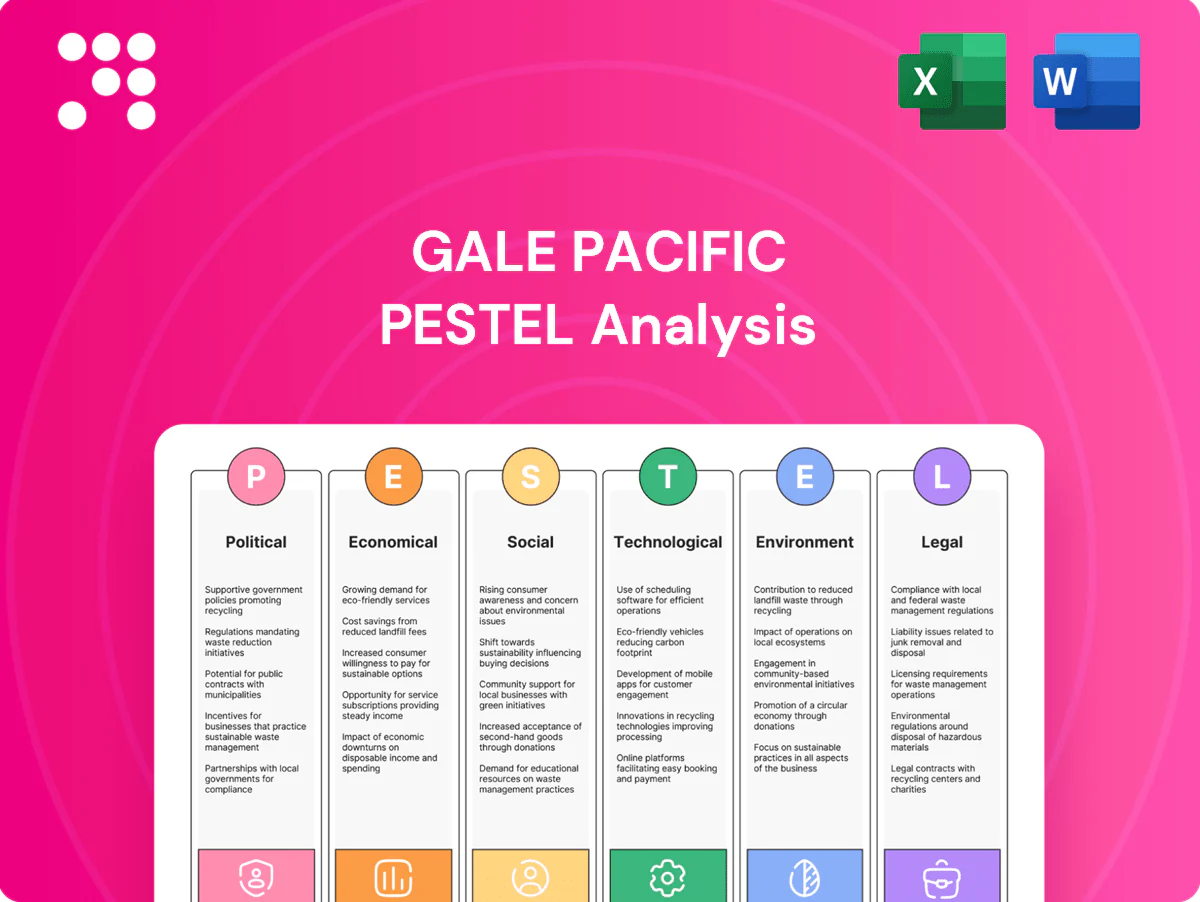
Gale Pacific PESTLE Analysis

Skip the Research. Get the Strategy.
Gain a strategic advantage with our PESTLE Analysis of Gale Pacific. Explore how political, economic, social, technological, legal and environmental forces shape its risks and opportunities. Ideal for investors and strategists seeking actionable intelligence. Buy the full report to access the complete, editable breakdown and make informed decisions.
Political factors

Trade policy volatility
As a global exporter of technical textiles, tariff shifts on polymers, finished fabrics and outdoor goods can quickly compress margins, with the WTO reporting an average applied MFN tariff of about 2.9% in 2022; anti-dumping or safeguard measures in key markets can disrupt pricing and channel access. Proactive sourcing diversification and tariff engineering mitigate shocks, while trade pacts like CPTPP (11 members) and RCEP (15 members) can unlock or constrain regional growth.
Government infrastructure and urban shading
Public investment in smart cities and transit has scaled under major programs—US Bipartisan Infrastructure Law totals $1.2 trillion and EU cohesion funds allocated €392.6 billion for 2021–27—driving demand for shade and screening in hubs, schools and heat-mitigation projects. Procurement rules favoring local content or sustainability certifications materially affect bid competitiveness and margins. Political focus on heat resilience and public health shapes multi-year project pipelines. Stable policy support enables multi-year contracts and predictable revenue streams.

Middle East, Asia-Pacific, and North America geopolitics
Regional tensions in the Middle East, Asia-Pacific and North America disrupt logistics lanes, raising freight surcharges (often +10–25%) and insurance premia for bulky fabric rolls and shade structures, extending lead times by weeks. Sanctions or export controls complicate compliance for certain destinations or inputs. Geopolitically driven currency and energy swings (resin costs +/-10–30%) affect margins. Scenario planning (eg, 60–90 day inventory and alternate carriers) preserves distributor service.

Industrial policy and manufacturing incentives
Industrial policy and manufacturing incentives—notably Australia’s AU$15 billion National Reconstruction Fund—can improve Gale Pacific’s plant economics through subsidies and tax credits for advanced manufacturing and circular materials; removal of such incentives would raise operating costs and impair margins. Cluster policies that promote supplier co-location can shorten lead times and reduce working capital, while active monitoring of grant programs informs timely capex decisions.
- Subsidies/tax credits: improve plant economics
- Withdrawal risk: raises operating costs
- Cluster policy: lowers working capital
- Grant monitoring: enables timely capex
Public health and safety agendas
Public health campaigns on UV risk and the WMO report that 2023 was the warmest year on record bolster uptake of shade products as governments push sun-safe policies; WHO states skin cancer is the most common cancer globally, reinforcing institutional focus on shading. Building and school authorities increasingly mandate sun-safe spaces, expanding demand, though shifting political priorities or budget reallocations could reduce procurement for shading solutions.
- Government campaigns drive market pull
- School/building mandates raise institutional orders
- 2023 warmth spike supports policy urgency
- Budget shifts pose downside risk
Tariff shifts, freight +10–25%, infra $1.2T squeeze margins
Tariff shifts (avg MFN 2.9% in 2022) and trade measures (CPTPP 11 members, RCEP 15) pressure margins and access; infrastructure spending (US $1.2T, EU €392.6B 2021–27) and AU$15B National Reconstruction Fund support institutional demand and capex; freight surcharges (+10–25%) and 2023 as warmest year boost shade procurement but budget shifts remain a downside risk.
| Indicator | Value |
|---|---|
| Avg MFN tariff (2022) | 2.9% |
| US infra | $1.2T |
| EU cohesion | €392.6B |
| Freight surcharge | +10–25% |
What is included in the product
 Detailed Word Document
Explores how Political, Economic, Social, Technological, Environmental and Legal forces specifically impact Gale Pacific, with data-backed trends, industry examples and forward-looking insights to guide strategy, risk management and investor communications.

 Customizable Excel Spreadsheet
A concise, visually segmented Gale Pacific PESTLE summary that can be dropped into presentations or shared across teams to streamline external risk discussions and strategic planning, with editable fields for region- or business-specific notes.
Economic factors

Construction and renovation cycles
Commercial fit-outs, residential renovations and public capex directly drive demand for fabrics and outdoor products; US Infrastructure Investment and Jobs Act commits about 550 billion USD in new spending, supporting retrofit and streetscape projects that use shading and membrane materials.
Construction slowdowns reduce distributor orders and inventory turns, while recovery phases favour premium, durable shading as owners upgrade to lower-maintenance systems.
Exposure can be balanced by diversifying end-markets and offering retrofit-focused SKUs to capture capex-led and renovation-led spend.
Input cost volatility
Polymer resins, pigments and aluminium inputs for Gale Pacific track oil/gas-linked feedstocks (Brent averaged about $86/bbl in 2024), driving resin and pigment price swings and LME aluminium near $2,300/t in 2024. Volatile freight and container rates (SCFI ~1,300 USD/FEU average 2024) raise landed costs for bulky goods. Price-indexed contracts and hedging protect margins. R&D targets 5–10% material-intensity cuts via lighter, stronger fabrics.

Retail demand and seasonality
Gale Pacific (ASX: GAP) faces a 6-month spring–summer peak (Sept–Feb) as DIY and outdoor living demand is weather-driven. Economic downturns push consumers toward value tiers and delay discretionary buys, compressing margins. Omnichannel distribution and private-label partnerships help stabilize sell-through and reduce channel risk. Strict inventory discipline is essential to avoid end-of-season markdowns and cashflow strain.

Currency movements
Gale Pacific earns and spends across AUD, USD and other currencies, creating translation and transaction risk that affected margins in 2024 when AUD ranged roughly 0.60–0.77 USD; a stronger AUD compressed export competitiveness for Australian-made products. Multi-country sourcing and local pricing provide natural hedges, while financial hedges (forwards/options) are used to smooth earnings visibility for investors.
- currency-exposure
- AUD-USD 2024 range ~0.60–0.77
- natural-hedging
- financial-hedging
Distributor and channel health
Hardware chains, garden centers and building merchants drive volume for Gale Pacific, with Bunnings holding about 53% of the Australian DIY/hardware market in 2024; consolidation in these channels increases retailer bargaining power and rebate pressures. Economic stress on smaller distributors and rising SME financial strain in 2023–24 heightens credit risk; diversifying into e-commerce and project channels reduces dependence.
- Channel concentration: Bunnings ~53% (2024)
- Higher rebate pressure from consolidated buyers
- SME distributor credit risk up in 2023–24
- Growth in e-commerce/project channels lowers single-channel exposure
Tariff shifts, freight +10–25%, infra $1.2T squeeze margins
Demand tied to commercial fit-outs, DIY seasonality and US capex; construction slowdowns cut orders while retrofit/premium upgrades buoy margins. Input cost swings hurt gross margin—Brent ~$86/bbl, LME Al ~$2,300/t, SCFI ~1,300 USD/FEU in 2024—while AUD-USD 0.60–0.77 affects export competitiveness; channel concentration (Bunnings ~53%) raises rebate pressure.
| Metric | 2024 value |
|---|---|
| Brent oil | ~86 USD/bbl |
| LME aluminium | ~2,300 USD/t |
| SCFI freight | ~1,300 USD/FEU |
| AUD-USD | 0.60–0.77 |
| Bunnings share | ~53% |
Same Document Delivered
Gale Pacific PESTLE Analysis
The Gale Pacific PESTLE Analysis preview shown here is the exact document you’ll receive after purchase—fully formatted, professionally structured, and ready to use. This is the real file you’re buying with no placeholders or teasers, delivered exactly as shown. After payment you’ll be able to download this final version instantly.

Original: $10.00
-65%$10.00
$3.50Product Information
Product Information
Shipping & Returns
Shipping & Returns
Description
Skip the Research. Get the Strategy.
Gain a strategic advantage with our PESTLE Analysis of Gale Pacific. Explore how political, economic, social, technological, legal and environmental forces shape its risks and opportunities. Ideal for investors and strategists seeking actionable intelligence. Buy the full report to access the complete, editable breakdown and make informed decisions.
Political factors
Trade policy volatility
As a global exporter of technical textiles, tariff shifts on polymers, finished fabrics and outdoor goods can quickly compress margins, with the WTO reporting an average applied MFN tariff of about 2.9% in 2022; anti-dumping or safeguard measures in key markets can disrupt pricing and channel access. Proactive sourcing diversification and tariff engineering mitigate shocks, while trade pacts like CPTPP (11 members) and RCEP (15 members) can unlock or constrain regional growth.
Government infrastructure and urban shading
Public investment in smart cities and transit has scaled under major programs—US Bipartisan Infrastructure Law totals $1.2 trillion and EU cohesion funds allocated €392.6 billion for 2021–27—driving demand for shade and screening in hubs, schools and heat-mitigation projects. Procurement rules favoring local content or sustainability certifications materially affect bid competitiveness and margins. Political focus on heat resilience and public health shapes multi-year project pipelines. Stable policy support enables multi-year contracts and predictable revenue streams.
Middle East, Asia-Pacific, and North America geopolitics
Regional tensions in the Middle East, Asia-Pacific and North America disrupt logistics lanes, raising freight surcharges (often +10–25%) and insurance premia for bulky fabric rolls and shade structures, extending lead times by weeks. Sanctions or export controls complicate compliance for certain destinations or inputs. Geopolitically driven currency and energy swings (resin costs +/-10–30%) affect margins. Scenario planning (eg, 60–90 day inventory and alternate carriers) preserves distributor service.
Industrial policy and manufacturing incentives
Industrial policy and manufacturing incentives—notably Australia’s AU$15 billion National Reconstruction Fund—can improve Gale Pacific’s plant economics through subsidies and tax credits for advanced manufacturing and circular materials; removal of such incentives would raise operating costs and impair margins. Cluster policies that promote supplier co-location can shorten lead times and reduce working capital, while active monitoring of grant programs informs timely capex decisions.
- Subsidies/tax credits: improve plant economics
- Withdrawal risk: raises operating costs
- Cluster policy: lowers working capital
- Grant monitoring: enables timely capex
Public health and safety agendas
Public health campaigns on UV risk and the WMO report that 2023 was the warmest year on record bolster uptake of shade products as governments push sun-safe policies; WHO states skin cancer is the most common cancer globally, reinforcing institutional focus on shading. Building and school authorities increasingly mandate sun-safe spaces, expanding demand, though shifting political priorities or budget reallocations could reduce procurement for shading solutions.
- Government campaigns drive market pull
- School/building mandates raise institutional orders
- 2023 warmth spike supports policy urgency
- Budget shifts pose downside risk
Tariff shifts, freight +10–25%, infra $1.2T squeeze margins
Tariff shifts (avg MFN 2.9% in 2022) and trade measures (CPTPP 11 members, RCEP 15) pressure margins and access; infrastructure spending (US $1.2T, EU €392.6B 2021–27) and AU$15B National Reconstruction Fund support institutional demand and capex; freight surcharges (+10–25%) and 2023 as warmest year boost shade procurement but budget shifts remain a downside risk.
| Indicator | Value |
|---|---|
| Avg MFN tariff (2022) | 2.9% |
| US infra | $1.2T |
| EU cohesion | €392.6B |
| Freight surcharge | +10–25% |
What is included in the product
Detailed Word Document
Explores how Political, Economic, Social, Technological, Environmental and Legal forces specifically impact Gale Pacific, with data-backed trends, industry examples and forward-looking insights to guide strategy, risk management and investor communications.
Customizable Excel Spreadsheet
A concise, visually segmented Gale Pacific PESTLE summary that can be dropped into presentations or shared across teams to streamline external risk discussions and strategic planning, with editable fields for region- or business-specific notes.
Economic factors
Construction and renovation cycles
Commercial fit-outs, residential renovations and public capex directly drive demand for fabrics and outdoor products; US Infrastructure Investment and Jobs Act commits about 550 billion USD in new spending, supporting retrofit and streetscape projects that use shading and membrane materials.
Construction slowdowns reduce distributor orders and inventory turns, while recovery phases favour premium, durable shading as owners upgrade to lower-maintenance systems.
Exposure can be balanced by diversifying end-markets and offering retrofit-focused SKUs to capture capex-led and renovation-led spend.
Input cost volatility
Polymer resins, pigments and aluminium inputs for Gale Pacific track oil/gas-linked feedstocks (Brent averaged about $86/bbl in 2024), driving resin and pigment price swings and LME aluminium near $2,300/t in 2024. Volatile freight and container rates (SCFI ~1,300 USD/FEU average 2024) raise landed costs for bulky goods. Price-indexed contracts and hedging protect margins. R&D targets 5–10% material-intensity cuts via lighter, stronger fabrics.
Retail demand and seasonality
Gale Pacific (ASX: GAP) faces a 6-month spring–summer peak (Sept–Feb) as DIY and outdoor living demand is weather-driven. Economic downturns push consumers toward value tiers and delay discretionary buys, compressing margins. Omnichannel distribution and private-label partnerships help stabilize sell-through and reduce channel risk. Strict inventory discipline is essential to avoid end-of-season markdowns and cashflow strain.
Currency movements
Gale Pacific earns and spends across AUD, USD and other currencies, creating translation and transaction risk that affected margins in 2024 when AUD ranged roughly 0.60–0.77 USD; a stronger AUD compressed export competitiveness for Australian-made products. Multi-country sourcing and local pricing provide natural hedges, while financial hedges (forwards/options) are used to smooth earnings visibility for investors.
- currency-exposure
- AUD-USD 2024 range ~0.60–0.77
- natural-hedging
- financial-hedging
Distributor and channel health
Hardware chains, garden centers and building merchants drive volume for Gale Pacific, with Bunnings holding about 53% of the Australian DIY/hardware market in 2024; consolidation in these channels increases retailer bargaining power and rebate pressures. Economic stress on smaller distributors and rising SME financial strain in 2023–24 heightens credit risk; diversifying into e-commerce and project channels reduces dependence.
- Channel concentration: Bunnings ~53% (2024)
- Higher rebate pressure from consolidated buyers
- SME distributor credit risk up in 2023–24
- Growth in e-commerce/project channels lowers single-channel exposure
Tariff shifts, freight +10–25%, infra $1.2T squeeze margins
Demand tied to commercial fit-outs, DIY seasonality and US capex; construction slowdowns cut orders while retrofit/premium upgrades buoy margins. Input cost swings hurt gross margin—Brent ~$86/bbl, LME Al ~$2,300/t, SCFI ~1,300 USD/FEU in 2024—while AUD-USD 0.60–0.77 affects export competitiveness; channel concentration (Bunnings ~53%) raises rebate pressure.
| Metric | 2024 value |
|---|---|
| Brent oil | ~86 USD/bbl |
| LME aluminium | ~2,300 USD/t |
| SCFI freight | ~1,300 USD/FEU |
| AUD-USD | 0.60–0.77 |
| Bunnings share | ~53% |
Same Document Delivered
Gale Pacific PESTLE Analysis
The Gale Pacific PESTLE Analysis preview shown here is the exact document you’ll receive after purchase—fully formatted, professionally structured, and ready to use. This is the real file you’re buying with no placeholders or teasers, delivered exactly as shown. After payment you’ll be able to download this final version instantly.











