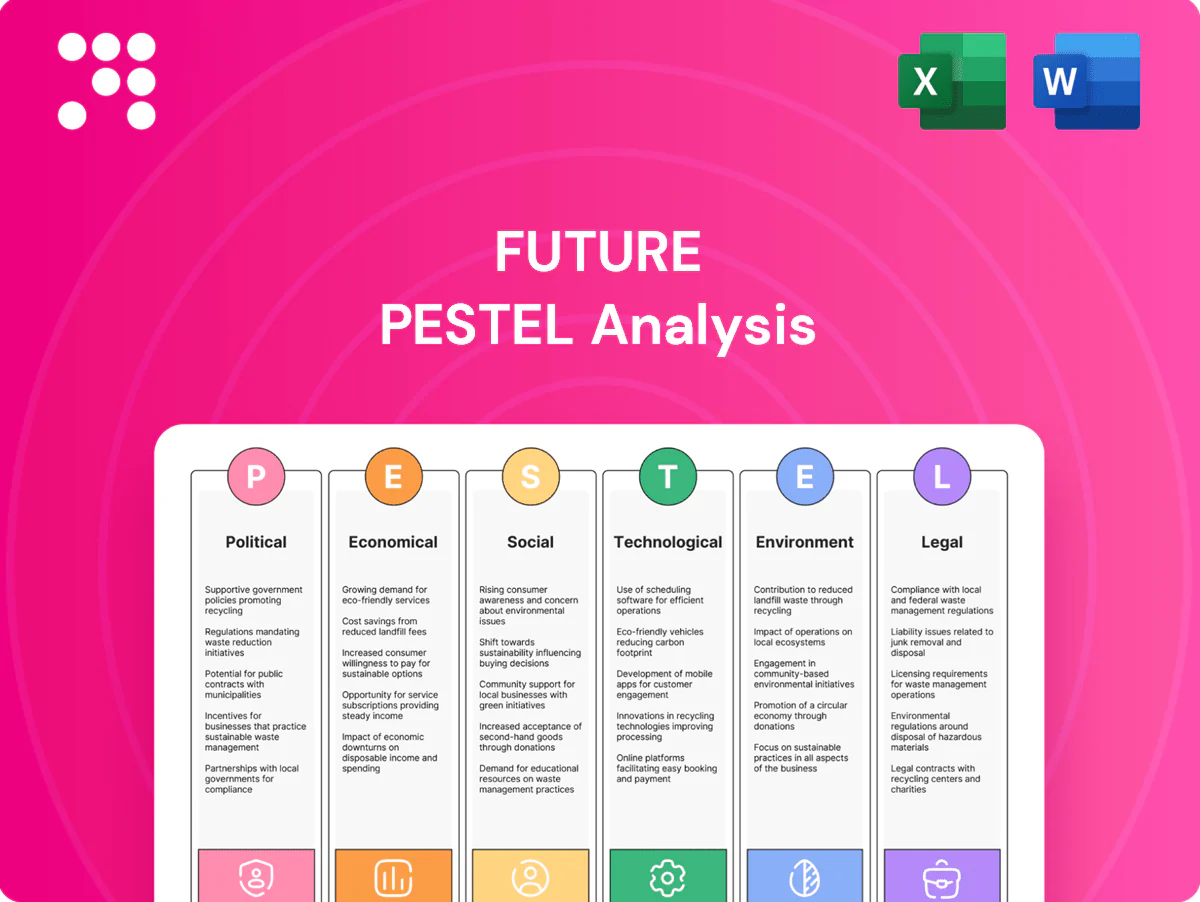
Future PESTLE Analysis

Make Smarter Strategic Decisions with a Complete PESTEL View
Gain a competitive edge with our PESTLE Analysis of Future—three to five expert-led sections revealing political, economic, social, technological, legal, and environmental drivers shaping the company’s outlook. Ideal for investors and strategists, it’s fully sourced and actionable; purchase the full report to unlock the detailed insights and ready-to-use recommendations.
Political factors

Geopolitical ad spend volatility
Conflicts and elections can freeze or redirect marketing budgets, pressuring CPMs and affiliate conversions—US political ad spend topped about 11 billion in 2024, pulling dollars from commercial channels. Future tech and gaming verticals saw pronounced brand-safety pullbacks, with CPMs reported to drop up to a third in high-risk windows. Government messaging campaigns partly offset weakness in commercial categories. Regional diversification smooths shock impacts.
Digital services taxes
Country-level digital services taxes such as the UK 2% DST raise costs for cross-border advertising and e-commerce, with 30+ jurisdictions having enacted or proposed similar levies by 2024. Platforms often pass these taxes to advertisers or publishers, compressing publisher margins and lowering yield per ad. Pricing and yield management must incorporate jurisdictional variance and the OECD Pillar One reallocation framework (about $125bn of profit). Tax-efficient structuring and establishing local sales presence can mitigate leakage.

Public media funding shifts
Policy shifts in public broadcaster and culture grant budgets reshape competitive dynamics: EU Creative Europe totals €2.44bn for 2021–27 and US federal support for public broadcasting (CPB) has been around $445m annually, showing scale. Reduced public funding drives audiences to commercial specialist media, while increased subsidies intensify competition for attention. Industry bodies and advocacy shape these outcomes through lobbying and grant negotiations.

Platform regulation pressure
Governments are tightening rules on platforms: the EU Digital Markets Act (effective 2024) names 22 gatekeepers and requires greater algorithm transparency and interoperability, risking mandated revenue sharing. With Google and Meta capturing ~66% of US digital ad spend in 2023 and many publishers relying on over 50% of referrals from big platforms, traffic and monetization could drop. Future strategy must diversify channels and accelerate newsletters and community-first direct audience capture.
- DMA 2024: 22 gatekeepers
- Google/Meta ~66% US ad spend (2023)
- Publishers often >50% referrals from major platforms
- Priority: multi-channel distribution, newsletters, communities
Trade and supply chain policy
Tariffs and export controls have driven higher paper and ink procurement costs and lengthened delivery windows, pushing publishers to hedge suppliers and shift print runs closer to demand; 2024 policy-driven postal rate increases tightened per-unit magazine margins. Cross-border subscription fulfillment faces customs frictions and unpredictable duties, raising churn and returns costs. Nearshoring and digital-first formats are reducing exposure to these risks.
- Tariffs raise input costs
- Postal rate hikes cut margins
- Customs friction for subscriptions
- Nearshoring/digital reduce exposure
Political ad shift $11bn strains CPMs; platform dominance, DSTs
Political cycles, wars and sanctions reallocate ad budgets—US political ad spend ~11bn in 2024—pressuring CPMs and conversions. Regulatory moves (EU DMA 2024: 22 gatekeepers) and platform dominance (Google/Meta ~66% US ad spend 2023) risk traffic and revenue concentration. 30+ DSTs by 2024 and OECD Pillar One (~$125bn) raise cross‑border costs; tariffs/postal hikes in 2024 squeeze print margins.
| Metric | Value |
|---|---|
| US political ad spend (2024) | $11bn |
| DMA gatekeepers (2024) | 22 |
| Google/Meta share (2023) | ~66% |
| Jurisdictions with DSTs (2024) | 30+ |
| OECD Pillar One realloc. | ~$125bn |
What is included in the product
 Detailed Word Document
Explores how Political, Economic, Social, Technological, Environmental, and Legal forces uniquely shape the Future, with data-backed trends, forward-looking scenarios, and industry-specific examples to inform strategy, risk mitigation, and investor-ready planning.

 Customizable Excel Spreadsheet
Provides forward-looking PESTLE summaries that condense emerging trends, risks, and opportunities into actionable bullets for quick reference, easing stakeholder alignment in meetings and strategic planning.
Economic factors

Advertising cycle sensitivity
Ad revenue is highly cyclical, closely tracking GDP and business confidence—global GDP contracted ~3.5% in 2020 while ad spend fell sharply, and US digital ad spend reached roughly $211bn in 2023 (IAB), highlighting sensitivity to macro swings. Performance marketing typically holds up better than brand spend in downturns as measurable ROI drives reallocation. Diversifying into subscriptions and e-commerce smooths volatility, while yield optimization and strict floor-price discipline preserve margins.
Consumer discretionary pressure
Subscriptions and print purchases increasingly compete for constrained household budgets as consumers prioritize essentials over discretionary media spending.
US CPI year-over-year stood near 3.3% (mid-2025) and the federal funds rate remained in the 5.25–5.50% band, conditions that directly raise acquisition costs and can increase churn.
Bundled offerings and annual plans have proven effective at defending ARPU, while value-rich niche content measurably improves willingness to pay.

Affiliate and e-commerce demand
Retailer promotions, returns policies and conversion rates materially drive affiliate take: affiliates account for about 16% of e-commerce transactions (Awin) while global e-commerce sales reached roughly $6.3 trillion in 2023 (Statista). Seasonality concentrates revenue—Adobe reported Cyber Monday 2023 online sales of $11.3 billion. Average online return rates run near 15–20%, and merchant commission restructures (eg. historical Amazon cuts) can swing earnings sharply; broader merchant mix and price-comparison tools dampen volatility.

FX and global revenue mix
Multi-currency exposure materially alters reported revenues and input costs; USD strength (about 4% vs EUR in 2024) compressed Euro-denominated programmatic yields while GBP moves weighed on UK revenues. Programmatic yields and cloud fees billed in USD rose relative to local currencies, increasing cost of goods sold for EMEA/APAC operations. Natural hedges from local staff and sourcing mitigate some risk but formal hedging policies are required and pricing localization supports margin stability.
- FX impact: USD ~4% stronger vs EUR in 2024
- Costs: USD-denominated cloud fees and programmatic yields up vs local currencies
- Mitigation: local cost base provides natural hedge; implement hedging and localized pricing
Cost inflation in production
Rising input costs squeeze margins: paper costs rose ~12% and postage ~8% in 2024 while talent costs climbed about 6%, and cloud and martech spend grew roughly 20% year-on-year as usage scaled. Process automation and vendor consolidation offset opex growth, and print rationalization frees capital for higher-ROI digital investments.
- paper +12% (2024)
- postage +8% (2024)
- talent +6% (2024)
- cloud/martech +20% YoY
Political ad shift $11bn strains CPMs; platform dominance, DSTs
Ad revenue remains cyclical—US digital ad spend ~$211bn (2023) and global e‑commerce ~$6.3tn (2023); performance marketing holds up in downturns while subscriptions and e‑commerce smooth volatility. Mid‑2025 US CPI ~3.3% and fed funds 5.25–5.50% raise acquisition costs and churn risk. FX (USD ~+4% vs EUR in 2024) and input inflation (paper +12%, postage +8%, cloud +20%) squeeze margins.
| Metric | Value |
|---|---|
| US digital ad spend (2023) | $211bn |
| Global e‑commerce (2023) | $6.3tn |
| US CPI (mid‑2025) | ~3.3% |
| Fed funds (mid‑2025) | 5.25–5.50% |
| USD vs EUR (2024) | ~+4% |
Preview the Actual Deliverable
Future PESTLE Analysis
The preview shown here is the exact Future PESTLE Analysis document you’ll receive after purchase—fully formatted, professionally structured, and ready to use. This is a real screenshot of the product with no placeholders or teasers. After checkout you’ll instantly download this same finished file, content and layout identical to what you see.

Product Information
Product Information
Shipping & Returns
Shipping & Returns
Description
Make Smarter Strategic Decisions with a Complete PESTEL View
Gain a competitive edge with our PESTLE Analysis of Future—three to five expert-led sections revealing political, economic, social, technological, legal, and environmental drivers shaping the company’s outlook. Ideal for investors and strategists, it’s fully sourced and actionable; purchase the full report to unlock the detailed insights and ready-to-use recommendations.
Political factors
Geopolitical ad spend volatility
Conflicts and elections can freeze or redirect marketing budgets, pressuring CPMs and affiliate conversions—US political ad spend topped about 11 billion in 2024, pulling dollars from commercial channels. Future tech and gaming verticals saw pronounced brand-safety pullbacks, with CPMs reported to drop up to a third in high-risk windows. Government messaging campaigns partly offset weakness in commercial categories. Regional diversification smooths shock impacts.
Digital services taxes
Country-level digital services taxes such as the UK 2% DST raise costs for cross-border advertising and e-commerce, with 30+ jurisdictions having enacted or proposed similar levies by 2024. Platforms often pass these taxes to advertisers or publishers, compressing publisher margins and lowering yield per ad. Pricing and yield management must incorporate jurisdictional variance and the OECD Pillar One reallocation framework (about $125bn of profit). Tax-efficient structuring and establishing local sales presence can mitigate leakage.
Public media funding shifts
Policy shifts in public broadcaster and culture grant budgets reshape competitive dynamics: EU Creative Europe totals €2.44bn for 2021–27 and US federal support for public broadcasting (CPB) has been around $445m annually, showing scale. Reduced public funding drives audiences to commercial specialist media, while increased subsidies intensify competition for attention. Industry bodies and advocacy shape these outcomes through lobbying and grant negotiations.
Platform regulation pressure
Governments are tightening rules on platforms: the EU Digital Markets Act (effective 2024) names 22 gatekeepers and requires greater algorithm transparency and interoperability, risking mandated revenue sharing. With Google and Meta capturing ~66% of US digital ad spend in 2023 and many publishers relying on over 50% of referrals from big platforms, traffic and monetization could drop. Future strategy must diversify channels and accelerate newsletters and community-first direct audience capture.
- DMA 2024: 22 gatekeepers
- Google/Meta ~66% US ad spend (2023)
- Publishers often >50% referrals from major platforms
- Priority: multi-channel distribution, newsletters, communities
Trade and supply chain policy
Tariffs and export controls have driven higher paper and ink procurement costs and lengthened delivery windows, pushing publishers to hedge suppliers and shift print runs closer to demand; 2024 policy-driven postal rate increases tightened per-unit magazine margins. Cross-border subscription fulfillment faces customs frictions and unpredictable duties, raising churn and returns costs. Nearshoring and digital-first formats are reducing exposure to these risks.
- Tariffs raise input costs
- Postal rate hikes cut margins
- Customs friction for subscriptions
- Nearshoring/digital reduce exposure
Political ad shift $11bn strains CPMs; platform dominance, DSTs
Political cycles, wars and sanctions reallocate ad budgets—US political ad spend ~11bn in 2024—pressuring CPMs and conversions. Regulatory moves (EU DMA 2024: 22 gatekeepers) and platform dominance (Google/Meta ~66% US ad spend 2023) risk traffic and revenue concentration. 30+ DSTs by 2024 and OECD Pillar One (~$125bn) raise cross‑border costs; tariffs/postal hikes in 2024 squeeze print margins.
| Metric | Value |
|---|---|
| US political ad spend (2024) | $11bn |
| DMA gatekeepers (2024) | 22 |
| Google/Meta share (2023) | ~66% |
| Jurisdictions with DSTs (2024) | 30+ |
| OECD Pillar One realloc. | ~$125bn |
What is included in the product
Detailed Word Document
Explores how Political, Economic, Social, Technological, Environmental, and Legal forces uniquely shape the Future, with data-backed trends, forward-looking scenarios, and industry-specific examples to inform strategy, risk mitigation, and investor-ready planning.
Customizable Excel Spreadsheet
Provides forward-looking PESTLE summaries that condense emerging trends, risks, and opportunities into actionable bullets for quick reference, easing stakeholder alignment in meetings and strategic planning.
Economic factors
Advertising cycle sensitivity
Ad revenue is highly cyclical, closely tracking GDP and business confidence—global GDP contracted ~3.5% in 2020 while ad spend fell sharply, and US digital ad spend reached roughly $211bn in 2023 (IAB), highlighting sensitivity to macro swings. Performance marketing typically holds up better than brand spend in downturns as measurable ROI drives reallocation. Diversifying into subscriptions and e-commerce smooths volatility, while yield optimization and strict floor-price discipline preserve margins.
Consumer discretionary pressure
Subscriptions and print purchases increasingly compete for constrained household budgets as consumers prioritize essentials over discretionary media spending.
US CPI year-over-year stood near 3.3% (mid-2025) and the federal funds rate remained in the 5.25–5.50% band, conditions that directly raise acquisition costs and can increase churn.
Bundled offerings and annual plans have proven effective at defending ARPU, while value-rich niche content measurably improves willingness to pay.
Affiliate and e-commerce demand
Retailer promotions, returns policies and conversion rates materially drive affiliate take: affiliates account for about 16% of e-commerce transactions (Awin) while global e-commerce sales reached roughly $6.3 trillion in 2023 (Statista). Seasonality concentrates revenue—Adobe reported Cyber Monday 2023 online sales of $11.3 billion. Average online return rates run near 15–20%, and merchant commission restructures (eg. historical Amazon cuts) can swing earnings sharply; broader merchant mix and price-comparison tools dampen volatility.
FX and global revenue mix
Multi-currency exposure materially alters reported revenues and input costs; USD strength (about 4% vs EUR in 2024) compressed Euro-denominated programmatic yields while GBP moves weighed on UK revenues. Programmatic yields and cloud fees billed in USD rose relative to local currencies, increasing cost of goods sold for EMEA/APAC operations. Natural hedges from local staff and sourcing mitigate some risk but formal hedging policies are required and pricing localization supports margin stability.
- FX impact: USD ~4% stronger vs EUR in 2024
- Costs: USD-denominated cloud fees and programmatic yields up vs local currencies
- Mitigation: local cost base provides natural hedge; implement hedging and localized pricing
Cost inflation in production
Rising input costs squeeze margins: paper costs rose ~12% and postage ~8% in 2024 while talent costs climbed about 6%, and cloud and martech spend grew roughly 20% year-on-year as usage scaled. Process automation and vendor consolidation offset opex growth, and print rationalization frees capital for higher-ROI digital investments.
- paper +12% (2024)
- postage +8% (2024)
- talent +6% (2024)
- cloud/martech +20% YoY
Political ad shift $11bn strains CPMs; platform dominance, DSTs
Ad revenue remains cyclical—US digital ad spend ~$211bn (2023) and global e‑commerce ~$6.3tn (2023); performance marketing holds up in downturns while subscriptions and e‑commerce smooth volatility. Mid‑2025 US CPI ~3.3% and fed funds 5.25–5.50% raise acquisition costs and churn risk. FX (USD ~+4% vs EUR in 2024) and input inflation (paper +12%, postage +8%, cloud +20%) squeeze margins.
| Metric | Value |
|---|---|
| US digital ad spend (2023) | $211bn |
| Global e‑commerce (2023) | $6.3tn |
| US CPI (mid‑2025) | ~3.3% |
| Fed funds (mid‑2025) | 5.25–5.50% |
| USD vs EUR (2024) | ~+4% |
Preview the Actual Deliverable
Future PESTLE Analysis
The preview shown here is the exact Future PESTLE Analysis document you’ll receive after purchase—fully formatted, professionally structured, and ready to use. This is a real screenshot of the product with no placeholders or teasers. After checkout you’ll instantly download this same finished file, content and layout identical to what you see.











